
Attachment 1
NAME
ALLERGON
AB
Attachment 1
|
Report
Update On |
20th July 2005 |
|
|
|
|
Correct Name |
ALLERGON AB |
|
|
|
|
Registered Office |
Vallingevagen 309 262 92 Angelholm , Sweden. |
|
|
|
|
Tel. No. |
+46-42-33 44 00 |
Attachment 2
SUMMARY
|
Incorporated |
1963-11 |
Status |
Satisfactory |
|
|
|
|
|
|
Registration No. |
556089-9899 |
Chief Executive |
Nils Stellan Dybner |
|
|
|
|
|
|
Capital |
|
Payments |
No Complaints |
|
|
|
|
|
|
Sales (TSEK) |
42775 |
Litigation |
Clear |
|
|
|
|
|
|
Net Worth (TSEK) |
165664 |
Banking Reputation |
|
|
|
|
|
|
|
No. of Employees |
53 |
Auditors |
|
|
|
|
|
|
|
SCORE |
Ba |
||
|
41-55 |
Ba |
Overall operation is considered normal. Capable to meet normal
commitments. |
Normal |
This score serves
as a reference to assess SC’s credit risk and to set the amount of credit to be
extended. It is calculated from a composite of weighted scores obtained from
each of the major sections of this report. The assessed factors and their
relative weights (as indicated through %) are as follows:
Financial condition (40%) Ownership background (20%) Payment record (10%)
Credit history (10%) Market trend (10%) Operational
size (10%)
|
Line of Business |
Other growing of crops. |
Summary
|
Allergon AB |
Company no |
556089-9899 |
|
Välingevägen 309 |
Telephone |
+46-42-33 44 00 |
|
262 92 Ängelholm |
|
|
|
|
||
|
|
|||||||||||||||||||||||||||||||||||||||||
Group of companies
Part of Sweden Diagnostics Holding
AB-group
Note: Board is not complete.
Note: Change of auditor occurred 041124.
Most recent
events
|
New auditor |
2004-11 |
|
|
|
|
Art. of assoc. adopted |
2004-10 |
|
|
|
|
|
|
Credit opinion
Risk forecast: 0,7 %
The forecast states the probability that the
company will become insolvent within 24 months.
Industry Risk Forecast: 0,3 %
Median value for limited company in industry
01119, such as Other growing of crops.
Other information may of course affect your
assessment of the risk
Credit limit: 2.000 TSEK
Applies to short-term credit facilities. The
limit has been set using a formula that takes into consideration the annual
accounts included in this credit report and the current credit rating. Other
information may of course influence the size of the credit you may grant.
General information and history
|
Legal form |
Limited company, private |
|
|
|
|
Vat-number |
SE 556089989901 |
|
|
|
|
Registered office |
Helsingborg municipality
in Skåne county |
|
|
|
|
Number of locations |
1 |
|
Description of business
activities |
|
Other growing of crops. |
|
(Main business according to
Statistics Sweden, SNI2002: 01119) |
|
|
|
History |
|
|
|
|
|
1963-11 |
Comp reg under the current reg no
and name: AB Allergon |
|
|
|
|
1972-03 |
Changed name to: Kabi Pharmacia
Allergon AB |
|
|
|
|
1993-04 |
Company registered to pay
business tax |
|
|
|
|
--- |
Company registered to pay VAT |
|
|
|
|
--- |
Company registered to pay
employer contributions |
|
|
|
|
1994-05 |
Changed name to: Pharmacia
Allergon AB |
|
|
|
|
1996-09 |
Changed name to: Pharmacia &
Upjohn Allergon AB |
|
|
|
|
1997-10 |
Company reg under the current
name |
|
|
|
|
2000-09 |
Nils Stellan Dybner new Managing
Director |
|
|
|
|
2002-07 |
Taken over Holomed International
AB through merger |
|
|
|
|
2004-10 |
Articles of Association adopted |
|
|
|
Matters pending with Registration Office
No notes of imminent changes
Non categorized information
The company/part of the company is ISO-9001 certified
99-05-31
Customs have granted the company to bring
home goods/credit permit
Link to homepage
Note: Note that the company took over Holomed
International AB through merger in 02-07.
Board of
directors etc
Board members according to Reg Office
Board members etc reg prior to 1991-04 unless
otherwise stated.
|
Nils Stellan Dybner, Birth:1945 |
MD and Regular member |
Reg. in company 2000-09-11 |
|
|
||
|
Magnus Lundberg, Birth:1956 |
Regular member |
Reg. in company 1999-06-23 |
|
|
||
|
Lennart Persson, Birth:1946 |
Reg. memb. and empl. repr. |
Reg. in company 1999-01-19 |
|
|
||
|
Kitty Monica Olofsson, Birth:1948 |
Reg. memb. and empl. repr. |
Reg. in company 1999-01-19 |
|
|
||
|
Pricewaterhousecoopers AB |
Revisionsföretag |
Reg. in company 2004-11-24 |
|
|
||
|
Board members etc that have left
the company during the last two years |
|
Joachim Ganzer, Birth:1942 |
Regular member |
|
|
|
|
Deregistered 2004-02-27 |
|
|
|
Living abroad |
|
|
||
|
Anders Nordström, Birth:1953 |
Regular member |
Reg. in company 1994-12-12 |
|
|
|
Deregistered 2005-05-04 |
|
|
||
|
Authorized signatory (available
in Swedish only) |
|
Firman tecknas av styrelsen |
|
firman tecknas i förening av |
|
-Dybner, Nils Stellan |
|
-Lundberg, Magnus Åke |
|
Dessutom har verkställande
direktören rätt att teckna firman |
|
beträffande löpande
förvaltningsåtgärder |
|
då styrelsen, utöver
arbetstagarrepresentanter, skall bestå av |
|
3 ledamöter och 0 suppleanter är
styrelsen inte fulltalig. |
|
|
Note: Change of auditor occurred 041124.
Note: Board is not complete.
Group relationship etc
|
Ultimate parent company |
As of |
Comments |
|
Sweden Dia (Sweden) AB,
556613-7682 |
2004-04 |
Cr. rating 5 |
|
|
||
|
Parent company etc |
Proprietary
int |
As of |
Comments |
|
Sweden Diagnostics Holding AB, 556653-9796 |
100 % |
2004-04 |
Cr. rating 4 |
|
|
|||
|
Former parent companies etc |
Ownership |
Comments |
|
Pfizer Health AB, 556131- 9608 |
92 % |
Parent company until 03/04 |
|
|
||
|
Pharmacia Holding AB, 556201-1238 |
|
Ultimate parent company at that
time |
|
|
||
|
Pharmacia AB, 556131-9608 |
92 % |
Parent company until 00-12 |
|
|
||
|
Former subsidiaries etc |
Ownership |
Comments |
|
Holomed International AB, 556141-8525 |
100 % |
Deregistered 02-11 due to merger |
|
|
Former subsidiary |
|
|
|
||
|
Holomed International AB, 556141-8525 |
100 % |
Sold 00-12 |
|
|
Former subsidiary |
|
|
|
||
Annual accounts and ratios
|
Annual accounts |
|
|||||
|
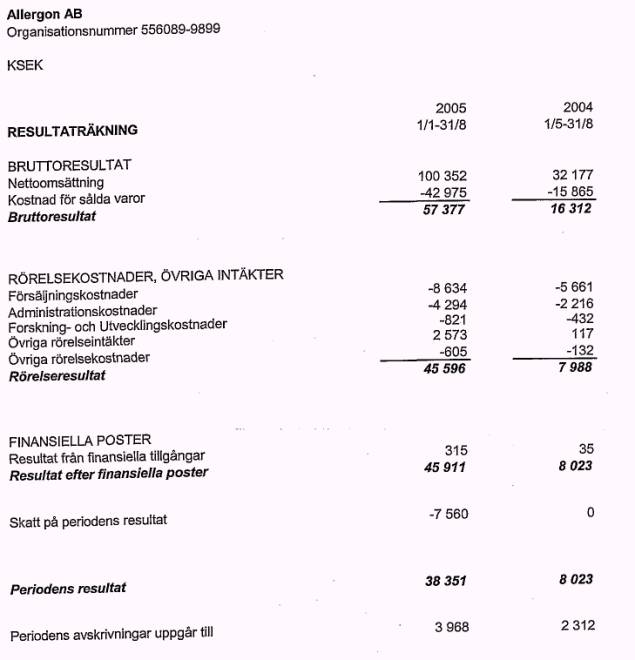
Inc. statement in TSEK |
0312-0404 |
0301-0311 |
0201-0212 |
0101-0112 |
0001-0012 |
|
|
Net sales |
+42.775 |
+150.904 |
+172.462 |
+153.899 |
+149.559 |
|
|
Profit/loss after financial items |
+12.238 |
+59.785 |
+94.893 |
+91.778 |
+90.075 |
|
|
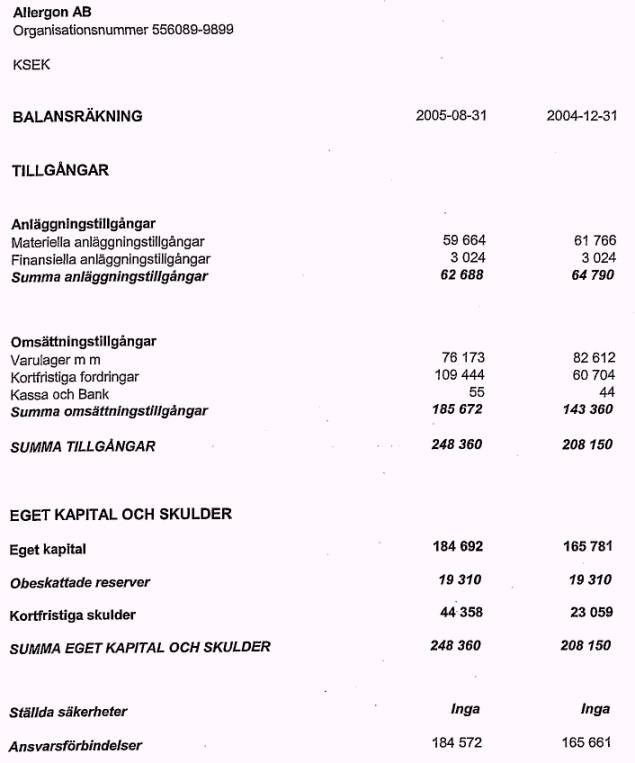
Balance sheet in TSEK |
0312-0404 |
0301-0311 |
0201-0212 |
0101-0112 |
0001-0012 |
|
Total fixed assets |
64.461 |
53.892 |
47.579 |
42.604 |
36.257 |
|
Total current assets |
130.908 |
180.347 |
144.994 |
129.113 |
117.038 |
|
Total equity |
165.664 |
20.199 |
19.683 |
19.259 |
19.133 |
|
Total long-term liabilities |
0 |
0 |
0 |
120 |
120 |
|
Total current liabilities |
12.006 |
199.841 |
159.975 |
140.236 |
121.970 |
|
Total equity and liabilities |
195.369 |
234.239 |
192.573 |
171.717 |
153.295 |
|
Notes etc |
0312-0404 |
0301-0311 |
0201-0212 |
0101-0112 |
0001-0012 |
|
Employees |
53 |
57 |
53 |
51 |
46 |
|
Audit report |
Unqualified |
Unqualified |
Unqualified |
Unqualified |
Unqualified |
|
Ratios |
||||||
|
Ratios 1) |
|
0312-0404 |
0301-0311 |
0201-0212 |
0101-0112 |
0001-0012 |
|
Equity/assets % |
28,9
1) |
91,1 |
12,9 |
14,9 |
16,1 |
18,0 |
|
Consolidation Ratio % |
34,3
1) |
93,8 |
14,7 |
16,9 |
18,3 |
20,4 |
|
Quick ratio % |
106,6
1) |
280,2 |
42,7 |
39,6 |
41,3 |
47,0 |
|
Return on total assets % |
6,1 1)
|
16,2 |
29,5 |
51,2 |
55,0 |
60,1 |
|
Cash Flow/Total liabilities % |
16,4
1) |
231,4 |
25,7 |
45,4 |
49,5 |
55,6 |
|
Risk margin % |
5,0 1)
|
3,0 |
27,6 |
48,9 |
53,2 |
58,5 |
1) Values for the industry
in 2003 = Median for companies with at least
20 employees in industry 01000 i.e. Agriculture, hunting
and related service activities
Analysis of the annual accounts (three years)
Turnover/Capital employed
Turnover falling steeply.
Warning signals
Company has changed financial period during
the period analyzed. (This has been taken into consideration in the analysis.)
Special comments relating the future
If the decline continues at the current rate,
result after financial net will be negative in the next annual report.
Yields will not be able to cover financial
costs, if the difference between yield and average interest on debt continues
to develop in the current manner.
Note: the forecast for the company's insolvency
is very low.
For the complete annual accounts and all
ratios, see enclosure
Other financial information
|
Share capital |
|
|
|
Total |
100 TSEK |
|
The most recently registered change in share
capital
|
1997-05 |
50 TSEK |
|
Bonus issue |
|
|
|||
Chattel mortgages
We have not been notified about any chattel
mortgages.
Unprivileged claims in clients' bankruptcies
We have not been notified about any
unprivileged claims in bankruptcies in the
last 2 years.
Properties
Owns 100 % of 2 property, ass. at 16.056 TSEK
|
|
|||
|
Designation |
Välinge 26:1 |
Owns |
100 % |
|
|
|||
|
Municipality |
Helsingborg |
Acquisition date |
1971-09-01 |
|
|
|||
|
Property type |
421, Industrial unit,
chemical industry |
Assessed value in 2004 |
14.914 TSEK |
|
|
|||
|
Area |
11 ha |
Jointly assessed |
No |
|
|
|||
|
Type of acquisition |
Purchase |
Purchase price |
Unknown |
|
|
|||
|
|
|||
|
Designation |
Välingetorp 4:1 |
Owns |
100 % |
|
|
|||
|
Municipality |
Helsingborg |
Acquisition date |
1999-12-02 |
|
|
|||
|
Property type |
110, Undeveloped
agricultural unit |
Assessed value in 2004 |
1.142 TSEK |
|
|
|||
|
Area |
35 ha |
Jointly assessed |
No |
|
|
|||
|
Type of acquisition |
Purchase |
Purchase price |
25 TSEK |
|
|
|||
For complete list of properties, see
enclosure
Payment complaints, etc
No complaints have been registered.
No data on balance of debt with the
Enforcement Service as at 2005-05-06
Annual accounts and ratios
|
Annual accounts |
||||||
|
Inc. statement in TSEK |
0312-0404 |
0301-0311 |
0201-0212 |
0101-0112 |
0001-0012 |
|
|
Net sales |
+42.775 |
+150.904 |
+172.462 |
+153.899 |
+149.559 |
|
|
Cost of goods sold |
-19.483 |
-40.870 |
-47.789 |
-39.519 |
-42.672 |
|
|
Gross profit/loss |
+23.292 |
+110.034 |
+124.673 |
+114.380 |
+106.887 |
|
|
|
||||||
|
Selling expenses |
-6.453 |
-19.657 |
-16.672 |
-12.341 |
-12.558 |
|
|
Administrative expenses |
-2.576 |
-6.818 |
-5.512 |
-5.454 |
-4.836 |
|
|
Research/Dev costs |
+780 |
+1.309 |
+1.999 |
+3.193 |
+3.384 |
|
|
Items affecting comparability |
0 |
-18.079 |
0 |
0 |
+4.839 |
|
|
Other operating income |
+584 |
+513 |
+577 |
+2.423 |
+2.253 |
|
|
Other operating expenses |
-1.004 |
-1.402 |
-2.735 |
-1.460 |
-1.106 |
|
|
Operating profit/loss |
+13.063 |
+63.282 |
+98.332 |
+94.355 |
+92.095 |
|
|
|
||||||
|
Interest income group companies |
+82 |
+118 |
+19 |
+31 |
+16 |
|
|
External interest income |
+44 |
+1 |
+47 |
+1 |
0 |
|
|
Other financial income |
0 |
0 |
+137 |
0 |
0 |
|
|
Total financial income |
+126 |
+119 |
+203 |
+32 |
+16 |
|
|
Interest expense to group companies |
-950 |
-3.611 |
-3.639 |
-2.608 |
-2.035 |
|
|
External interest expenses |
-1 |
-5 |
-3 |
-1 |
-1 |
|
|
Total financial expenses |
-951 |
-3.616 |
-3.642 |
-2.609 |
-2.036 |
|
|
Profit/loss after financial items |
+12.238 |
+59.785 |
+94.893 |
+91.778 |
+90.075 |
|
|
|
||||||
|
Profit/loss before appropriations |
+12.238 |
+59.785 |
+94.893 |
+91.778 |
+90.075 |
|
|
Appropriations |
-3.500 |
-1.284 |
-813 |
-30 |
+14 |
|
|
Profit/loss before tax |
+8.738 |
+58.501 |
+94.080 |
+91.748 |
+90.089 |
|
|
Tax |
-2.470 |
-16.585 |
-26.336 |
-25.742 |
-25.331 |
|
|
Net profit/loss for the year |
+6.268 |
+41.916 |
+67.744 |
+66.006 |
+64.758 |
|
|
Balance sheet in TSEK |
0312-0404 |
0301-0311 |
0201-0212 |
0101-0112 |
0001-0012 |
|
|
Total intangible assets |
0 |
0 |
0 |
0 |
0 |
|
|
Land and buildings |
26.132 |
32.726 |
23.430 |
19.658 |
20.318 |
|
|
Machinery |
16.669 |
16.477 |
0 |
8.670 |
0 |
|
|
Equipment |
1.542 |
1.285 |
1.396 |
1.631 |
0 |
|
|
Total machinery and equipment |
18.211 |
17.762 |
1.396 |
10.301 |
10.288 |
|
|
Other tangible assets |
17.094 |
380 |
19.380 |
8.438 |
1.880 |
|
|
Total tangible assets |
61.437 |
50.868 |
44.206 |
38.397 |
32.486 |
|
|
Participations in group and associated companies |
0 |
0 |
0 |
120 |
120 |
|
|
Other financial assets |
3.024 |
3.024 |
3.373 |
4.087 |
3.651 |
|
|
Total financial assets |
3.024 |
3.024 |
3.373 |
4.207 |
3.771 |
|
|
Total fixed assets |
64.461 |
53.892 |
47.579 |
42.604 |
36.257 |
|
|
|
||||||
|
Other inventories |
97.271 |
94.944 |
81.639 |
71.203 |
59.679 |
|
|
Total inventories |
97.271 |
94.944 |
81.639 |
71.203 |
59.679 |
|
|
Accounts receivable |
13.063 |
23.132 |
20.754 |
17.525 |
10.497 |
|
|
Receivables from group and associated companies |
19.885 |
57.267 |
39.271 |
38.147 |
41.132 |
|
|
Other current receivables |
628 |
3.644 |
2.363 |
2.133 |
5.116 |
|
|
Total current receivables |
33.576 |
84.043 |
62.388 |
57.805 |
56.745 |
|
|
Total cash and bank balances |
61 |
1.360 |
967 |
105 |
614 |
|
|
Total current assets |
130.908 |
180.347 |
144.994 |
129.113 |
117.038 |
|
|
|
||||||
|
Total assets |
195.369 |
234.239 |
192.573 |
171.717 |
153.295 |
|
|
Balance sheet in TSEK |
0312-0404 |
0301-0311 |
0201-0212 |
0101-0112 |
0001-0012 |
|
|
Share capital |
100 |
100 |
100 |
100 |
100 |
|
|
Other restricted equity |
20 |
20 |
20 |
20 |
20 |
|
|
Group contribution |
0 |
-41.400 |
-67.320 |
-65.880 |
-59.040 |
|
|
Shareholders’ contribution |
139.197 |
0 |
0 |
0 |
0 |
|
|
Profit/loss brought forward |
20.079 |
19.563 |
19.139 |
19.013 |
13.295 |
|
|
Net profit/loss for the year |
6.268 |
41.916 |
67.744 |
66.006 |
64.758 |
|
|
Total equity |
165.664 |
20.199 |
19.683 |
19.259 |
19.133 |
|
|
|
||||||
|
Total untaxed reserves |
17.699 |
14.199 |
12.915 |
12.102 |
12.072 |
|
|
Liabilities to group and associated companies |
0 |
0 |
0 |
120 |
120 |
|
|
Total long-term liabilities |
0 |
0 |
0 |
120 |
120 |
|
|
|
||||||
|
Accounts payable |
1.467 |
1.084 |
8.539 |
8.284 |
5.974 |
|
|
Liabilities to group and associated companies |
1.737 |
155.883 |
13.992 |
126.633 |
105.338 |
|
|
Other current liabilities |
8.802 |
42.874 |
137.444 |
5.319 |
10.658 |
|
|
Total current liabilities |
12.006 |
199.841 |
159.975 |
140.236 |
121.970 |
|
|
|
||||||
|
Total equity and liabilities |
195.369 |
234.239 |
192.573 |
171.717 |
153.295 |
|
|
Notes etc in TSEK |
0312-0404 |
0301-0311 |
0201-0212 |
0101-0112 |
0001-0012 |
|
Employees |
53 |
57 |
53 |
51 |
46 |
|
Salaries board/MD |
430 |
624 |
873 |
632 |
1.180 |
|
Salaries others |
7.468 |
15.395 |
402 |
13.801 |
12.646 |
|
Total salaries |
7.898 |
16.019 |
1.275 |
14.433 |
13.826 |
|
Bonus to board/MD |
0 |
230 |
0 |
194 |
441 |
|
Merit salaries employees |
0 |
1.469 |
0 |
893 |
983 |
|
Total salaries and remuneration |
7.898 |
17.718 |
1.275 |
15.520 |
15.250 |
|
Social security expenses |
3.980 |
11.134 |
8.821 |
7.675 |
6.541 |
|
Dividend |
0 |
0 |
0 |
0 |
0 |
|
Contractual severance pay |
No |
No |
No |
Yes |
Yes |
|
Total depreciation |
1.809 |
3.918 |
4.103 |
3.444 |
3.163 |
|
-of which depreciation selling expenses |
91 |
|
|
|
|
|
-of which depr admin costs |
167 |
|
|
|
|
|
-of which depr cost other |
1.551 |
|
|
|
|
|
Total pledged assets |
0 |
0 |
0 |
0 |
0 |
|
Other contingent liabilities |
165.544 |
0 |
0 |
0 |
0 |
|
Total contingent liabilities |
165.544 |
0 |
0 |
0 |
0 |
|
Audit report |
0312-0404 |
0301-0311 |
0201-0212 |
0101-0112 |
0001-0012 |
|
Audit report |
Unqualified |
Unqualified |
Unqualified |
Unqualified |
Unqualified |
|
Original annual account |
|||||
|
Order by additional choice |
Yes |
Yes |
Yes |
Yes |
Yes |
|
Ratios 1) |
||||||
|
Profitability |
|
0312-0404 |
0301-0311 |
0201-0212 |
0101-0112 |
0001-0012 |
|
Return on equity % |
14,2
1) |
16,5 |
216,4 |
330,4 |
331,0 |
326,6 |
|
Return on total assets % |
6,1 1)
|
16,2 |
29,5 |
51,2 |
55,0 |
60,1 |
|
Average interest rate % |
-2,3
1) |
-13,2 |
-1,9 |
-2,2 |
-1,8 |
-1,6 |
|
Risk margin % |
5,0 1)
|
3,0 |
27,6 |
48,9 |
53,2 |
58,5 |
|
Gross margin % |
7,7 1)
|
34,3 |
44,4 |
59,2 |
62,6 |
62,7 |
|
Operating margin % |
3,5 1)
|
30,1 |
41,8 |
56,8 |
60,4 |
60,7 |
|
Net margin % |
3,1 1)
|
28,2 |
39,5 |
54,8 |
58,7 |
59,3 |
|
Interest cover |
4,2 1)
|
13,9 |
17,5 |
27,1 |
36,2 |
45,2 |
|
Capital circulation |
||||||
|
Capital turnover rate |
1,8 1)
|
0,5 |
0,7 |
0,9 |
0,9 |
1,0 |
|
Cash Flow/Total liabilities % |
16,4
1) |
231,4 |
25,7 |
45,4 |
49,5 |
55,6 |
|
Cash fl/finexp % |
607,0
1) |
>999,9 |
>999,9 |
>999,9 |
>999,9 |
>999,9 |
|
Self-financing ratio % |
248,5
1) |
262,9 |
814,2 |
>999,9 |
>999,9 |
- |
|
Stock turnover/year |
14,9
1) |
1,1 |
1,7 |
2,1 |
2,2 |
2,5 |
|
Turnover/employee TSEK |
1.043,0
1) |
1.963,0 |
2.897,0 |
3.264,0 |
3.065,0 |
3.300,0 |
|
Lab costs/turnover % |
-20,2
1) |
-18,2 |
-11,7 |
-0,7 |
-9,9 |
-10,0 |
|
Working capital/turn % |
7,2 1)
|
114,3 |
-11,8 |
-8,6 |
-7,1 |
-3,2 |
|
Acc rec/turnover % |
8,0 1)
|
12,6 |
14,0 |
12,0 |
11,2 |
6,9 |
|
Stock/turnover % |
6,6 1)
|
93,5 |
57,5 |
47,2 |
45,5 |
39,3 |
|
Short liabilities/turnover % |
20,4
1) |
11,5 |
121,0 |
92,4 |
89,7 |
80,3 |
|
Customer credit time |
28,6
1) |
43,5 |
33,2 |
27,6 |
22,4 |
- |
|
Credit period granted |
21,5
1) |
3,0 |
7,3 |
12,2 |
11,4 |
- |
|
Liquidity |
||||||
|
Current ratio % |
143,9
1) |
>999,9 |
90,2 |
90,6 |
92,1 |
96,0 |
|
Quick ratio % |
106,6
1) |
280,2 |
42,7 |
39,6 |
41,3 |
47,0 |
|
Consolidation |
||||||
|
Equity/assets % |
28,9
1) |
91,1 |
12,9 |
14,9 |
16,1 |
18,0 |
|
Consolidation Ratio % |
34,3
1) |
93,8 |
14,7 |
16,9 |
18,3 |
20,4 |
|
Debt/equity ratio |
2,3 1)
|
0,1 |
6,8 |
5,7 |
5,2 |
4,6 |
|
Risk ratio |
10,6
1) |
99,9 |
- |
- |
- |
- |
|
Fixed assets structure |
||||||
|
Financial assets structure % |
3,5 1)
|
4,7 |
5,6 |
7,1 |
9,9 |
10,4 |
|
Tangible assets structure % |
96,6
1) |
95,3 |
94,4 |
92,9 |
90,1 |
89,6 |
1) Values for the industry
in 2003 = Median for companies with at least
20 employees in industry 01000 i.e. Agriculture, hunting
and related service activities
Analysis of the annual accounts (three years)
Turnover/Capital employed
Turnover falling steeply.
Financing
Turnover is falling while the stocks are by
and large unchanged there may be a risk that the company has stocks which,
apart from tying up capital, may also be difficult to sell.
Warning signals
Company has changed financial period during
the period analyzed. (This has been taken into consideration in the analysis.)
Special comments relating the future
If the decline continues at the current rate,
result after financial net will be negative in the next annual report.
Yields will not be able to cover financial
costs, if the difference between yield and average interest on debt continues
to develop in the current manner.
Note: the forecast for the company's insolvency
is very low.
Real property list
|
Designation |
Municipality |
Ownership |
Ass.
value year 2004 |
|
Välinge 26:1 |
Helsingborg |
100 % |
14.914 TSEK |
|
|
|||
|
Välingetorp 4:1 |
Helsingborg |
100 % |
1.142 TSEK |
|
|
|||
Background
These are the significant dates in Allergon’s development
into a world-leader in allergen source material production.
2004
Allergon sets new standards for mould allergen production, which now takes
place in a unique new laboratory facility.
Triton and PPM Ventures acquire Allergon as part of their investment portfolio
of companies with strong future potential.
2003
Modern new laboratory unit established for epithelia allergens.
Pfizer takes over Pharmacia.
2002
Mite allergen production and development unit expanded and improved.
2000
A new modern food allergen unit established.
1995
ISO 9001:1994 certification.
Our own production, development and sales organisation in China, Nanjing Mei
Rui Pharma Co., Ltd., established in a joint venture.
1983
Separate facility for epithelia allergen production and development created in
line with our strategy of always having separate laboratories for different
allergens. Allergens from insects and venoms also added to the portfolio and
range.
1981
Allergon Division in Missouri, USA, set up to give access to the American flora
in line with our strategy of offering a continuously expanding high-quality
range of pollen allergens.
1980
Separate mite allergen production laboratory created. Demand is high and the
unit is extended in 1982 and 1988.
1977
Separate mould allergen production facility started, to ensure quality.
1971
Pharmacia acquires Allergon, generating additional resources and accelerating
our rapid expansion.
1963
Allergon founded.
Management
Allergon’s management is built of a mix between Allergon, allergy market and
pharmaceutical industry experience.
Stellan Dybner, President, joined Allergon in
2000 having worked in the pharmaceutical industry for 30 years.
Jeremy Harvey, VP Business Operations,
joined Allergon in 2003 but has worked in the Pharmaceutical Industry for over
6 years and in customer service for over 15 years.
Magdalena Rahl, VP QA / QC / R&D, has worked in Allergon for over 25
years and provides the insight and support necessary to help customers with
product quality / registration issues.
Björn Arnsvik, VP Technical Operations,
joined Allergon in 2001 and has
worked in the Pharmaceutical Industry for over 10 years and uses
this
experience to not only improve the processes within Allergon but
also to work
with customers to improve their stock management.
Solveig Gustavsson, VP Finance and Personnel, has worked
in Allergon for over 20 years.
The diversity in the management group is also reflected in the rest of the more
than 50 employees who work for Allergon around the world.
Contacts
Departments
Contact details for the various departments at Allergon are given below.
Customer support
Contact: Anette Kittel, Key Account Manager
Phone: +46 42 33 44 45
E-mail: anette.kittel@diagnostics.com
Sales &
marketing
Contact: Jeremy Harvey, Vice President Business Operations
Phone: +46 42 33 44 60
E-mail: jeremy.m.harvey@diagnostics.com
Research
& development
Contact: Måns Österberg, Manager R&D
Phone: +46 42 33 44 52
E-mail: mans.osterberg@diagnostics.com
Quality
& registration
Contact: Magdalena Rahl, Vice President Quality Assurance
Phone: +46 42 33 44 55
E-mail: magdalena.rahl@diagnostics.com
Attachment 3
ACKNOWLEDGEMENT
Dear Sir/Madam,
As part of our control
system, please fax/email us this note
upon receipt of this report. If we do not receive the acknowledgement within 24
hours, we will assume that our report meets your requirement. If you have any
suggestion to help us improve our reports and services, please do not hesitate
to let us know.
Thank you.
______________________________________________________________________________
To : MIRA INFORM PRIVATE
LIMITED
From :
To :
Feedback – Please tick
the appropriate box.
------------------------------------------------------------
|
|
GOOD |
FAIR |
POOR |
|
|
|
|
|
|
Content |
[
] |
[
] |
[
] |
|
Layout and
Presentation |
[
] |
[
] |
[
] |
|
Speed of Delivery |
[
] |
[
] |
[
] |
|
Overall Impression |
[
] |
[
] |
[
] |
Further Comments/Suggestion :
____________________________________________________________________________________________________________________________________________________________________________________________________________________________________________________________________________________________________________________________________________________________________________________________________________________________________________________________________________________
_____________________________
Company’s Stamp &
Signature