
MIRA
INFORM REPORT
|
Report Date : |
23rd
June 2006 |
IDENTIFICATION
DETAILS
|
Name : |
INNOVACIONES TECNICAS APLICADAS A
CERAMICAS AVANZADAS S.A. |
|
|
|
|
Formerly Known As : |
Breipicture
Sociedad Anonima |
|
|
|
|
Registered Office : |
Lugar
Paraje Rambleta, S/N 12191
La Pobla Tornesa (Castellon) |
|
|
|
|
Country : |
Spain |
|
|
|
|
Financials (as on) : |
2005 (Estimate) |
|
|
|
|
Date of Incorporation : |
17/06/1999 |
|
|
|
|
Legal Form : |
Joint Stock
Company |
|
|
|
|
Line of Business : |
Manufacturers of
dyes and pigments |
RATING & COMMENTS
|
MIRA’s Rating : |
A |
|
RATING |
STATUS |
PROPOSED CREDIT LINE |
|
|
56-70 |
A |
Financial & operational base are
regarded healthy. General unfavourable factors will not cause fatal effect.
Satisfactory capability for payment of interest and principal sums |
Fairly Large |
|
Status : |
Good |
|
|
|
|
Payment Behaviour : |
Regular
|
|
|
|
|
Litigation : |
Clear |
NAME
INNOVACIONES
TECNICAS APLICADAS A CERAMICAS AVANZADAS S.A.
TAX NUMBER
A12505293
Identification and
Characteristics
|
Tax
Number |
A12505293 |
|
NAME |
INNOVACIONES
TECNICAS APLICADAS A CERAMICAS AVANZADAS S.A. |
|
ANAGRAM |
ITACA |
|
FORMER
NAME |
BREIPICTURE
SOCIEDAD ANONIMA. |
|
BUSINESS
ADDRESS |
LUGAR
PARAJE RAMBLETA, S/N |
|
Postcode |
12191 LA
POBLA TORNESA (CASTELLON) |
|
URL |
http://www.itaca-sa.es |
|
TELEPHONE |
964338166 |
|
FAX |
964657802 |
|
LEGAL
FORM |
JOINT STOCK
COMPANY |
|
DATE
FOUNDED |
17/06/1999 |
|
CAPITAL |
999.763,00 Euros |
|
PAID-UP
CAPITAL |
999.763,00 Euros |
|
NUMBER
OF EMPLOYEES |
195 |
|
BANKS |
BSCH; CAIXA
CATALUNYA OF 0700; |
|
ACTIVITY |
1253200 - Mfg.
of dyes & pigments |
|
CNAE |
2412 - Manufacture
of dyes and pigments |
|
Synthesis
|
||
|
FINANCIAL
SITUATION |
||
|
|
|
|
|
PROFITABILITY |
|
6/9 Average |
|
TREASURY |
|
9/9 Excellent |
|
BALANCE
SHEET |
|
9/9 Excellent |
|
DEBT |
|
7/9 Low |
|
INCIDENTS |
||
|
|
|
|
|
COMMITMENTS |
|
9/9 Respected |
|
INCIDENTS |
|
9/9 None
or Negligible |
|
PREVIOUS
EXPERIENCE |
||
|
|
|
|
|
PREVIOUS
EXPERIENCE |
|
9/9 Very
favourable |
Credit Appraisal
|
CREDIT ACCORDING
TO OBJECTIVE DATA (From 0 to 500.000,00 Euros): |
|
FAVOURABLE
TOWARDS 499.501,16 Max. |
|
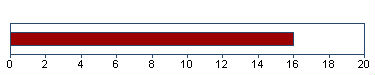
SOLVENCY RATING: |
|
16/20 (BASED
ON HOMOGENEOUS FORMULATION) |
|
|
|
|
Financial Elements
Figures given in
Euros
|
|
Balance
sheet 2.003 (12) |
Balance
sheet 2.004 (12) |
Estimate 2.005
(12) |
|
|
SALES |
47.867.590,00 |
56.277.488,00 |
57.965.812,63 |
|
|
ADDED VALUE |
19.615.104,00 |
22.226.776,00 |
|
|
|
BUSINESS RESULT |
4.472.264,00 |
5.103.786,00 |
|
|
|
OWN FUNDS |
34.252.401,00 |
36.356.187,00 |
|
|
|
DEBT |
33.460.315,00 |
39.113.241,00 |
|
|
|
TOTAL ASSET |
67.728.681,00 |
75.645.679,00 |
|
|
|
The sales of
56.277.488,00 Euros show a change of 17,57%
compared with 2.003 . |
|
|||
|
Added value grew
by 13,31% compared with the previous year. Shareholders equity
are 36.356.187,00 Euros for an indebtedness of
39.113.241,00 Euros . |
|
|||
|
The result
5.103.786,00 Euros means financial profitability of
14,04% and economic profitability of 6,75% . This
result means growth of 14,12% compared with the
2.003 . |
|
|||
|
|
|
|||
|
THE FIGURES FOR
THE LAST BALANCE SHEET ARE RELEVANT: |
|
|||
|
SOURCE: FROM
THE MERCANTILE REGISTER |
|
|||
|
DATE: 31/01/2006 |
|
|||
|
|
|
|||
|
Auditors’
opinion: |
|
|||
|
FAVOURABLE
(2.004) |
|
|||
|
|
|
|||
|
Auditors: |
|
|||
|
DELOITTE SL |
|
|||
Comparative Sector Analysis
|
|
Company |
Sector |
Difference |
|
|
(2.004) |
|
|
|
%
of PRODUCTION VALUE |
|
|
|
|
SALES |
97,19 |
97,80 |
-0,61 |
|
ADDED
VALUE |
38,39 |
19,29 |
19,10 |
|
BUSINESS
RESULT |
8,81 |
5,33 |
3,48 |
|
%
OF TOTAL ASSETS |
|
|
|
|
OWN
FUNDS |
48,06 |
53,41 |
-5,35 |
|
DEBT |
51,71 |
46,59 |
5,12 |
Compared sector
(CNAE): 241 - Fabricación de productos químicos básicos
Number of
companies: 42
Size (Sales
Figure): > 40.000.000,00 Euros
The turnover of the
company is 0,61% below the mean for the sector.
The company’s added
value was 38,39% s/ the production value, and 19,10% above the mean
for the sector.
The company’s
business result was 8,81% of the PV, 3,48% above the mean for the
sector.
The company’s own
resources are 48,06% , 5,35% below the mean for the sector.
The company’s
outside resources are 51,71% , 5,12% above the mean for the sector.
Legal Actions
|
No legal
incidences registered for this company in the official source |
|
No claims
registered for this company in the official sources |
|
AFFECTED
BY: No significant elemento |
Main Board members, Directors and
Auditor
|
Position |
Surname and name |
Date
of appointment |
|
CHAIRMAN |
HEAPPEY MARK |
09/02/2006 |
|
BOARD MEMBER |
AMIVI SA |
27/10/2004 |
|
BOARD MEMBER |
DEIAN SA |
27/10/2004 |
|
BOARD MEMBER |
NITRUR DE BOR SL |
27/10/2004 |
|
BOARD MEMBER |
CERANTE SA |
27/10/2004 |
|
BOARD MEMBER |
MONCON SA |
27/10/2004 |
|
BOARD MEMBER |
RODAS SERVICIOS
XXI SL |
29/06/2005 |
|
BOARD MEMBER |
BAGAN VARGAS
VICENTE |
09/02/2006 |
|
SECRETARY |
ALVAREZ ARJONA
EMILIO |
31/12/2003 |
|
AUDITOR |
DELOITTE TOUCHE
ESPANA SL |
09/06/2003 |
Financial Links
|
Shareholders |
||||
|
Company Name |
CIF/Country |
Percent. |
Source |
Information Date |
|
ESMALGLASS SA |
A12023719 |
93,64%
|
OWN SOURCES |
25/04/2006 |
Shareholdings
|
|||||
|
Company Name |
CIF/Country |
Percent. |
Source |
Information Date |
|
|
|
B12561247 |
25,00%
|
M.REGISTER |
31/12/2004 |
|
|
|
Company
with solvency rating below 7 |
||||
Proceedings published in the
B.O.R.M.E. (Official Mercantile Register Gazette)
|
Proceedings |
Date |
Notice
Num. |
Mercantile
Reg. |
|
Resignations |
09/02/2006 |
071432 |
CASTELLON |
|
Appointments |
09/02/2006 |
071432 |
CASTELLON |
|
Change of
statutes |
09/02/2006 |
071432 |
CASTELLON |
|
Registration of
accounts (2004) |
09/02/2006 |
057182 |
CASTELLON |
|
Appointments |
02/01/2006 |
002012 |
CASTELLON |
Press articles
|
|
||
|
02/04/2006 |
LEVANTE |
INFORMATION ON
THE ENVIRONMENT |
|
LA CONSELLERIA DE
TERRITORIO VIVIENDA HA CONCEDIDO EL MAXIMO CERTIFICADO AM BIENTAL A LA
EMPRESA ITACA SA, DEDICADA A LA FABRICACION DE COLORANTES Y PIGMENTOS
CERAMICOS EN LA POBLA TORNESA. |
||
|
|
||
|
21/09/2004 |
EXPANSIÓN |
SUBSIDIARIES
INFORMATION |
|
EL GRUPO
CASTELLONENSE ESMALGLASS, FABRICANTE DE ESMALTES, HA ADQUIRIDO EL 40% DE SU
FILIAL ITACA QUE AUN NO POSEIA AL ACTUAL EQUIPO DIRECTIVO. EL GRU PO,
PARTICIPADO POR 3I, SE HACE ASI CON EL 100% DE SU FILIAL DEDICADA A LA
FABRICACION DE COLORES PARA LA INDUSTRIA CERAMICA. |
||
Complementary Information
|
La Junta General
de fecha 30/06/99, acordo la fusion por absorcion |
|
de INNOVACIONES
TECNICAS APLICADAS A CERAMICAS AVANZADAS SA NIF: |
|
A46607487 por parte
de BREIPICTURE SA NIF:A12505293, segun anuncio |
|
publicado en
Borme Seccion 2 del 17/08/99. |
|
La sociedad
absorbente cambiara su denominacion por la de INNOVACIONES |
|
TECNICAS
APLICADAS A CERAMICAS AVANZADAS SA. |
|
16/11/05 BLOQUE
DE INVESTIGACION: |
|
- Actividad:
Fabricacion colorantes y pigmentos. |
|
- Direccion
social: En LG. Paraje Rambleta, s/n en zona industrial en |
|
la Pobla Tornesa
(Castellon), en propiedad (sin verificacion regis- |
|
tral) destinado a
local. |
|
---------------------------------------------------------------------- |
|
El bloque de
investigacion no esta sujeto a actualizaciones sistemati- |
|
cas.Los datos
mostrados fueron aportados por las fuentes consultadas |
|
en la fecha del
encabezamiento. |
Remarks for customer
Here is our final
resport. Even thoudh this company is obliged to file their balance sheets in
the Mercantile Register,no official balance sheets are available for 2005
The information on the last
account contained in this report is extracted from the Mercantile Register file
of the legal address of the Company and dated 31/01/2006
Balance Sheet (ASSETS)
|
(Figures given in
Euros) |
31/12/2002 (12)
|
31/12/2003 (12)
|
31/12/2004 (12)
|
|
|
|
A) DUE FROM
SHAREHOLDERS FOR UNCALLED CAPITAL |
|
|
|
|
|
B) FIXED ASSETS |
36.479.086,00 |
37.491.016,00 |
33.518.017,00 |
|
|
I. Establishment
expenses |
|
|
|
|
|
II. Intangible
assets |
14.736.513,00 |
12.518.739,00 |
10.372.858,00 |
|
|
Concessions,
patents,licences , trademarks |
|
|
34.615,00 |
|
|
Goodwill |
21.472.934,00 |
21.472.934,00 |
21.472.934,00 |
|
|
Software |
456.825,00 |
511.161,00 |
537.236,00 |
|
|
Prepayments |
|
|
58.071,00 |
|
|
Amortization |
-7.193.246,00 |
-9.465.356,00 |
-11.729.998,00 |
|
|
III. Tangible
assets |
20.758.502,00 |
24.123.145,00 |
22.514.951,00 |
|
|
Property, plant
and equipment |
10.060.253,00 |
10.316.670,00 |
13.399.967,00 |
|
|
Machinery, equipment
and other |
9.800.101,00 |
11.522.945,00 |
11.763.377,00 |
|
|
Other property
plant and equipement |
8.987.112,00 |
10.829.722,00 |
12.140.711,00 |
|
|
Prepaid expenses
on fixed assets |
1.480.489,00 |
4.279.576,00 |
1.326.754,00 |
|
|
Other assets |
616.705,00 |
715.802,00 |
724.570,00 |
|
|
Provisions |
|
-13.541.570,00 |
|
|
|
Depreciation |
-10.186.158,00 |
|
-16.840.428,00 |
|
|
IV. Financial
assets |
984.071,00 |
849.132,00 |
630.208,00 |
|
|
Shares in
associated companies |
440.527,00 |
1.556,00 |
1.556,00 |
|
|
Loans to
associated companies |
395.000,00 |
425.000,00 |
568.117,00 |
|
|
Other loans |
206.076,00 |
412.152,00 |
618.228,00 |
|
|
Long term
deposits and guarantees |
11.479,00 |
11.479,00 |
11.479,00 |
|
|
Provisions |
-69.011,00 |
-1.055,00 |
-569.172,00 |
|
|
V. Owners equity |
|
|
|
|
|
VI. Long term
trade liabilities |
|
|
|
|
|
C) DEFERRED
EXPENSES |
|
|
|
|
|
D) CURRENT ASSETS |
24.928.567,00 |
30.237.665,00 |
42.127.662,00 |
|
|
I. Not paid in
shareholder capital |
|
|
|
|
|
II. Inventory |
9.018.968,00 |
13.748.082,00 |
15.796.665,00 |
|
|
Raw material
inventory |
3.023.488,00 |
4.394.992,00 |
5.415.531,00 |
|
|
Work in Progress |
3.494.136,00 |
4.757.063,00 |
5.204.449,00 |
|
|
Finished goods |
2.397.064,00 |
4.467.180,00 |
5.022.689,00 |
|
|
Cash advance |
104.280,00 |
128.847,00 |
153.996,00 |
|
|
III. Debtors |
15.860.012,00 |
16.089.143,00 |
22.840.511,00 |
|
|
Clients |
12.868.513,00 |
12.704.843,00 |
17.351.587,00 |
|
|
Amounts owned by
affiliated companies |
2.193.240,00 |
2.656.645,00 |
5.399.274,00 |
|
|
Amounts owned by
associated companies |
|
143.117,00 |
|
|
|
Other debts |
12.286,00 |
69.900,00 |
3.801,00 |
|
|
Taxes refunds |
922.588,00 |
707.171,00 |
405.707,00 |
|
|
Provisions |
-136.615,00 |
-192.533,00 |
-319.858,00 |
|
|
IV. Short term
financial assets |
491,00 |
154.197,00 |
3.009.548,00 |
|
|
Short term
investment |
|
149.216,00 |
3.004.567,00 |
|
|
Short Term
Deposit and guarantees |
491,00 |
4.981,00 |
4.981,00 |
|
|
V. Short term
owners equity |
|
|
|
|
|
VI. Cash |
22.289,00 |
212.001,00 |
363.301,00 |
|
|
VII. Prepaid
expenses and accrued income |
26.807,00 |
34.242,00 |
117.637,00 |
|
|
ASSETS (A + B + C
+ D) |
61.407.653,00 |
67.728.681,00 |
75.645.679,00 |
Balance Sheet (LIABILITIES)
|
(Figures given in
Euros) |
31/12/2002 (12)
|
31/12/2003 (12)
|
31/12/2004 (12)
|
|
|
|
A) SHAREHOLDERS
EQUITY |
33.941.524,00 |
34.252.401,00 |
36.356.187,00 |
|
|
I. Capital |
999.763,00 |
999.763,00 |
999.763,00 |
|
|
II. Premium share
account |
22.655.718,00 |
20.278.933,00 |
20.278.933,00 |
|
|
III. Revaluation
reserve |
|
|
|
|
|
IV. Reserves |
6.484.652,00 |
8.501.441,00 |
12.973.705,00 |
|
|
Retained earnings |
199.953,00 |
199.953,00 |
199.953,00 |
|
|
Other funds |
6.284.679,00 |
8.301.488,00 |
12.773.752,00 |
|
|
Capital
adjustments in Euros |
20,00 |
|
|
|
|
V. Prior year
earnings |
|
|
|
|
|
VI. Prior year
profit or losses |
3.801.391,00 |
4.472.264,00 |
5.103.786,00 |
|
|
VII. Dividend
paid during the year |
|
|
-3.000.000,00 |
|
|
VIII. Own shares
for change in capital |
|
|
|
|
|
B) DEFERRED
INCOME |
31.931,00 |
15.965,00 |
|
|
|
Capital grants |
31.931,00 |
15.965,00 |
|
|
|
C) PROVISIONS FOR
LIABILITIES AND EXPENSES |
|
|
176.251,00 |
|
|
Other provisions |
|
|
176.251,00 |
|
|
D) LONG TERM
LIABILITIES |
7.204.920,00 |
10.069.583,00 |
7.703.663,00 |
|
|
I. Bonds |
|
|
|
|
|
II. Bank loans |
5.588.584,00 |
7.538.873,00 |
5.877.336,00 |
|
|
Long term bank
loans |
5.588.584,00 |
7.538.873,00 |
5.877.336,00 |
|
|
III. Debts with
associed and affiliated companies |
1.437.153,00 |
|
|
|
|
Debt with
affiliated companies |
1.437.153,00 |
|
|
|
|
IV. Other
creditors |
179.183,00 |
2.530.710,00 |
1.826.327,00 |
|
|
Other debts |
|
2.376.785,00 |
1.826.327,00 |
|
|
Taxes receivable |
179.183,00 |
153.925,00 |
|
|
|
V. Deferred debts
on shares |
|
|
|
|
|
VI. Long term
debt with creditor |
|
|
|
|
|
E) SHORT TERM
LIABILITIES |
20.229.278,00 |
23.390.732,00 |
31.409.578,00 |
|
|
I. Negotiable
bonds |
|
|
|
|
|
II. Bank loans |
6.277.238,00 |
9.084.681,00 |
18.850.031,00 |
|
|
Loans and other
debts |
6.264.454,00 |
9.084.681,00 |
18.826.584,00 |
|
|
Debt interest |
12.784,00 |
|
23.447,00 |
|
|
III. Short term
debts with associated and affiliated companies |
661.006,00 |
459.359,00 |
370.677,00 |
|
|
With affiliated
companies |
661.006,00 |
459.359,00 |
370.677,00 |
|
|
IV. Trade
creditors |
10.314.007,00 |
10.621.005,00 |
10.611.922,00 |
|
|
Expenses |
10.314.007,00 |
10.351.082,00 |
10.611.922,00 |
|
|
Bills payable |
|
269.923,00 |
|
|
|
V. Other non
trade payables |
2.977.027,00 |
3.225.687,00 |
1.576.948,00 |
|
|
Government |
226.687,00 |
511.892,00 |
1.031.239,00 |
|
|
Bills payable |
|
269.923,00 |
|
|
|
Other debts |
2.211.044,00 |
2.073.694,00 |
358.423,00 |
|
|
Accounts
receivable |
539.296,00 |
370.178,00 |
187.286,00 |
|
|
VI. Provisions
for current assets |
|
|
|
|
|
VII. Accruals and
deferred incomes |
|
|
|
|
|
F) SHORT TERM
PROVISIONS FOR LIABILITIES AND EXPENSES |
|
|
|
|
|
LIABILITIES (A +
B + C + D + E + F) |
61.407.653,00 |
67.728.681,00 |
75.645.679,00 |
Profit and Loss Account
|
(Figures given in
Euros) |
31/12/2002 (12)
|
31/12/2003 (12)
|
31/12/2004 (12)
|
|
|
|
A) EXPENSES (A.1
a A.16) |
|
|
|
|
|
A.1. Change in
stocks of finished goods and work in progress |
|
|
|
|
|
A.2. Supplies |
20.783.175,00 |
24.263.484,00 |
28.921.531,00 |
|
|
Material consumed |
22.425,00 |
23.227,00 |
31.025,00 |
|
|
Raw materials
consumed |
20.645.840,00 |
24.097.885,00 |
28.720.731,00 |
|
|
Other expenses |
114.910,00 |
142.372,00 |
169.775,00 |
|
|
A.3. Labor cost |
5.828.695,00 |
6.439.956,00 |
6.679.341,00 |
|
|
Wages |
4.535.477,00 |
4.988.333,00 |
5.152.658,00 |
|
|
Social security
expenses |
1.293.218,00 |
1.451.623,00 |
1.526.683,00 |
|
|
A.4. Assets
depreciation |
4.931.949,00 |
5.639.751,00 |
6.643.373,00 |
|
|
A.5 Variance in
provision for current assets |
|
55.918,00 |
127.325,00 |
|
|
Variance in
provision for bad debts |
|
55.918,00 |
|
|
|
Variance in
provision for other current assets |
|
|
127.325,00 |
|
|
A.6. Other
operating costs |
8.152.818,00 |
7.925.842,00 |
7.757.519,00 |
|
|
External costs |
8.118.507,00 |
7.885.376,00 |
7.692.130,00 |
|
|
Taxes |
34.311,00 |
40.466,00 |
65.389,00 |
|
|
A.I. OPERATING
RESULT (B.1+B.2+B.3+B.4-A.1-A.2-A.3-A.4-A.5-A.6) |
6.158.944,00 |
7.479.479,00 |
8.776.737,00 |
|
|
A.7. Financial
expenses |
529.743,00 |
501.958,00 |
540.907,00 |
|
|
Debts with
related companies |
84.433,00 |
|
|
|
|
Other companies
debts |
445.310,00 |
501.958,00 |
540.907,00 |
|
|
A.8. Variation in
financial investments provision |
|
|
568.117,00 |
|
|
A.9. Exchange
losses |
140.243,00 |
54.582,00 |
125.677,00 |
|
|
A.II. POSITIVE
FINANCIAL RESULTS (B.5+B.6+B.7+B.8-A.7-A.8-A.9) |
|
|
|
|
|
A.III. PROFIT
FROM ORDINARY ACTIVITIES (A.I+A.II-B.I-B.II) |
5.610.992,00 |
6.993.707,00 |
7.591.169,00 |
|
|
A.10. Variation
in provision in fixed assets |
40.467,00 |
|
|
|
|
A.11. Losses in
fixed assets |
2.932,00 |
371.015,00 |
2.627,00 |
|
|
A.12. Losses from
shares and bonds |
|
963,00 |
|
|
|
A.13.
Extraordinary charges |
3.405,00 |
|
10.142,00 |
|
|
A.14. Prior
year’s expenses and losses |
|
|
13.452,00 |
|
|
A.IV. POSITIVE
EXTRAORDINARY RESULT (B.9+B.10+B.11+B.12+B.13-A.10-A.11-A.12-A.13-A.14) |
29.594,00 |
|
10.051,00 |
|
|
A.V. EARNINGS /
LOSS BEFORE TAXES (A.III+A.IV-B.III-B.IV) |
5.640.586,00 |
6.638.881,00 |
7.601.220,00 |
|
|
A.15. Corporate
Taxes |
1.839.195,00 |
2.166.617,00 |
2.497.434,00 |
|
|
A.16. Other taxes |
|
|
|
|
|
A.VI. YEAR END
RESULT (PROFIT) (A.V-A.15-A.16) |
3.801.391,00 |
4.472.264,00 |
5.103.786,00 |
|
|
B) INCOMES (B.1 a
B13) |
|
|
|
|
|
B.1. Turnover |
44.121.873,00 |
47.867.590,00 |
56.277.488,00 |
|
|
Sales |
44.510.766,00 |
48.255.540,00 |
56.277.488,00 |
|
|
Discounts |
-388.893,00 |
-387.950,00 |
|
|
|
B.2. Increase in
inventory of finished goods |
933.240,00 |
3.333.043,00 |
1.002.895,00 |
|
|
B.3. Expenses
capitalized |
447.104,00 |
354.036,00 |
1.436.301,00 |
|
|
B.4. Other
operating income |
353.364,00 |
249.761,00 |
189.142,00 |
|
|
Other incomes |
330.416,00 |
229.052,00 |
189.142,00 |
|
|
Grants |
22.948,00 |
20.709,00 |
|
|
|
B.I. OPERATING
LOSSES (A.1+A.2+A.3+A.4+A.5+A.6-B.1-B.2-B.3-B.4) |
|
|
|
|
|
B.5. Incomes from
share |
|
|
|
|
|
B.6. Income from
securities |
|
|
|
|
|
B.7. Other income
from interrest |
5.583,00 |
8.257,00 |
14.939,00 |
|
|
From other
companies |
5.583,00 |
8.257,00 |
14.939,00 |
|
|
B.8. Gains on
exchange |
116.451,00 |
62.511,00 |
34.194,00 |
|
|
B.II. FINANCIAL
LOSSES (A.7+A.8+A.9-B.5-B.6-B.7-B.8) |
547.952,00 |
485.772,00 |
1.185.568,00 |
|
|
B.III. LOSSES
FROM ORDINARY ACTIVITIES (B.I+B.II-A.I-A.II) |
|
|
|
|
|
B.9. Gains from
disposal of fixed assets |
|
1.186,00 |
11.504,00 |
|
|
B.10. Gains from
dealing in own shares |
|
|
|
|
|
B.11. Paid in
surplus |
30.619,00 |
15.966,00 |
15.965,00 |
|
|
B.12.
Extraordinary income |
34.069,00 |
|
5.250,00 |
|
|
B.13. Prior
year’s income and profits |
11.710,00 |
|
3.553,00 |
|
|
B.IV.
EXTRAORDINARY LOSSES (A.10+A.11+A.12+A.13+A.14-B.9-B.10-B.11-B.12-B.13) |
|
354.826,00 |
|
|
|
B.V. LOSS BEFORE
TAXES (B.III+B.IV-A.III-A.IV) |
|
|
|
|
|
B.VI. NET LOSS
(B.V+A.15+A.16) |
|
|
|
Main Ratios
|
(Figures given in
Euros) |
2.002 (12)
|
2.003 (12)
|
2.004 (12)
|
|
|
|
ACTIVITY |
|
|
|
|
|
Increase of the
Sales Figures |
14,71 |
8,49 |
17,57 |
|
|
Assets Turnover |
0,72 |
0,71 |
0,74 |
|
|
Productivity |
2,90 |
3,05 |
3,33 |
|
|
Increase of the
Added Value |
18,16 |
15,93 |
13,32 |
|
|
PROFITABILITY |
|
|
|
|
|
Economic
Profitability |
6,19 |
6,60 |
6,75 |
|
|
Financial
Profitability |
11,20 |
13,06 |
14,04 |
|
|
Financial
Expenses |
1,20 |
1,05 |
0,96 |
|
|
BALANCE (IN DAYS
OF SALES) |
|
|
|
|
|
Customers’ Credit
(In days of sales) |
129,00 |
121,00 |
146,00 |
|
|
Suppliers’ Credit
(In days of sales) |
187,00 |
183,00 |
137,00 |
|
|
Working Capital
(In days of sales) |
38,00 |
51,00 |
69,00 |
|
|
Working Capital
Requirement (In days of sales) |
89,00 |
117,00 |
168,00 |
|
|
Treasury (In days
of sales) |
0,00 |
0,00 |
0,00 |
|
|
BALANCE |
|
|
|
|
|
Working Capital |
4.699.289,00 |
6.846.933,00 |
10.718.084,00 |
|
|
Working Capital
Requirement |
10.953.747,00 |
15.565.416,00 |
26.195.266,00 |
|
|
Treasury |
-6.254.458,00 |
-8.718.483,00 |
-15.477.182,00 |
|
|
Balance Ratio |
1,13 |
1,18 |
1,32 |
|
|
SOLVENCY |
|
|
|
|
|
Borrowing Ratio |
44,68 |
49,40 |
51,71 |
|
|
Own / Permanent
Funds |
82,43 |
77,25 |
82,19 |
|
|
Payback Capacity |
0,56 |
0,63 |
0,62 |
|
|
LIQUIDITY |
|
|
|
|
|
General Liquidity |
1,23 |
1,29 |
1,34 |
|
|
Immediate
Liquidity |
0,00 |
0,02 |
0,11 |
Sectorial Analysis
Summary of Assets, Liability
& Equity
|
(Figures given in
Percentages) |
Company |
Sector |
Company |
|
|
2.004 |
|
|
|
Assets |
|||
|
DUE
FROM SHAREHOLDERS FOR UNCALLED CAPITAL |
0,00 |
0,00 |
0,00 |
|
FIXED
ASSETS |
44,31 |
53,21 |
-8,90 |
|
ACCRUED
EXPENSES |
0,00 |
0,19 |
-0,19 |
|
CURRENT
ASSETS |
55,69 |
46,60 |
9,09 |
|
TOTAL
ASSETS |
100,00 |
100,00 |
0,00 |
|
Liabilities |
|||
|
SHAREHOLDERS
EQUITY |
48,06 |
53,41 |
-5,35 |
|
ACCRUED
INCOME |
0,00 |
2,01 |
-2,01 |
|
RISK
AND EXPENDITURE COVER |
0,23 |
1,65 |
-1,42 |
|
LONG-TERM
CREDITORS |
10,18 |
11,51 |
-1,33 |
|
SHORT-TERM
CREDITORS |
41,52 |
31,36 |
10,16 |
|
SHORT-TERM
RISK AND EXPENDITURE COVER |
0,00 |
0,06 |
-0,06 |
|
TOTAL
LIABILITIES |
100,00 |
100,00 |
0,00 |
Analytical Account of Results
|
(Figures given in
Percentages) |
Company |
Sector |
Company |
|
|
2.004 |
|
|
|
Net
turnover |
97,19 |
97,80 |
-0,61 |
|
Other
operating income |
2,81 |
2,20 |
0,61 |
|
Production
Value |
100,00 |
100,00 |
0,00 |
|
Operating
expenses |
48,22 |
62,55 |
-14,34 |
|
Other
operation expenses |
13,40 |
18,15 |
-4,76 |
|
Added
value |
38,39 |
19,29 |
19,09 |
|
Labor
cost |
11,54 |
9,76 |
1,78 |
|
Gross
Economic Result |
26,85 |
9,53 |
17,32 |
|
Assets
depreciation |
11,47 |
4,81 |
6,66 |
|
Variation
in provision for current assets |
0,22 |
-0,00 |
0,22 |
|
Net
Economic Result |
15,16 |
4,73 |
10,43 |
|
Financial
income |
0,08 |
2,24 |
-2,15 |
|
Financial
expenses |
2,13 |
1,40 |
0,73 |
|
Variation
in financial investment provision |
0,98 |
-0,00 |
0,98 |
|
Ordinary
Activities Result |
13,11 |
5,57 |
7,54 |
|
Extraordinary
income |
0,06 |
2,02 |
-1,96 |
|
Extraordinary
expenses |
0,05 |
0,70 |
-0,66 |
|
Variation
in provision in fixed assets |
0,00 |
0,41 |
-0,41 |
|
Results
before Taxes |
13,13 |
6,48 |
6,65 |
|
Corporaye
taxes |
4,31 |
1,15 |
3,17 |
|
Net
Result |
8,81 |
5,33 |
3,48 |
|
Assets
depreciation |
11,47 |
4,81 |
6,66 |
|
Provisions
fund variation |
1,20 |
0,40 |
0,80 |
|
Net
Self-Financing |
21,49 |
10,55 |
10,94 |
Ratios
|
(Figures given in
) |
Company |
Ptile25
|
Medium
|
Ptile75
|
|
|
2.004 |
|
|
|
|
ACTIVITY |
|
|
|
|
|
Increase
of the Sales Figures |
17,57 |
-1,14 |
4,63 |
11,39 |
|
Assets
Turnover |
0,74 |
0,79 |
1,22 |
1,57 |
|
Fixed
Assets Turnover |
1,68 |
1,44 |
2,94 |
4,81 |
|
Increase
of the Added Value |
13,32 |
-21,38 |
-3,92 |
9,40 |
|
PRODUCTIVITY |
|
|
|
|
|
Productivity |
3,33 |
1,29 |
1,66 |
2,37 |
|
Change
of Personnel Costs |
3,72 |
1,71 |
6,28 |
9,95 |
|
Average
Personnel Costs |
34.970,37 |
41.569,79 |
52.562,37 |
60.216,64 |
|
Value
Added by Employees |
116.370,56 |
55.231,28 |
82.623,88 |
122.283,29 |
|
CASH FLOW |
|
|
|
|
|
Cash
Flow |
12.442.601,00 |
3.559.045,21 |
6.043.230,50 |
19.281.767,17 |
|
Operating
Cash Flow |
15.547.435,00 |
3.212.042,00 |
5.208.500,00 |
16.106.000,00 |
|
Change
in Cash Flow |
22,37 |
-36,65 |
-5,44 |
7,75 |
|
PROFITABILITY |
|
|
|
|
|
Economic
Profitability |
6,75 |
0,69 |
3,82 |
7,08 |
|
Financial
Profitability |
14,04 |
1,16 |
7,39 |
14,46 |
|
Financial
Expenses |
0,96 |
0,35 |
0,68 |
1,00 |
|
Gross
Economic Profitability |
20,55 |
4,28 |
8,66 |
14,17 |
|
Gross
Financial Profitability |
42,76 |
9,23 |
18,45 |
34,49 |
|
BALANCE (IN DAYS
OF SALES) |
|
|
|
|
|
Customers’
Credit (In days of sales) |
146,00 |
77,47 |
99,12 |
119,49 |
|
Suppliers’
Credit (In days of sales) |
136,00 |
34,43 |
78,60 |
115,48 |
|
Working
Capital (In days of sales) |
68,00 |
9,92 |
33,32 |
73,55 |
|
Working
Capital Requirement (In days of sales) |
167,00 |
10,48 |
25,11 |
60,77 |
|
Treasury
(In days of sales) |
0,00 |
-22,83 |
3,77 |
40,54 |
|
Operating
Current Assets |
269,00 |
128,23 |
163,68 |
193,80 |
|
BALANCE |
|
|
|
|
|
Working
Capital |
10.718.084,00 |
1.889.511,08 |
9.055.539,50 |
24.137.697,00 |
|
Working
Capital Requirement |
26.195.266,00 |
1.514.067,83 |
5.215.903,06 |
21.138.250,00 |
|
Treasury |
-15.477.182,00 |
-6.216.611,50 |
855.990,12 |
7.110.909,13 |
|
Balance
Ratio |
1,32 |
1,04 |
1,38 |
1,66 |
|
SOLVENCY |
|
|
|
|
|
Borrowing
Ratio |
51,71 |
38,24 |
51,58 |
67,03 |
|
Own
/ Permanent Funds |
82,19 |
69,25 |
92,87 |
98,02 |
|
Payback
Capacity |
0,62 |
0,28 |
0,40 |
0,51 |
|
Long
term Indebtedness |
10,18 |
0,01 |
3,79 |
17,89 |
|
Gearing |
208,07 |
161,92 |
206,55 |
303,27 |
|
Financing
Basic Ratio |
1,00 |
1,00 |
1,00 |
1,02 |
|
Assets
Guarantee |
1,93 |
1,49 |
1,88 |
2,56 |
|
LIQUIDITY |
|
|
|
|
|
General
Liquidity |
1,34 |
1,07 |
1,22 |
1,84 |
|
Immediate
Liquidity |
0,11 |
0,02 |
0,13 |
0,48 |
The date when this report was
last updated is 16/06/2006.
This company was last
displayed on 21/06/2006, it has been viewed 19 times in
the last quarter and 404 times in total .
Information without guarantee or
responsibility
In this report data from
individuals is just related to their business activities and should be used
just in that frame
Name
INNOVACIONES
TECNICAS APLICADAS A CERAMICAS AVANZADAS S.A.
TAX NUMBER
A12505293
Identification and
Characteristics
|
Tax
Number |
A12505293 |
|
NAME |
INNOVACIONES
TECNICAS APLICADAS A CERAMICAS AVANZADAS S.A. |
|
ANAGRAM |
ITACA |
|
FORMER
NAME |
BREIPICTURE
SOCIEDAD ANONIMA. |
|
BUSINESS
ADDRESS |
LUGAR
PARAJE RAMBLETA, S/N |
|
Postcode |
12191 LA
POBLA TORNESA (CASTELLON) |
|
URL |
|
|
TELEPHONE |
964338166 |
|
FAX |
964657802 |
|
LEGAL
FORM |
JOINT STOCK
COMPANY |
|
DATE
FOUNDED |
17/06/1999 |
|
CAPITAL |
999.763,00 Euros |
|
PAID-UP
CAPITAL |
999.763,00 Euros |
|
NUMBER
OF EMPLOYEES |
195 |
|
BANKS |
BSCH; CAIXA
CATALUNYA OF 0700; |
|
ACTIVITY |
1253200 - Mfg.
of dyes & pigments |
|
CNAE |
2412 - Manufacture
of dyes and pigments |
Synthesis
|
||
|
FINANCIAL
SITUATION |
||
|
|
|
|
|
PROFITABILITY |
|
6/9 Average |
|
TREASURY |
|
9/9 Excellent |
|
BALANCE
SHEET |
|
9/9 Excellent |
|
DEBT |
|
7/9 Low |
|
INCIDENTS |
||
|
|
|
|
|
COMMITMENTS |
|
9/9 Respected |
|
INCIDENTS |
|
9/9 None
or Negligible |
|
PREVIOUS
EXPERIENCE |
||
|
|
|
|
|
PREVIOUS
EXPERIENCE |
|
9/9 Very
favourable |
Credit Appraisal
|
CREDIT ACCORDING
TO OBJECTIVE DATA (From 0 to 500.000,00 Euros): |
|
FAVOURABLE
TOWARDS 499.441,06 Max. |
|
SOLVENCY RATING: |
|
16/20 (BASED
ON HOMOGENEOUS FORMULATION) |
|
|
|
|
Financial Elements
Figures given in
Euros
|
|
Balance
sheet 2.003 (12) |
Balance
sheet 2.004 (12) |
Estimate 2.005
(12) |
|
|
SALES |
47.867.590,00 |
56.277.488,00 |
57.965.812,63 |
|
|
ADDED VALUE |
19.615.104,00 |
22.226.776,00 |
|
|
|
BUSINESS RESULT |
4.472.264,00 |
5.103.786,00 |
|
|
|
OWN FUNDS |
34.252.401,00 |
36.356.187,00 |
|
|
|
DEBT |
33.460.315,00 |
39.113.241,00 |
|
|
|
TOTAL ASSET |
67.728.681,00 |
75.645.679,00 |
|
|
|
The sales of
56.277.488,00 Euros show a change of 17,57%
compared with 2.003 . |
||||
|
Added value grew
by 13,31% compared with the previous year. Shareholders equity
are 36.356.187,00 Euros for an indebtedness of
39.113.241,00 Euros . |
||||
|
The result
5.103.786,00 Euros means financial profitability of
14,04% and economic profitability of 6,75% . This
result means growth of 14,12% compared with the
2.003 . |
||||
|
|
||||
|
THE FIGURES FOR
THE LAST BALANCE SHEET ARE RELEVANT: |
||||
|
SOURCE: FROM
THE MERCANTILE REGISTER |
||||
|
DATE: 31/01/2006 |
||||
|
|
||||
|
Auditors’
opinion: |
||||
|
FAVOURABLE
(2.004) |
||||
|
|
||||
|
Auditors: |
||||
|
DELOITTE SL |
||||
Comparative Sector Analysis
|
|
Company |
Sector |
Difference |
|
|
(2.004) |
|
|
|
%
of PRODUCTION VALUE |
|
|
|
|
SALES |
97,19 |
97,80 |
-0,61 |
|
ADDED
VALUE |
38,39 |
19,29 |
19,10 |
|
BUSINESS
RESULT |
8,81 |
5,33 |
3,48 |
|
%
OF TOTAL ASSETS |
|
|
|
|
OWN
FUNDS |
48,06 |
53,41 |
-5,35 |
|
DEBT |
51,71 |
46,59 |
5,12 |
Compared sector
(CNAE): 241 - Fabricación de productos químicos básicos
Number of
companies: 42
Size (Sales
Figure): > 40.000.000,00 Euros
The turnover of the
company is 0,61% below the mean for the sector.
The company’s added
value was 38,39% s/ the production value, and 19,10% above the mean
for the sector.
The company’s
business result was 8,81% of the PV, 3,48% above the mean for the
sector.
The company’s own
resources are 48,06% , 5,35% below the mean for the sector.
The company’s outside
resources are 51,71% , 5,12% above the mean for the sector.
Legal Actions
|
No legal
incidences registered for this company in the official source |
|
No claims
registered for this company in the official sources |
|
AFFECTED
BY: No significant elemento |
Main Board members, Directors and
Auditor
|
Position |
Surname and name |
Date
of appointment |
|
CHAIRMAN |
HEAPPEY MARK |
09/02/2006 |
|
BOARD MEMBER |
AMIVI SA |
27/10/2004 |
|
BOARD MEMBER |
DEIAN SA |
27/10/2004 |
|
BOARD MEMBER |
NITRUR DE BOR SL |
27/10/2004 |
|
BOARD MEMBER |
CERANTE SA |
27/10/2004 |
|
BOARD MEMBER |
MONCON SA |
27/10/2004 |
|
BOARD MEMBER |
RODAS SERVICIOS
XXI SL |
29/06/2005 |
|
BOARD MEMBER |
BAGAN VARGAS
VICENTE |
09/02/2006 |
|
SECRETARY |
ALVAREZ ARJONA
EMILIO |
31/12/2003 |
|
AUDITOR |
DELOITTE TOUCHE
ESPANA SL |
09/06/2003 |
Financial Links
|
Shareholders |
||||
|
Company Name |
CIF/Country |
Percent. |
Source |
Information Date |
|
ESMALGLASS SA |
A12023719 |
93,64%
|
OWN SOURCES |
25/04/2006 |
Shareholdings
|
|||||
|
Company Name |
CIF/Country |
Percent. |
Source |
Information Date |
|
|
|
B12561247 |
25,00%
|
M.REGISTER |
31/12/2004 |
|
|
|
Company
with solvency rating below 7 |
||||
Proceedings published in the
B.O.R.M.E. (Official Mercantile Register Gazette)
|
Proceedings |
Date |
Notice
Num. |
Mercantile
Reg. |
|
Resignations |
09/02/2006 |
071432 |
CASTELLON |
|
Appointments |
09/02/2006 |
071432 |
CASTELLON |
|
Change of
statutes |
09/02/2006 |
071432 |
CASTELLON |
|
Registration of
accounts (2004) |
09/02/2006 |
057182 |
CASTELLON |
|
Appointments |
02/01/2006 |
002012 |
CASTELLON |
Press articles
|
|
||
|
02/04/2006 |
LEVANTE |
INFORMATION ON
THE ENVIRONMENT |
|
LA CONSELLERIA DE
TERRITORIO VIVIENDA HA CONCEDIDO EL MAXIMO CERTIFICADO AM BIENTAL A LA
EMPRESA ITACA SA, DEDICADA A LA FABRICACION DE COLORANTES Y PIGMENTOS
CERAMICOS EN LA POBLA TORNESA. |
||
|
|
||
|
21/09/2004 |
EXPANSIÓN |
SUBSIDIARIES
INFORMATION |
|
EL GRUPO
CASTELLONENSE ESMALGLASS, FABRICANTE DE ESMALTES, HA ADQUIRIDO EL 40% DE SU
FILIAL ITACA QUE AUN NO POSEIA AL ACTUAL EQUIPO DIRECTIVO. EL GRU PO,
PARTICIPADO POR 3I, SE HACE ASI CON EL 100% DE SU FILIAL DEDICADA A LA
FABRICACION DE COLORES PARA LA INDUSTRIA CERAMICA. |
||
Complementary Information
|
La Junta General
de fecha 30/06/99, acordo la fusion por absorcion |
|
de INNOVACIONES
TECNICAS APLICADAS A CERAMICAS AVANZADAS SA NIF: |
|
A46607487 por
parte de BREIPICTURE SA NIF:A12505293, segun anuncio |
|
publicado en
Borme Seccion 2 del 17/08/99. |
|
La sociedad
absorbente cambiara su denominacion por la de INNOVACIONES |
|
TECNICAS
APLICADAS A CERAMICAS AVANZADAS SA. |
|
16/11/05 BLOQUE
DE INVESTIGACION: |
|
- Actividad:
Fabricacion colorantes y pigmentos. |
|
- Direccion
social: En LG. Paraje Rambleta, s/n en zona industrial en |
|
la Pobla Tornesa
(Castellon), en propiedad (sin verificacion regis- |
|
tral) destinado a
local. |
|
---------------------------------------------------------------------- |
|
El bloque de
investigacion no esta sujeto a actualizaciones sistemati- |
|
cas.Los datos
mostrados fueron aportados por las fuentes consultadas |
|
en la fecha del
encabezamiento. |
The information on the last account
contained in this report is extracted from the Mercantile Register file of the
legal address of the Company and dated 31/01/2006
Balance Sheet (ASSETS)
|
(Figures given in Euros) |
31/12/2002 (12)
|
31/12/2003 (12)
|
31/12/2004 (12)
|
|
|
|
A) DUE
FROM SHAREHOLDERS FOR UNCALLED CAPITAL |
|
|
|
|
|
B)
FIXED ASSETS |
36.479.086,00 |
37.491.016,00 |
33.518.017,00 |
|
|
I.
Establishment expenses |
|
|
|
|
|
II.
Intangible assets |
14.736.513,00 |
12.518.739,00 |
10.372.858,00 |
|
|
Concessions,
patents,licences , trademarks |
|
|
34.615,00 |
|
|
Goodwill |
21.472.934,00 |
21.472.934,00 |
21.472.934,00 |
|
|
Software |
456.825,00 |
511.161,00 |
537.236,00 |
|
|
Prepayments |
|
|
58.071,00 |
|
|
Amortization |
-7.193.246,00 |
-9.465.356,00 |
-11.729.998,00 |
|
|
III.
Tangible assets |
20.758.502,00 |
24.123.145,00 |
22.514.951,00 |
|
|
Property,
plant and equipment |
10.060.253,00 |
10.316.670,00 |
13.399.967,00 |
|
|
Machinery,
equipment and other |
9.800.101,00 |
11.522.945,00 |
11.763.377,00 |
|
|
Other
property plant and equipement |
8.987.112,00 |
10.829.722,00 |
12.140.711,00 |
|
|
Prepaid
expenses on fixed assets |
1.480.489,00 |
4.279.576,00 |
1.326.754,00 |
|
|
Other
assets |
616.705,00 |
715.802,00 |
724.570,00 |
|
|
Provisions |
|
-13.541.570,00 |
|
|
|
Depreciation |
-10.186.158,00 |
|
-16.840.428,00 |
|
|
IV.
Financial assets |
984.071,00 |
849.132,00 |
630.208,00 |
|
|
Shares
in associated companies |
440.527,00 |
1.556,00 |
1.556,00 |
|
|
Loans
to associated companies |
395.000,00 |
425.000,00 |
568.117,00 |
|
|
Other
loans |
206.076,00 |
412.152,00 |
618.228,00 |
|
|
Long
term deposits and guarantees |
11.479,00 |
11.479,00 |
11.479,00 |
|
|
Provisions |
-69.011,00 |
-1.055,00 |
-569.172,00 |
|
|
V.
Owners equity |
|
|
|
|
|
VI.
Long term trade liabilities |
|
|
|
|
|
C) DEFERRED
EXPENSES |
|
|
|
|
|
D)
CURRENT ASSETS |
24.928.567,00 |
30.237.665,00 |
42.127.662,00 |
|
|
I. Not
paid in shareholder capital |
|
|
|
|
|
II.
Inventory |
9.018.968,00 |
13.748.082,00 |
15.796.665,00 |
|
|
Raw
material inventory |
3.023.488,00 |
4.394.992,00 |
5.415.531,00 |
|
|
Work
in Progress |
3.494.136,00 |
4.757.063,00 |
5.204.449,00 |
|
|
Finished
goods |
2.397.064,00 |
4.467.180,00 |
5.022.689,00 |
|
|
Cash
advance |
104.280,00 |
128.847,00 |
153.996,00 |
|
|
III.
Debtors |
15.860.012,00 |
16.089.143,00 |
22.840.511,00 |
|
|
Clients |
12.868.513,00 |
12.704.843,00 |
17.351.587,00 |
|
|
Amounts
owned by affiliated companies |
2.193.240,00 |
2.656.645,00 |
5.399.274,00 |
|
|
Amounts
owned by associated companies |
|
143.117,00 |
|
|
|
Other
debts |
12.286,00 |
69.900,00 |
3.801,00 |
|
|
Taxes
refunds |
922.588,00 |
707.171,00 |
405.707,00 |
|
|
Provisions |
-136.615,00 |
-192.533,00 |
-319.858,00 |
|
|
IV.
Short term financial assets |
491,00 |
154.197,00 |
3.009.548,00 |
|
|
Short
term investment |
|
149.216,00 |
3.004.567,00 |
|
|
Short
Term Deposit and guarantees |
491,00 |
4.981,00 |
4.981,00 |
|
|
V.
Short term owners equity |
|
|
|
|
|
VI.
Cash |
22.289,00 |
212.001,00 |
363.301,00 |
|
|
VII.
Prepaid expenses and accrued income |
26.807,00 |
34.242,00 |
117.637,00 |
|
|
ASSETS
(A + B + C + D) |
61.407.653,00 |
67.728.681,00 |
75.645.679,00 |
Balance Sheet (LIABILITIES)
|
(Figures given in Euros) |
31/12/2002 (12)
|
31/12/2003 (12)
|
31/12/2004 (12)
|
|
|
|
A)
SHAREHOLDERS EQUITY |
33.941.524,00 |
34.252.401,00 |
36.356.187,00 |
|
|
I.
Capital |
999.763,00 |
999.763,00 |
999.763,00 |
|
|
II.
Premium share account |
22.655.718,00 |
20.278.933,00 |
20.278.933,00 |
|
|
III.
Revaluation reserve |
|
|
|
|
|
IV.
Reserves |
6.484.652,00 |
8.501.441,00 |
12.973.705,00 |
|
|
Retained
earnings |
199.953,00 |
199.953,00 |
199.953,00 |
|
|
Other funds |
6.284.679,00 |
8.301.488,00 |
12.773.752,00 |
|
|
Capital
adjustments in Euros |
20,00 |
|
|
|
|
V.
Prior year earnings |
|
|
|
|
|
VI.
Prior year profit or losses |
3.801.391,00 |
4.472.264,00 |
5.103.786,00 |
|
|
VII.
Dividend paid during the year |
|
|
-3.000.000,00 |
|
|
VIII.
Own shares for change in capital |
|
|
|
|
|
B)
DEFERRED INCOME |
31.931,00 |
15.965,00 |
|
|
|
Capital
grants |
31.931,00 |
15.965,00 |
|
|
|
C)
PROVISIONS FOR LIABILITIES AND EXPENSES |
|
|
176.251,00 |
|
|
Other
provisions |
|
|
176.251,00 |
|
|
D)
LONG TERM LIABILITIES |
7.204.920,00 |
10.069.583,00 |
7.703.663,00 |
|
|
I.
Bonds |
|
|
|
|
|
II.
Bank loans |
5.588.584,00 |
7.538.873,00 |
5.877.336,00 |
|
|
Long
term bank loans |
5.588.584,00 |
7.538.873,00 |
5.877.336,00 |
|
|
III.
Debts with associed and affiliated companies |
1.437.153,00 |
|
|
|
|
Debt
with affiliated companies |
1.437.153,00 |
|
|
|
|
IV.
Other creditors |
179.183,00 |
2.530.710,00 |
1.826.327,00 |
|
|
Other
debts |
|
2.376.785,00 |
1.826.327,00 |
|
|
Taxes
receivable |
179.183,00 |
153.925,00 |
|
|
|
V.
Deferred debts on shares |
|
|
|
|
|
VI.
Long term debt with creditor |
|
|
|
|
|
E)
SHORT TERM LIABILITIES |
20.229.278,00 |
23.390.732,00 |
31.409.578,00 |
|
|
I.
Negotiable bonds |
|
|
|
|
|
II.
Bank loans |
6.277.238,00 |
9.084.681,00 |
18.850.031,00 |
|
|
Loans
and other debts |
6.264.454,00 |
9.084.681,00 |
18.826.584,00 |
|
|
Debt
interest |
12.784,00 |
|
23.447,00 |
|
|
III.
Short term debts with associated and affiliated companies |
661.006,00 |
459.359,00 |
370.677,00 |
|
|
With
affiliated companies |
661.006,00 |
459.359,00 |
370.677,00 |
|
|
IV. Trade
creditors |
10.314.007,00 |
10.621.005,00 |
10.611.922,00 |
|
|
Expenses |
10.314.007,00 |
10.351.082,00 |
10.611.922,00 |
|
|
Bills
payable |
|
269.923,00 |
|
|
|
V.
Other non trade payables |
2.977.027,00 |
3.225.687,00 |
1.576.948,00 |
|
|
Government |
226.687,00 |
511.892,00 |
1.031.239,00 |
|
|
Bills
payable |
|
269.923,00 |
|
|
|
Other
debts |
2.211.044,00 |
2.073.694,00 |
358.423,00 |
|
|
Accounts
receivable |
539.296,00 |
370.178,00 |
187.286,00 |
|
|
VI.
Provisions for current assets |
|
|
|
|
|
VII.
Accruals and deferred incomes |
|
|
|
|
|
F)
SHORT TERM PROVISIONS FOR LIABILITIES AND EXPENSES |
|
|
|
|
|
LIABILITIES
(A + B + C + D + E + F) |
61.407.653,00 |
67.728.681,00 |
75.645.679,00 |
Profit and Loss Account
|
(Figures given in Euros) |
31/12/2002 (12)
|
31/12/2003 (12)
|
31/12/2004 (12)
|
|
|
|
A)
EXPENSES (A.1 a A.16) |
|
|
|
|
|
A.1. Change
in stocks of finished goods and work in progress |
|
|
|
|
|
A.2.
Supplies |
20.783.175,00 |
24.263.484,00 |
28.921.531,00 |
|
|
Material
consumed |
22.425,00 |
23.227,00 |
31.025,00 |
|
|
Raw
materials consumed |
20.645.840,00 |
24.097.885,00 |
28.720.731,00 |
|
|
Other
expenses |
114.910,00 |
142.372,00 |
169.775,00 |
|
|
A.3.
Labor cost |
5.828.695,00 |
6.439.956,00 |
6.679.341,00 |
|
|
Wages |
4.535.477,00 |
4.988.333,00 |
5.152.658,00 |
|
|
Social
security expenses |
1.293.218,00 |
1.451.623,00 |
1.526.683,00 |
|
|
A.4.
Assets depreciation |
4.931.949,00 |
5.639.751,00 |
6.643.373,00 |
|
|
A.5
Variance in provision for current assets |
|
55.918,00 |
127.325,00 |
|
|
Variance
in provision for bad debts |
|
55.918,00 |
|
|
|
Variance
in provision for other current assets |
|
|
127.325,00 |
|
|
A.6.
Other operating costs |
8.152.818,00 |
7.925.842,00 |
7.757.519,00 |
|
|
External
costs |
8.118.507,00 |
7.885.376,00 |
7.692.130,00 |
|
|
Taxes |
34.311,00 |
40.466,00 |
65.389,00 |
|
|
A.I.
OPERATING RESULT (B.1+B.2+B.3+B.4-A.1-A.2-A.3-A.4-A.5-A.6) |
6.158.944,00 |
7.479.479,00 |
8.776.737,00 |
|
|
A.7.
Financial expenses |
529.743,00 |
501.958,00 |
540.907,00 |
|
|
Debts
with related companies |
84.433,00 |
|
|
|
|
Other
companies debts |
445.310,00 |
501.958,00 |
540.907,00 |
|
|
A.8.
Variation in financial investments provision |
|
|
568.117,00 |
|
|
A.9.
Exchange losses |
140.243,00 |
54.582,00 |
125.677,00 |
|
|
A.II.
POSITIVE FINANCIAL RESULTS (B.5+B.6+B.7+B.8-A.7-A.8-A.9) |
|
|
|
|
|
A.III.
PROFIT FROM ORDINARY ACTIVITIES (A.I+A.II-B.I-B.II) |
5.610.992,00 |
6.993.707,00 |
7.591.169,00 |
|
|
A.10.
Variation in provision in fixed assets |
40.467,00 |
|
|
|
|
A.11.
Losses in fixed assets |
2.932,00 |
371.015,00 |
2.627,00 |
|
|
A.12.
Losses from shares and bonds |
|
963,00 |
|
|
|
A.13.
Extraordinary charges |
3.405,00 |
|
10.142,00 |
|
|
A.14.
Prior year’s expenses and losses |
|
|
13.452,00 |
|
|
A.IV.
POSITIVE EXTRAORDINARY RESULT (B.9+B.10+B.11+B.12+B.13-A.10-A.11-A.12-A.13-A.14) |
29.594,00 |
|
10.051,00 |
|
|
A.V.
EARNINGS / LOSS BEFORE TAXES (A.III+A.IV-B.III-B.IV) |
5.640.586,00 |
6.638.881,00 |
7.601.220,00 |
|
|
A.15.
Corporate Taxes |
1.839.195,00 |
2.166.617,00 |
2.497.434,00 |
|
|
A.16.
Other taxes |
|
|
|
|
|
A.VI.
YEAR END RESULT (PROFIT) (A.V-A.15-A.16) |
3.801.391,00 |
4.472.264,00 |
5.103.786,00 |
|
|
B)
INCOMES (B.1 a B13) |
|
|
|
|
|
B.1.
Turnover |
44.121.873,00 |
47.867.590,00 |
56.277.488,00 |
|
|
Sales |
44.510.766,00 |
48.255.540,00 |
56.277.488,00 |
|
|
Discounts |
-388.893,00 |
-387.950,00 |
|
|
|
B.2.
Increase in inventory of finished goods |
933.240,00 |
3.333.043,00 |
1.002.895,00 |
|
|
B.3.
Expenses capitalized |
447.104,00 |
354.036,00 |
1.436.301,00 |
|
|
B.4.
Other operating income |
353.364,00 |
249.761,00 |
189.142,00 |
|
|
Other
incomes |
330.416,00 |
229.052,00 |
189.142,00 |
|
|
Grants |
22.948,00 |
20.709,00 |
|
|
|
B.I.
OPERATING LOSSES (A.1+A.2+A.3+A.4+A.5+A.6-B.1-B.2-B.3-B.4) |
|
|
|
|
|
B.5.
Incomes from share |
|
|
|
|
|
B.6.
Income from securities |
|
|
|
|
|
B.7.
Other income from interrest |
5.583,00 |
8.257,00 |
14.939,00 |
|
|
From
other companies |
5.583,00 |
8.257,00 |
14.939,00 |
|
|
B.8.
Gains on exchange |
116.451,00 |
62.511,00 |
34.194,00 |
|
|
B.II.
FINANCIAL LOSSES (A.7+A.8+A.9-B.5-B.6-B.7-B.8) |
547.952,00 |
485.772,00 |
1.185.568,00 |
|
|
B.III.
LOSSES FROM ORDINARY ACTIVITIES (B.I+B.II-A.I-A.II) |
|
|
|
|
|
B.9.
Gains from disposal of fixed assets |
|
1.186,00 |
11.504,00 |
|
|
B.10.
Gains from dealing in own shares |
|
|
|
|
|
B.11.
Paid in surplus |
30.619,00 |
15.966,00 |
15.965,00 |
|
|
B.12.
Extraordinary income |
34.069,00 |
|
5.250,00 |
|
|
B.13.
Prior year’s income and profits |
11.710,00 |
|
3.553,00 |
|
|
B.IV.
EXTRAORDINARY LOSSES (A.10+A.11+A.12+A.13+A.14-B.9-B.10-B.11-B.12-B.13) |
|
354.826,00 |
|
|
|
B.V.
LOSS BEFORE TAXES (B.III+B.IV-A.III-A.IV) |
|
|
|
|
|
B.VI.
NET LOSS (B.V+A.15+A.16) |
|
|
|
Main Ratios
|
(Figures given in
Euros) |
2.002 (12)
|
2.003 (12)
|
2.004 (12)
|
|
|
|
ACTIVITY |
|
|
|
|
|
Increase of the
Sales Figures |
14,71 |
8,49 |
17,57 |
|
|
Assets Turnover |
0,72 |
0,71 |
0,74 |
|
|
Productivity |
2,90 |
3,05 |
3,33 |
|
|
Increase of the
Added Value |
18,16 |
15,93 |
13,32 |
|
|
PROFITABILITY |
|
|
|
|
|
Economic
Profitability |
6,19 |
6,60 |
6,75 |
|
|
Financial
Profitability |
11,20 |
13,06 |
14,04 |
|
|
Financial
Expenses |
1,20 |
1,05 |
0,96 |
|
|
BALANCE (IN DAYS
OF SALES) |
|
|
|
|
|
Customers’ Credit
(In days of sales) |
129,00 |
121,00 |
146,00 |
|
|
Suppliers’ Credit
(In days of sales) |
187,00 |
183,00 |
137,00 |
|
|
Working Capital
(In days of sales) |
38,00 |
51,00 |
69,00 |
|
|
Working Capital
Requirement (In days of sales) |
89,00 |
117,00 |
168,00 |
|
|
Treasury (In days
of sales) |
0,00 |
0,00 |
0,00 |
|
|
BALANCE |
|
|
|
|
|
Working Capital |
4.699.289,00 |
6.846.933,00 |
10.718.084,00 |
|
|
Working Capital
Requirement |
10.953.747,00 |
15.565.416,00 |
26.195.266,00 |
|
|
Treasury |
-6.254.458,00 |
-8.718.483,00 |
-15.477.182,00 |
|
|
Balance Ratio |
1,13 |
1,18 |
1,32 |
|
|
SOLVENCY |
|
|
|
|
|
Borrowing Ratio |
44,68 |
49,40 |
51,71 |
|
|
Own / Permanent
Funds |
82,43 |
77,25 |
82,19 |
|
|
Payback Capacity |
0,56 |
0,63 |
0,62 |
|
|
LIQUIDITY |
|
|
|
|
|
General Liquidity |
1,23 |
1,29 |
1,34 |
|
|
Immediate
Liquidity |
0,00 |
0,02 |
0,11 |
Sectorial Analysis
Summary of Assets, Liability & Equity
|
(Figures given in
Percentages) |
Company |
Sector |
Company |
|
|
2.004 |
|
|
|
Assets |
|||
|
DUE
FROM SHAREHOLDERS FOR UNCALLED CAPITAL |
0,00 |
0,00 |
0,00 |
|
FIXED
ASSETS |
44,31 |
53,21 |
-8,90 |
|
ACCRUED
EXPENSES |
0,00 |
0,19 |
-0,19 |
|
CURRENT
ASSETS |
55,69 |
46,60 |
9,09 |
|
TOTAL
ASSETS |
100,00 |
100,00 |
0,00 |
|
Liabilities |
|||
|
SHAREHOLDERS
EQUITY |
48,06 |
53,41 |
-5,35 |
|
ACCRUED
INCOME |
0,00 |
2,01 |
-2,01 |
|
RISK
AND EXPENDITURE COVER |
0,23 |
1,65 |
-1,42 |
|
LONG-TERM
CREDITORS |
10,18 |
11,51 |
-1,33 |
|
SHORT-TERM
CREDITORS |
41,52 |
31,36 |
10,16 |
|
SHORT-TERM
RISK AND EXPENDITURE COVER |
0,00 |
0,06 |
-0,06 |
|
TOTAL
LIABILITIES |
100,00 |
100,00 |
0,00 |
Analytical Account of Results
|
(Figures given in
Percentages) |
Company |
Sector |
Company |
|
|
2.004 |
|
|
|
Net
turnover |
97,19 |
97,80 |
-0,61 |
|
Other
operating income |
2,81 |
2,20 |
0,61 |
|
Production
Value |
100,00 |
100,00 |
0,00 |
|
Operating
expenses |
48,22 |
62,55 |
-14,34 |
|
Other
operation expenses |
13,40 |
18,15 |
-4,76 |
|
Added
value |
38,39 |
19,29 |
19,09 |
|
Labor
cost |
11,54 |
9,76 |
1,78 |
|
Gross
Economic Result |
26,85 |
9,53 |
17,32 |
|
Assets
depreciation |
11,47 |
4,81 |
6,66 |
|
Variation
in provision for current assets |
0,22 |
-0,00 |
0,22 |
|
Net
Economic Result |
15,16 |
4,73 |
10,43 |
|
Financial
income |
0,08 |
2,24 |
-2,15 |
|
Financial
expenses |
2,13 |
1,40 |
0,73 |
|
Variation
in financial investment provision |
0,98 |
-0,00 |
0,98 |
|
Ordinary
Activities Result |
13,11 |
5,57 |
7,54 |
|
Extraordinary
income |
0,06 |
2,02 |
-1,96 |
|
Extraordinary
expenses |
0,05 |
0,70 |
-0,66 |
|
Variation
in provision in fixed assets |
0,00 |
0,41 |
-0,41 |
|
Results
before Taxes |
13,13 |
6,48 |
6,65 |
|
Corporaye
taxes |
4,31 |
1,15 |
3,17 |
|
Net
Result |
8,81 |
5,33 |
3,48 |
|
Assets
depreciation |
11,47 |
4,81 |
6,66 |
|
Provisions
fund variation |
1,20 |
0,40 |
0,80 |
|
Net
Self-Financing |
21,49 |
10,55 |
10,94 |
Ratios
|
(Figures given in
) |
Company |
Ptile25
|
Medium
|
Ptile75
|
|
|
2.004 |
|
|
|
|
ACTIVITY |
|
|
|
|
|
Increase
of the Sales Figures |
17,57 |
-1,14 |
4,63 |
11,39 |
|
Assets
Turnover |
0,74 |
0,79 |
1,22 |
1,57 |
|
Fixed
Assets Turnover |
1,68 |
1,44 |
2,94 |
4,81 |
|
Increase
of the Added Value |
13,32 |
-21,38 |
-3,92 |
9,40 |
|
PRODUCTIVITY |
|
|
|
|
|
Productivity |
3,33 |
1,29 |
1,66 |
2,37 |
|
Change
of Personnel Costs |
3,72 |
1,71 |
6,28 |
9,95 |
|
Average
Personnel Costs |
34.970,37 |
41.569,79 |
52.562,37 |
60.216,64 |
|
Value
Added by Employees |
116.370,56 |
55.231,28 |
82.623,88 |
122.283,29 |
|
CASH FLOW |
|
|
|
|
|
Cash
Flow |
12.442.601,00 |
3.559.045,21 |
6.043.230,50 |
19.281.767,17 |
|
Operating
Cash Flow |
15.547.435,00 |
3.212.042,00 |
5.208.500,00 |
16.106.000,00 |
|
Change
in Cash Flow |
22,37 |
-36,65 |
-5,44 |
7,75 |
|
PROFITABILITY |
|
|
|
|
|
Economic
Profitability |
6,75 |
0,69 |
3,82 |
7,08 |
|
Financial
Profitability |
14,04 |
1,16 |
7,39 |
14,46 |
|
Financial
Expenses |
0,96 |
0,35 |
0,68 |
1,00 |
|
Gross
Economic Profitability |
20,55 |
4,28 |
8,66 |
14,17 |
|
Gross
Financial Profitability |
42,76 |
9,23 |
18,45 |
34,49 |
|
BALANCE (IN DAYS
OF SALES) |
|
|
|
|
|
Customers’
Credit (In days of sales) |
146,00 |
77,47 |
99,12 |
119,49 |
|
Suppliers’
Credit (In days of sales) |
136,00 |
34,43 |
78,60 |
115,48 |
|
Working
Capital (In days of sales) |
68,00 |
9,92 |
33,32 |
73,55 |
|
Working
Capital Requirement (In days of sales) |
167,00 |
10,48 |
25,11 |
60,77 |
|
Treasury
(In days of sales) |
0,00 |
-22,83 |
3,77 |
40,54 |
|
Operating
Current Assets |
269,00 |
128,23 |
163,68 |
193,80 |
|
BALANCE |
|
|
|
|
|
Working
Capital |
10.718.084,00 |
1.889.511,08 |
9.055.539,50 |
24.137.697,00 |
|
Working
Capital Requirement |
26.195.266,00 |
1.514.067,83 |
5.215.903,06 |
21.138.250,00 |
|
Treasury |
-15.477.182,00 |
-6.216.611,50 |
855.990,12 |
7.110.909,13 |
|
Balance
Ratio |
1,32 |
1,04 |
1,38 |
1,66 |
|
SOLVENCY |
|
|
|
|
|
Borrowing
Ratio |
51,71 |
38,24 |
51,58 |
67,03 |
|
Own
/ Permanent Funds |
82,19 |
69,25 |
92,87 |
98,02 |
|
Payback
Capacity |
0,62 |
0,28 |
0,40 |
0,51 |
|
Long
term Indebtedness |
10,18 |
0,01 |
3,79 |
17,89 |
|
Gearing |
208,07 |
161,92 |
206,55 |
303,27 |
|
Financing
Basic Ratio |
1,00 |
1,00 |
1,00 |
1,02 |
|
Assets
Guarantee |
1,93 |
1,49 |
1,88 |
2,56 |
|
LIQUIDITY |
|
|
|
|
|
General
Liquidity |
1,34 |
1,07 |
1,22 |
1,84 |
|
Immediate
Liquidity |
0,11 |
0,02 |
0,13 |
0,48 |
The date when this report was last updated
is 28/04/2006.
This company was last displayed
on 02/06/2006, it has been viewed 12 times in the last
quarter and 397 times in total .
RATING EXPLANATIONS
|
RATING |
STATUS |
PROPOSED CREDIT LINE |
|
|
>86 |
Aaa |
Possesses an extremely sound financial
base with the strongest capability for timely payment of interest and
principal sums |
Unlimited |
|
71-85 |
Aa |
Possesses adequate working capital. No
caution needed for credit transaction. It has above average (strong)
capability for payment of interest and principal sums |
Large |
|
56-70 |
A |
Financial & operational base are
regarded healthy. General unfavourable factors will not cause fatal effect.
Satisfactory capability for payment of interest and principal sums |
Fairly Large |
|
41-55 |
Ba |
Overall operation is considered normal.
Capable to meet normal commitments. |
Satisfactory |
|
26-40 |
B |
Unfavourable & favourable factors
carry similar weight in credit consideration. Capability to overcome
financial difficulties seems comparatively below average/normal. |
Small |
|
11-25 |
Ca |
Adverse factors are apparent. Repayment of
interest and principal sums in default or expected to be in default upon
maturity |
Limited with full security |
|
<10 |
C |
Absolute credit risk exists. Caution
needed to be exercised |
Credit not recommended |