
MIRA
INFORM REPORT
|
Report Date : |
26th
June 2006 |
IDENTIFICATION
DETAILS
|
Name : |
TEXTILES
SAR SL |
|
|
|
|
Formerly Known As : |
TEXTILES SAR SA |
|
|
|
|
Registered Office : |
Poligono Industrial San Rafael Vial
F, 15 |
|
|
|
|
Country : |
Spain |
|
|
|
|
Financials (as on) : |
31/12/2004 |
|
|
|
|
Date of Incorporation : |
05/09/1973 |
|
|
|
|
Legal Form : |
Limited Liability Company |
|
|
|
|
Line of Business : |
Manufacturers of other outerwear. |
RATING & COMMENTS
|
MIRA’s Rating : |
Aa |
|
RATING |
STATUS |
PROPOSED CREDIT LINE |
|
|
71-85 |
Aa |
Possesses adequate working capital. No
caution needed for credit transaction. It has above average (strong)
capability for payment of interest and principal sums |
Large |
|
Status : |
Good |
|
|
|
|
Payment Behaviour : |
Regular
|
|
|
|
|
Litigation : |
Clear |
name
TEXTILES
SAR SL
TAX NUMBER
B02005999
Identification and
Characteristics
|
Tax
Number |
B02005999 |
|
NAME |
TEXTILES SAR SL |
|
FORMER
NAME |
TEXTILES SAR SA |
|
BUSINESS
ADDRESS |
POLIGONO
INDUSTRIAL SAN RAFAEL VIAL F, 15 |
|
Postcode |
02400
HELLIN (ALBACETE) |
|
FORMER
ADDRESS |
CALLE
MURCIA, 4 |
|
Postcode |
02400
HELLIN (ALBACETE) |
|
URL |
http://www.tesar.es |
|
TELEPHONE |
967300487 |
|
FAX |
967303178 |
|
LEGAL
FORM |
LIMITED LIABILITY
COMPANY |
|
DATE
FOUNDED |
05/09/1973 |
|
CAPITAL |
181.806,17 Euros |
|
NUMBER
OF EMPLOYEES |
11 |
|
BANKS |
CAJAMADRID.HELLIN;
BANESTO; B POPULAR; BSCH; |
|
ACTIVITY |
1455000 - Mfg.
of other outerwear |
|
CNAE |
1754 - Manufacture
of other textiles n.e.c. |
Synthesis
|
||
|
FINANCIAL
SITUATION |
||
|
|
|
|
|
PROFITABILITY |
|
7/9 Good |
|
TREASURY |
|
9/9 Excellent |
|
BALANCE
SHEET |
|
9/9 Excellent |
|
DEBT |
|
7/9 Low |
|
INCIDENTS |
||
|
|
|
|
|
COMMITMENTS |
|
9/9 Respected |
|
INCIDENTS |
|
9/9 None
or Negligible |
|
PREVIOUS
EXPERIENCE |
||
|
|
|
|
|
PREVIOUS
EXPERIENCE |
|
8/9 Favourable |
Credit Appraisal
|
CREDIT ACCORDING
TO OBJECTIVE DATA (From 0 to 500.000,00 Euros): |
|
FAVOURABLE
TOWARDS 113.002,30 Max. |
|
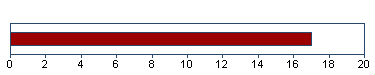
SOLVENCY RATING: |
|
17/20 (BASED
ON HOMOGENEOUS FORMULATION) |
|
|
|
|
Financial Elements
Figures given in
Euros
|
|
Balance
sheet 2.002 (12) |
Balance
sheet 2.003 (12) |
Balance
sheet 2.004 (12) |
%
Sales |
|
SALES |
1.736.448,77 |
2.316.219,08 |
3.041.579,33 |
|
|
ADDED VALUE |
365.886,81 |
427.211,47 |
687.966,49 |
22,62 |
|
BUSINESS RESULT |
161.990,64 |
178.420,76 |
360.290,35 |
11,85 |
|
OWN FUNDS |
651.353,73 |
777.585,36 |
967.931,37 |
|
|
DEBT |
685.152,83 |
839.725,22 |
1.113.123,68 |
|
|
TOTAL ASSET |
1.383.482,34 |
1.652.880,86 |
2.288.242,71 |
|
|
The sales of
3.041.579,33 Euros show a change of 31,32%
compared with 2.003 . Between 2.002 and
2.003 , this change was 33,39% . |
||||
|
Added value grew
by 61,04% compared with the previous year. Shareholders equity
are 967.931,37 Euros for an indebtedness of
1.113.123,68 Euros . |
||||
|
The result
360.290,35 Euros means financial profitability of
37,22% and economic profitability of 15,75% . This
result means growth of 101,93% compared with the
2.003 . |
||||
|
|
||||
|
THE FIGURES FOR
THE LAST BALANCE SHEET ARE RELEVANT: |
||||
|
SOURCE: FROM
THE MERCANTILE REGISTER |
||||
|
DATE: 04/10/2005 |
||||
Comparative Sector Analysis
|
|
Company |
Sector |
Difference |
|
|
(2.004) |
|
|
|
%
of PRODUCTION VALUE |
|
|
|
|
SALES |
100,00 |
96,70 |
3,30 |
|
ADDED
VALUE |
22,62 |
30,66 |
-8,04 |
|
BUSINESS
RESULT |
11,85 |
2,23 |
9,62 |
|
%
OF TOTAL ASSETS |
|
|
|
|
OWN
FUNDS |
42,30 |
39,60 |
2,70 |
|
DEBT |
48,65 |
60,40 |
-11,75 |
Compared sector
(CNAE): 175 - Otras industrias textiles
Number of
companies: 40
Size (Sales
Figure): 2.800.000,00 - 7.000.000,00 Euros
The turnover of the
company is 3,30% above the mean for the sector.
The company’s added
value was 22,62% s/ the production value, and 8,04% below the mean
for the sector.
The company’s
business result was 11,85% of the PV, 9,62% above the mean for the
sector.
The company’s own
resources are 42,30% , 2,70% above the mean for the sector.
The company’s
outside resources are 48,65% , 11,75% below the mean for the
sector.
Legal Actions
|
No legal
incidences registered for this company in the official source |
|
No claims
registered for this company in the official sources |
|
AFFECTED
BY: No significant elemento |
Main Board members, Directors and
Auditor
|
Position |
Surname and name |
Date
of appointment |
|
ADMINISTRATOR |
ROLDAN COLLADOS
ANTONIO |
12/02/2002 |
|
ADMINISTRATOR |
MUNOZ LOPEZ
MILAGROS |
12/02/2002 |
|
ADMINISTRATOR |
ROLDAN MUNOZ
JUSTO PASCUAL |
12/02/2002 |
|
ADMINISTRATOR |
ROLDAN ALCANTUD
ANTONIO |
12/02/2002 |
|
ADMINISTRATOR |
ROLDAN ALCANTUD
JUSTO |
12/02/2002 |
|
ADMINISTRATOR |
ROLDAN MUNOZ
FRANCISCO JAVIER |
12/02/2002 |
Financial Links
|
Shareholders |
||||
|
Company Name |
CIF/Country |
Percent. |
Source |
Information Date |
|
ROLDAN COLLADOS
ANTONIO |
|
50,00%
|
M.REGISTER |
31/12/2004 |
|
MUNOZ LOPEZ
MILAGROS |
|
50,00%
|
M.REGISTER |
31/12/2004 |
Proceedings published in the
B.O.R.M.E. (Official Mercantile Register Gazette)
|
Proceedings |
Date |
Notice
Num. |
Mercantile
Reg. |
|
Registration of
accounts (2004) |
05/08/2005 |
193948 |
ALBACETE |
|
Registration of
accounts (2003) |
10/08/2004 |
193181 |
ALBACETE |
|
Registration of
accounts (2002) |
18/08/2003 |
215553 |
ALBACETE |
|
Registration of
accounts (2001) |
13/08/2002 |
202441 |
ALBACETE |
|
Resignations |
12/02/2002 |
062681 |
ALBACETE |
Remarks for customer
Here is our final
resport. Even thoudh this company is obliged to file their balance sheets in
the Mercantile Register,no official balance sheets are available for 2005.
Brands, Signs and Commercial
Names
|
Prevailing Brands |
|||||
|
Name: |
TESAR |
||||
|
Kind
of Brand: |
JOINT |
File: |
M2138587 |
||
|
Request
Date: |
26/01/1998 |
Bulletin
Date: |
Bulletin
Date: |
Current
situation: |
APPROVED
REGISTER |
|
Types:
27 |
|
||||
Total
Marcas: 1
The information on the last account
contained in this report is extracted from the Mercantile Register file of the
legal address of the Company and dated 04/10/2005
Balance Sheet (ASSETS)
|
(Figures given in
Euros) |
31/12/2002 (12)
|
31/12/2003 (12)
|
31/12/2004 (12)
|
|
|
|
A) DUE FROM
SHAREHOLDERS FOR UNCALLED CAPITAL |
|
|
|
|
|
B) FIXED ASSETS |
501.646,21 |
530.956,76 |
932.266,54 |
|
|
I. Establishment
expenses |
|
|
|
|
|
II. Intangible
assets |
|
|
|
|
|
III. Tangible
assets |
492.635,65 |
509.787,15 |
904.027,86 |
|
|
IV. Financial
assets |
9.010,56 |
21.169,61 |
28.238,68 |
|
|
V. Owners equity |
|
|
|
|
|
VI. Long term
trade liabilities |
|
|
|
|
|
C) DEFERRED
EXPENSES |
|
|
|
|
|
D) CURRENT ASSETS |
881.836,13 |
1.121.924,10 |
1.355.976,17 |
|
|
I. Not paid in
shareholder capital |
|
|
|
|
|
II. Inventory |
454.031,00 |
614.049,00 |
669.537,00 |
|
|
III. Debtors |
397.846,36 |
473.065,31 |
657.379,40 |
|
|
IV. Short term
financial assets |
|
|
|
|
|
V. Short term
owners equity |
|
|
|
|
|
VI. Cash |
29.958,77 |
34.809,79 |
29.059,77 |
|
|
VII. Prepaid
expenses and accrued income |
|
|
|
|
|
ASSETS (A + B + C
+ D) |
1.383.482,34 |
1.652.880,86 |
2.288.242,71 |
Balance Sheet (LIABILITIES)
|
(Figures given in
Euros) |
31/12/2002 (12)
|
31/12/2003 (12)
|
31/12/2004 (12)
|
|
|
|
A) SHAREHOLDERS
EQUITY |
651.353,73 |
777.585,36 |
967.931,37 |
|
|
I. Capital |
181.806,17 |
181.806,17 |
181.806,17 |
|
|
II. Premium share
account |
|
|
|
|
|
III. Revaluation
reserve |
|
|
|
|
|
IV. Reserves |
307.556,92 |
417.358,43 |
425.834,85 |
|
|
Sundry reserves |
307.556,92 |
417.358,43 |
425.834,85 |
|
|
V. Prior year
earnings |
|
|
|
|
|
VI. Prior year
profit or losses |
161.990,64 |
178.420,76 |
360.290,35 |
|
|
VII. Dividend
paid during the year |
|
|
|
|
|
VIII. Own shares
for change in capital |
|
|
|
|
|
B) DEFERRED
INCOME |
40.548,45 |
30.839,63 |
200.613,87 |
|
|
C) PROVISIONS FOR
LIABILITIES AND EXPENSES |
6.427,33 |
4.730,65 |
6.573,79 |
|
|
D) LONG TERM
LIABILITIES |
438.004,88 |
418.564,86 |
659.394,33 |
|
|
E) SHORT TERM
LIABILITIES |
247.147,95 |
421.160,36 |
453.729,35 |
|
|
F) SHORT TERM
PROVISIONS FOR LIABILITIES AND EXPENSES |
|
|
|
|
|
LIABILITIES (A +
B + C + D + E + F) |
1.383.482,34 |
1.652.880,86 |
2.288.242,71 |
Profit and Loss Account
|
(Figures given in
Euros) |
31/12/2002 (12)
|
31/12/2003 (12)
|
31/12/2004 (12)
|
|
|
|
A) EXPENSES (A.1
a A.15) |
|
|
|
|
|
A.1 Operating
Expenses |
1.101.742,07 |
1.496.710,90 |
1.930.079,47 |
|
|
A.3. Labor cost |
151.911,41 |
187.272,85 |
240.208,17 |
|
|
Wages |
107.727,89 |
131.956,74 |
170.226,38 |
|
|
Social security
expenses |
44.183,52 |
55.316,11 |
69.981,79 |
|
|
A.3. Assets
depreciation |
5.342,94 |
9.441,21 |
6.700,60 |
|
|
A.4. Variance in provision
for current assets |
1.159,97 |
7.963,28 |
19.748,20 |
|
|
A.5. Other
operating costs |
274.090,71 |
395.185,75 |
423.533,37 |
|
|
A.I. OPERATING
RESULT (B.1-A.1-A.2-A.3-A.4-A.5) |
207.472,49 |
222.534,13 |
421.309,52 |
|
|
A.6. Financial
expenses |
44.468,06 |
41.824,97 |
57.205,65 |
|
|
Other companies
debts |
44.468,06 |
41.824,97 |
57.205,65 |
|
|
A.7. Variation in
financial investments provision |
|
|
|
|
|
A.8. Exchange
losses |
|
|
|
|
|
A.II. POSITIVE
FINANCIAL RESULTS (B.2+B.3-A.6-A.7-A.8) |
|
|
|
|
|
A.III. PROFIT
FROM ORDINARY ACTIVITIES (A.I+A.II-B.I-B.II) |
163.004,43 |
180.709,16 |
364.103,87 |
|
|
A.9. Variation in
provision in fixed assets |
|
|
|
|
|
A.10. Losses in
fixed assets |
|
|
|
|
|
A.11. Losses from
shares and bonds |
|
|
|
|
|
A.12.
Extraordinary charges |
|
|
|
|
|
A.13. Prior
year’s expenses and losses |
|
|
|
|
|
A.IV. POSITIVE
EXTRAORDINARY RESULT (B.4+B.5+B.6+B.7+B.8-A.9-A.10-A.11-A.12-A.13) |
|
|
|
|
|
A.V. EARNINGS /
LOSS BEFORE TAXES (A.III+A.IV-B.III-B.IV) |
163.004,43 |
180.709,16 |
364.103,87 |
|
|
A.14. Corporate
Taxes |
|
|
|
|
|
A.15. Other taxes |
1.013,79 |
2.288,40 |
3.813,52 |
|
|
A.VI. YEAR END
RESULT (PROFIT) (A.V-A.14-A.15) |
161.990,64 |
178.420,76 |
360.290,35 |
|
|
B) INCOMES (B.1 a
B.8) |
|
|
|
|
|
B.1. Operating
income |
1.741.719,59 |
2.319.108,12 |
3.041.579,33 |
|
|
Turnover |
1.736.448,77 |
2.316.219,08 |
3.041.579,33 |
|
|
Other operating
income |
5.270,82 |
2.889,04 |
|
|
|
B.I. OPERATING
LOSSES (A.1+A.2+A.3+A.4+A.5-B.1) |
|
|
|
|
|
B.2. Financial
Income |
|
|
|
|
|
B.3. Gains on
exchange |
|
|
|
|
|
B.II. FINANCIAL
LOSSES (A.6+A.7+A.8-B.2-B.3) |
44.468,06 |
41.824,97 |
57.205,65 |
|
|
B.III. LOSSES
FROM ORDINARY ACTIVITIES (B.I+B.II-A.I-A.II) |
|
|
|
|
|
B.4. Gains from
disposal of fixed assets |
|
|
|
|
|
B.5. Gains from
dealing in own shares |
|
|
|
|
|
B.6. Paid in
surplus |
|
|
|
|
|
B.7.
Extraordinary income |
|
|
|
|
|
B.8. Prior year’s
income and profits |
|
|
|
|
|
B.IV.
EXTRAORDINARY LOSSES (A.9+A.10+A.11+A.12+A.13-B.4-B.5-B.6-B.7-B.8) |
|
|
|
|
|
B.V. LOSS BEFORE
TAXES (B.III+B.IV-A.III-A.IV) |
|
|
|
|
|
B.VI. NET LOSS
(B.V+A.14+A.15) |
|
|
|
Main Ratios
|
(Figures given in
Euros) |
2.002 (12)
|
2.003 (12)
|
2.004 (12)
|
|
|
|
ACTIVITY |
|
|
|
|
|
Increase of the
Sales Figures |
20,15 |
33,39 |
31,32 |
|
|
Assets Turnover |
1,25 |
1,40 |
1,33 |
|
|
Productivity |
2,41 |
2,28 |
2,86 |
|
|
Increase of the
Added Value |
56,68 |
16,76 |
61,04 |
|
|
PROFITABILITY |
|
|
|
|
|
Economic
Profitability |
11,71 |
10,80 |
15,75 |
|
|
Financial
Profitability |
24,87 |
22,95 |
37,22 |
|
|
Financial
Expenses |
2,56 |
1,81 |
1,88 |
|
|
BALANCE (IN DAYS
OF SALES) |
|
|
|
|
|
Customers’ Credit
(In days of sales) |
82,00 |
74,00 |
78,00 |
|
|
Suppliers’ Credit
(In days of sales) |
|
|
|
|
|
Working Capital
(In days of sales) |
132,00 |
109,00 |
107,00 |
|
|
Working Capital
Requirement (In days of sales) |
125,00 |
104,00 |
103,00 |
|
|
Treasury (In days
of sales) |
6,00 |
5,00 |
3,00 |
|
|
BALANCE |
|
|
|
|
|
Working Capital |
634.688,18 |
700.763,74 |
902.246,82 |
|
|
Working Capital
Requirement |
604.729,41 |
665.953,95 |
873.187,05 |
|
|
Treasury |
29.958,77 |
34.809,79 |
29.059,77 |
|
|
Balance Ratio |
2,27 |
2,32 |
1,97 |
|
|
SOLVENCY |
|
|
|
|
|
Borrowing Ratio |
49,52 |
50,80 |
48,65 |
|
|
Own / Permanent
Funds |
57,32 |
63,13 |
52,76 |
|
|
Payback Capacity |
0,39 |
0,36 |
0,36 |
|
|
LIQUIDITY |
|
|
|
|
|
General Liquidity |
3,57 |
2,66 |
2,99 |
|
|
Immediate
Liquidity |
0,12 |
0,08 |
0,06 |
Sectorial Analysis
Summary of Assets, Liability & Equity
|
(Figures given in
Percentages) |
Company |
Sector |
Company |
|
|
2.004 |
|
|
|
Assets |
|||
|
DUE
FROM SHAREHOLDERS FOR UNCALLED CAPITAL |
0,00 |
0,00 |
0,00 |
|
FIXED
ASSETS |
40,74 |
36,75 |
3,99 |
|
ACCRUED
EXPENSES |
0,00 |
0,27 |
-0,27 |
|
CURRENT
ASSETS |
59,26 |
62,99 |
-3,73 |
|
TOTAL
ASSETS |
100,00 |
100,00 |
0,00 |
|
Liabilities |
|||
|
SHAREHOLDERS
EQUITY |
42,30 |
39,60 |
2,70 |
|
ACCRUED
INCOME |
8,77 |
0,37 |
8,40 |
|
RISK
AND EXPENDITURE COVER |
0,29 |
0,11 |
0,18 |
|
LONG-TERM
CREDITORS |
28,82 |
12,60 |
16,22 |
|
SHORT-TERM
CREDITORS |
19,83 |
47,31 |
-27,48 |
|
SHORT-TERM
RISK AND EXPENDITURE COVER |
0,00 |
0,00 |
0,00 |
|
TOTAL
LIABILITIES |
100,00 |
100,00 |
0,00 |
Analytical Account of Results
|
(Figures given in
Percentages) |
Company |
Sector |
Company |
|
|
2.004 |
|
|
|
Net
turnover |
100,00 |
96,70 |
3,30 |
|
Other
operating income |
0,00 |
3,30 |
-3,30 |
|
Production
Value |
100,00 |
100,00 |
0,00 |
|
Operating
expenses |
63,46 |
54,19 |
9,27 |
|
Other
operation expenses |
13,92 |
15,15 |
-1,23 |
|
Added
value |
22,62 |
30,66 |
-8,04 |
|
Labor
cost |
7,90 |
21,31 |
-13,41 |
|
Gross
Economic Result |
14,72 |
9,35 |
5,37 |
|
Assets
depreciation |
0,22 |
4,15 |
-3,93 |
|
Variation
in provision for current assets |
0,65 |
0,47 |
0,18 |
|
Net
Economic Result |
13,85 |
4,73 |
9,13 |
|
Financial
income |
0,00 |
0,35 |
-0,35 |
|
Financial
expenses |
1,88 |
2,38 |
-0,50 |
|
Variation
in financial investment provision |
0,00 |
0,00 |
0,00 |
|
Ordinary
Activities Result |
11,97 |
2,69 |
9,28 |
|
Extraordinary
income |
0,00 |
0,74 |
-0,74 |
|
Extraordinary
expenses |
0,00 |
0,18 |
-0,18 |
|
Variation
in provision in fixed assets |
0,00 |
0,03 |
-0,03 |
|
Results
before Taxes |
11,97 |
3,23 |
8,74 |
|
Corporaye
taxes |
0,13 |
1,00 |
-0,88 |
|
Net
Result |
11,85 |
2,23 |
9,62 |
|
Assets
depreciation |
0,22 |
4,15 |
-3,93 |
|
Provisions
fund variation |
0,65 |
0,50 |
0,15 |
|
Net
Self-Financing |
12,72 |
6,88 |
5,84 |
Ratios
|
(Figures given in
) |
Company |
Ptile25
|
Medium
|
Ptile75
|
|
|
2.004 |
|
|
|
|
ACTIVITY |
|
|
|
|
|
Increase
of the Sales Figures |
31,32 |
-16,60 |
-3,85 |
1,40 |
|
Assets
Turnover |
1,33 |
0,91 |
1,18 |
1,44 |
|
Fixed
Assets Turnover |
3,26 |
2,38 |
3,96 |
6,98 |
|
Increase
of the Added Value |
61,04 |
-8,94 |
-3,56 |
5,36 |
|
PRODUCTIVITY |
|
|
|
|
|
Productivity |
2,86 |
1,19 |
1,40 |
1,85 |
|
Change
of Personnel Costs |
28,27 |
-2,61 |
4,77 |
9,81 |
|
Average
Personnel Costs |
21.837,11 |
18.129,60 |
21.140,63 |
24.834,42 |
|
Value
Added by Employees |
62.542,41 |
23.920,93 |
32.320,77 |
39.438,66 |
|
CASH FLOW |
|
|
|
|
|
Cash
Flow |
386.739,15 |
131.804,31 |
207.629,77 |
317.104,47 |
|
Operating
Cash Flow |
447.758,32 |
210.258,22 |
290.876,74 |
445.208,98 |
|
Change
in Cash Flow |
97,49 |
-27,90 |
-6,34 |
20,62 |
|
PROFITABILITY |
|
|
|
|
|
Economic
Profitability |
15,74 |
0,96 |
1,84 |
4,30 |
|
Financial
Profitability |
37,22 |
2,64 |
6,31 |
12,66 |
|
Financial
Expenses |
1,88 |
0,97 |
1,78 |
3,03 |
|
Gross
Economic Profitability |
19,57 |
6,92 |
9,64 |
13,26 |
|
Gross
Financial Profitability |
46,26 |
18,27 |
27,99 |
49,89 |
|
BALANCE (IN DAYS
OF SALES) |
|
|
|
|
|
Customers’
Credit (In days of sales) |
77,00 |
87,94 |
110,00 |
139,28 |
|
Suppliers’
Credit (In days of sales) |
|
0,00 |
0,00 |
116,61 |
|
Working
Capital (In days of sales) |
106,00 |
7,12 |
31,16 |
109,14 |
|
Working
Capital Requirement (In days of sales) |
103,00 |
7,76 |
43,69 |
114,95 |
|
Treasury
(In days of sales) |
3,00 |
-50,89 |
7,63 |
21,94 |
|
Operating
Current Assets |
160,00 |
158,34 |
200,74 |
252,94 |
|
BALANCE |
|
|
|
|
|
Working
Capital |
902.246,82 |
47.969,54 |
313.368,65 |
948.704,47 |
|
Working
Capital Requirement |
873.187,05 |
71.418,21 |
457.596,06 |
1.160.312,75 |
|
Treasury |
29.059,77 |
-441.958,38 |
57.182,80 |
231.831,94 |
|
Balance
Ratio |
1,97 |
1,06 |
1,42 |
2,27 |
|
SOLVENCY |
|
|
|
|
|
Borrowing
Ratio |
48,64 |
43,73 |
63,06 |
77,67 |
|
Own
/ Permanent Funds |
52,76 |
62,69 |
87,08 |
94,93 |
|
Payback
Capacity |
0,36 |
0,33 |
0,53 |
0,71 |
|
Long
term Indebtedness |
28,82 |
1,41 |
5,94 |
16,96 |
|
Gearing |
236,40 |
177,92 |
270,85 |
448,04 |
|
Financing
Basic Ratio |
1,00 |
1,00 |
1,00 |
1,00 |
|
Assets
Guarantee |
2,06 |
1,24 |
1,56 |
2,17 |
|
LIQUIDITY |
|
|
|
|
|
General
Liquidity |
2,99 |
1,03 |
1,20 |
1,70 |
|
Immediate
Liquidity |
0,06 |
0,03 |
0,07 |
0,23 |
The date when this report was last updated
is 23/06/2006.
This company was last displayed
on 16/06/2006, it has been viewed 7 times in the last
quarter and 154 times in total .
RATING EXPLANATIONS
|
RATING |
STATUS |
PROPOSED CREDIT LINE |
|
|
>86 |
Aaa |
Possesses an extremely sound financial
base with the strongest capability for timely payment of interest and
principal sums |
Unlimited |
|
71-85 |
Aa |
Possesses adequate working capital. No
caution needed for credit transaction. It has above average (strong)
capability for payment of interest and principal sums |
Large |
|
56-70 |
A |
Financial & operational base are
regarded healthy. General unfavourable factors will not cause fatal effect.
Satisfactory capability for payment of interest and principal sums |
Fairly Large |
|
41-55 |
Ba |
Overall operation is considered normal.
Capable to meet normal commitments. |
Satisfactory |
|
26-40 |
B |
Unfavourable & favourable factors
carry similar weight in credit consideration. Capability to overcome
financial difficulties seems comparatively below average/normal. |
Small |
|
11-25 |
Ca |
Adverse factors are apparent. Repayment of
interest and principal sums in default or expected to be in default upon
maturity |
Limited with full security |
|
<10 |
C |
Absolute credit risk exists. Caution
needed to be exercised |
Credit not recommended |