
MIRA INFORM REPORT
|
Report Date : |
22nd May 2006 |
IDENTIFICATION DETAILS
|
Name : |
INDUKERN
SA |
|
|
|
|
Registered Office : |
Calle Alta Ribagorna(Pq Empresarial Mas Blau
I, 6 |
|
|
|
|
Date of Incorporation : |
20/07/1962 |
|
|
|
|
Legal Form : |
Joint Stock Company |
|
|
|
|
Line of Business : |
Traders of fuel, minerals and metals |
RATING & COMMENTS
|
MIRA’s Rating : |
A |
RATING
|
STATUS |
PROPOSED CREDIT LINE |
|
|
56-70 |
A |
Financial &
operational base are regarded healthy. General unfavourable factors will not
cause fatal effect. Satisfactory capability for payment of interest and
principal sums |
Fairly Large |
|
Status : |
Good |
|
|
|
|
Payment Behaviour : |
Regular |
|
|
|
|
Litigation : |
Clear |
NAME
INDUKERN SA
TAX NUMBER
A08135055
Identification and Characteristics
|
Tax Number |
A08135055 |
|
NAME |
INDUKERN SA |
|
FORMER NAME |
INDUSTRIAL KERN ESPANOLA SA |
|
BUSINESS ADDRESS |
CALLE ALTA RIBAGORNA(PQ EMPRESARIAL MAS BLAU I, 6 |
|
Postcode |
08820 EL PRAT DE LLOBREGAT (BARCELONA) |
|
FORMER ADDRESS |
CALLE TEODORA LAMADRID 7 11 |
|
Postcode |
08022 BARCELONA (BARCELONA) |
|
URL |
http://www.indukern.es |
|
TELEPHONE |
935069100 |
|
FAX |
935069199 |
|
LEGAL FORM |
JOINT STOCK COMPANY |
|
DATE FOUNDED |
20/07/1962 |
|
CAPITAL |
5.500.495,00 Euros |
|
PAID-UP CAPITAL |
5.500.495,00 Euros |
|
NUMBER OF EMPLOYEES |
123 |
|
BANKS |
B POPULAR.BARCELONA; BSCH; B DE SABADELL; |
|
ACTIVITY |
1632000 - Traders of fuel, minerals and metals |
|
CNAE |
5112 - Agents involved in the sale of fuels, ores, metals
and industrial chemicals |
|
EXPORT COMPANY |
YES |
|
IMPORT COMPANY |
YES |
Synthesis
|
|
||
|
FINANCIAL SITUATION |
||
|
|
|
|
|
PROFITABILITY |
|
5/9 Medium |
|
TREASURY |
|
6/9 Average |
|
BALANCE SHEET |
|
7/9 Good |
|
DEBT |
|
6/9 Medium |
|
INCIDENTS |
||
|
|
|
|
|
COMMITMENTS |
|
9/9 Respected |
|
INCIDENTS |
|
9/9 None or Negligible |
|
PREVIOUS EXPERIENCE |
||
|
|
|
|
|
PREVIOUS EXPERIENCE |
|
8/9 Favourable |
Credit Appraisal
|
CREDIT ACCORDING TO OBJECTIVE DATA (From 0 to 500.000,00 Euros): |
|
FAVOURABLE TOWARDS 499.441,06 Max. |
|
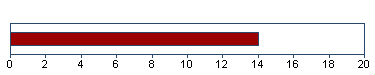
SOLVENCY RATING: |
|
14/20 (BASED ON HOMOGENEOUS FORMULATION) |
|
|
|
|
Financial Elements
Figures given in Euros
|
|
Balance sheet 2.002 (12) |
Balance sheet 2.003 (12) |
Balance sheet 2.004 (12) |
% Sales |
|
SALES |
114.761.637,00 |
134.805.240,00 |
143.919.093,00 |
|
|
ADDED VALUE |
10.385.749,00 |
10.309.862,00 |
11.352.522,00 |
7,89 |
|
BUSINESS RESULT |
2.166.211,00 |
2.210.806,00 |
2.016.578,00 |
1,40 |
|
OWN FUNDS |
19.950.229,00 |
22.161.035,00 |
24.177.613,00 |
|
|
DEBT |
42.439.161,00 |
53.243.774,00 |
65.640.487,00 |
|
|
TOTAL ASSET |
62.914.533,00 |
76.005.012,00 |
90.505.665,00 |
|
|
The sales of 143.919.093,00
Euros show a change of 6,76% compared with
2.003 . Between 2.002 and 2.003 , this
change was 17,47% . |
||||
|
Added value grew by 10,11%
compared with the previous year. Shareholders equity are 24.177.613,00
Euros for an indebtedness of 65.640.487,00
Euros . |
||||
|
The result 2.016.578,00
Euros means financial profitability of 8,34% and
economic profitability of 2,23% . This result means growth of
-8,79% compared with the 2.003 . |
||||
|
|
||||
|
THE FIGURES FOR THE LAST BALANCE SHEET ARE
RELEVANT: |
||||
|
SOURCE: FROM THE MERCANTILE REGISTER |
||||
|
DATE: 11/11/2005 |
||||
|
|
||||
|
Auditors’ opinion: |
||||
|
FAVOURABLE WITH RESERVATIONS (2.004) |
||||
|
|
||||
|
Auditors: |
||||
|
DELOITTE S.L |
||||
Comparative Sector Analysis
|
|
Company |
Sector |
Difference |
|
|
(2.004) |
|
|
|
% of PRODUCTION VALUE |
|
|
|
|
SALES |
99,08 |
92,16 |
6,92 |
|
ADDED VALUE |
7,82 |
9,80 |
-1,98 |
|
BUSINESS RESULT |
1,39 |
1,83 |
-0,44 |
|
% OF TOTAL ASSETS |
|
|
|
|
OWN FUNDS |
26,71 |
36,43 |
-9,72 |
|
DEBT |
72,53 |
63,57 |
8,96 |
Compared sector (CNAE): 511 - Intermediarios del comercio
Number of companies: 25
Size (Sales Figure): > 40.000.000,00 Euros
The turnover of the company is 6,92% above the mean for the
sector.
The company’s added value was 7,82% s/ the production value, and
1,98% below the mean for the sector.
The company’s business result was 1,39% of the PV, 0,44%
below the mean for the sector.
The company’s own resources are 26,71% , 9,72% below the
mean for the sector.
The company’s outside resources are 72,53% , 8,96% above the
mean for the sector.
Legal Actions
|
LEGAL ACTIONS: 1 |
( Last 25/06/2003 ) |
|
|
|
|
|
1 |
|
|
0 |
|
CLAIM FILED AGAINST THE
ADMINISTRATION: 1 |
( Last 22/01/2003 ) |
|
|
1 |
|
|
0 |
|
|
0 |
|
AFFECTED BY: No significant elemento |
|
Last Legal Actions
|
|
|
(Figures given in Euros) |
|
||||||
|
|
||||||
|
|
Information Date |
Claim Type |
Incidence Status |
Actor |
Amount |
|
|
|
25/06/2003 |
LEGAL ACTION FROM 4.808 TO
961.620 EUROS |
LEGAL ACTION FOR 4.808 TO
961.620 EUROS |
IQESIL SA |
15.444,93 |
|
|
Total: 1 |
||||||
|
|
||||||
|
Last claim filed against the administration |
|
|||||
|
(Figures given in Euros) |
|
|||||
|
||||
|
With the Social Security: 1 |
||||
|
|
||||
|
|
Information Date |
Organization |
Amount |
|
|
|
22/01/2003 |
CENTRAL TREASURY FOR SOCIAL SECURITY |
297,56 |
|
|
|
||||
Main Board members, Directors and Auditor
|
Position |
Surname and name |
Date of appointment |
|
CHAIRMAN |
DIAZ VARELA SOMOZA JOSE LUIS |
11/06/2001 |
|
BOARD MEMBER |
VIDAL PACHECO ANTONIO MIGUEL |
18/09/2002 |
|
BOARD MEMBER |
ERNA BERTSCHINGER BARBETTA |
11/06/2001 |
|
BOARD MEMBER |
DIAZ VARELA SOMOZA MIGUEL ANGEL |
11/06/2001 |
|
BOARD MEMBER |
DIAZ VARELA BERTCHINGER DANIEL |
17/09/2002 |
|
BOARD MEMBER |
PETER BIENZ |
29/01/2004 |
|
AUDITOR |
ARTHUR ANDERSEN Y CIA S COM |
29/07/2002 |
Financial Links
|
Shareholders |
||||
|
Company Name |
CIF/Country |
Percent. |
Source |
Information Date |
|
CORPORACION DIVABE S.L. |
B62850854 |
70,07% |
M.REGISTER |
31/12/2004 |
|
ROSSER HOLDING AG |
SUIZA |
29,93% |
M.REGISTER |
31/12/2004 |
Shareholdings
|
||||
|
Company Name |
CIF/Country |
Percent. |
Source |
Information Date |
|
INDUKERN LUXEMBOURG S.A.R.L |
LUXEMBURGO |
100,00% |
M.REGISTER |
31/12/2004 |
|
INDUKERN HONG KONG LTD |
HONG KONG |
100,00% |
M.REGISTER |
31/12/2004 |
|
INDUKERN CHEMIE, A.G. |
SURINAM |
100,00% |
M.REGISTER |
31/12/2004 |
|
INDUKEN PORTUGAL SL |
PORTUGAL |
100,00% |
M.REGISTER |
31/12/2004 |
|
INDUKERN CHEMIE GMBH |
ALEMANIA |
100,00% |
M.REGISTER |
31/12/2004 |
|
INMOBILIARIA LEMOS SL |
B08871717 |
100,00% |
M.REGISTER |
31/12/2004 |
Proceedings published in the B.O.R.M.E. (Official Mercantile Register Gazette)
|
Proceedings |
Date |
Notice Num. |
Mercantile Reg. |
|
Capital decrease |
30/01/2006 |
047116 |
BARCELONA |
|
Partial division |
30/01/2006 |
047116 |
BARCELONA |
|
Registration of accounts (2004) |
31/10/2005 |
814843 |
BARCELONA |
|
Registration of accounts (2004) Consolidated |
31/10/2005 |
809788 |
BARCELONA |
|
Resignations |
24/08/2005 |
370928 |
BARCELONA |
Press articles
|
|
||
|
28/09/2005 |
EL P. CATALUNYA |
LEGAL ANNOUNCE |
|
LAS JUNTAS DE INDUKERN SA (SDAD. ESCINDIDA PARCIALMENTE), LABORATORIOS
CA LIER SA (SDAD. BENEFICIARIA DE ESCISION PARCIAL Y ESCINDIDA PARCIALMENTE)
Y KERN PHARMA SL (ESCISION PARCIAL, SIMULTANEA ESCISION PARCIAL Y FUSION IM
PROPIA INVERSA POR ABSORCION), CELEBRADAS EL 30/06/05, ACORDARON LA ESCISION
PARCIAL DE INDUKERN SA EN BENEFICIO DE LABORATORIOS CALIER SA. SUBSIGUIENTE
ESCISION PARCIAL DE LABORATORIOS CALIER SA EN BENEFICIO DE UNA SDAD. DE NUE
VA CONSTITUCION, DIVABE PROYECTOS BASICOS SL (BENEFICIARIA ESCISION PARCIAL Y
SDAD. ABSORBIDA). SUBSIGUIENTE FUSION POR ABSORCION DE DIVABE PROYECTOS
BASICOS SL POR PARTE DE KERN PHARMA SL. |
||
|
|
||
|
08/06/2004 |
EXPANSIÓN |
GENERAL INFORMATION |
|
INDUKERN HA ADQUIRIDO LA DIVISION DE NUTRICION ANIMAL DE BAYER EN
ESPAÑA Y PORTUGAL, UNIDAD DE NEGOCIO DEPENDIENTE DE LA FILIAL QUIMICA
FARMACEUTICA BAYER QUE EN 2003 FACTURO 9,5 MM. DE EUROS. LA CIA. ELABORA COMPLEMENTOS
PA RA LA ELABORACION DE PIENSOS PARA ANIMALES DE ENGORDE, COMERCIALIZADOS CON
LAS MARCAS BAYMIX Y BAYKAPHOS, ENTRE OTRAS. BAYER HA TRASPASADO LAS MARCAS A
INDUKERN, QUE PREVE MANTENERLAS, AUNQUE INCORPORARA EL LOGO DE LA CIA. BAYER
TENIA SUBCONTRATADA LA PRODUCCION DE ESTOS PRODUCTOS CON LA CIA. PRODIBANA E
INDUKERN MANTENDRA DURANTE UN TIEMPO ESTE CONTRATO. EL GRUPO INDUKERN ALCAN
ZO UNAS VENTAS CONSOLIDADAS DE 295 MM. DE EUROS DURANTE 2003. |
||
Complementary Information
|
Por causas ajenas a nuestra voluntad el deposito de cuentas del |
|
ejercicio 2002 se ha recibido erroneamente, teniendo disponible el |
|
deposito consolidado. |
|
26/3/04 BLOQUE DE INVESTIGACION: |
|
- Establecimientos: |
|
* Domicilio Social: Pq Empresarial Mas Blau II Cl Alta Ribagorza, |
|
6-8 en El Prat de Llobregat (Barcelona). El local es de su propie- |
|
dad. (sin verificacion registral). |
|
* Centro de Actividad: Ps de la Castellana, 156 (Madrid). Cuenta con |
|
una superficie aproximada de 350 m2. y es de su propiedad. (sin |
|
verificacion registral). |
|
- Su ambito de actuacion es internacional. |
|
- Su principal proveedor es la firma: “EUROLYSINE” (Francia). |
|
- Realiza transacciones intracomunitarias de sus compras y sus ventas |
|
- Realiza operaciones de importacion con China y Sudamerica. Y de ex- |
|
portacion con Asia y America. |
|
---------------------------------------------------------------------- |
|
El Bloque de Investigacion no esta sujeto a actualizaciones sistemati- |
|
cas.Los datos mostrados fueron aportados por las fuentes consultadas |
|
en la fecha del encabezamiento. |
Remarks for customer
The address included in your enquiry belongs to a branch
Brands, Signs and Commercial Names
|
Prevailing Brands |
|||||
|
Name: |
KERNVIT |
||||
|
Kind of Brand: |
DENOMINATIVE |
File: |
M2567642 |
||
|
Request Date: |
18/11/2003 |
Bulletin Date: |
Bulletin Date: |
Current situation: |
APPROVED REGISTER |
|
Types: 31 |
|
||||
|
Name: |
GELKERN |
||||
|
Kind of Brand: |
DENOMINATIVE |
File: |
M2207429 |
||
|
Request Date: |
14/01/1999 |
Bulletin Date: |
Bulletin Date: |
Current situation: |
APPROVED REGISTER |
|
Types: 1 |
|
||||
Total Marcas: 2
The information on the last account contained in this report is
extracted from the Mercantile Register file of the legal address of the Company
and dated 11/11/2005
Balance Sheet (ASSETS)
|
(Figures given in Euros) |
31/12/2002 (12) |
31/12/2003 (12) |
31/12/2004 (12) |
|
|
|
A) DUE FROM SHAREHOLDERS FOR UNCALLED
CAPITAL |
|
|
|
|
|
B) FIXED ASSETS |
14.964.692,00 |
18.356.953,00 |
26.977.365,00 |
|
|
I. Establishment expenses |
|
|
|
|
|
II. Intangible assets |
616.696,00 |
968.936,00 |
834.128,00 |
|
|
Concessions, patents,licences , trademarks |
14.809,00 |
15.169,00 |
69.621,00 |
|
|
Goodwill |
|
542.723,00 |
542.723,00 |
|
|
Software |
413.920,00 |
466.066,00 |
479.040,00 |
|
|
Leasing |
534.164,00 |
471.746,00 |
418.894,00 |
|
|
Amortization |
-346.197,00 |
-526.768,00 |
-676.150,00 |
|
|
III. Tangible assets |
2.183.108,00 |
4.028.774,00 |
3.723.579,00 |
|
|
Property, plant and equipment |
1.065.895,00 |
1.839.366,00 |
1.932.839,00 |
|
|
Machinery, equipment and other |
604.465,00 |
2.354.472,00 |
2.652.504,00 |
|
|
Other property plant and equipement |
72.283,00 |
121.603,00 |
126.113,00 |
|
|
Prepaid expenses on fixed assets |
346.638,00 |
|
|
|
|
Other assets |
496.426,00 |
705.183,00 |
604.806,00 |
|
|
Depreciation |
-402.599,00 |
-991.850,00 |
-1.592.683,00 |
|
|
IV. Financial assets |
12.164.888,00 |
13.359.243,00 |
22.419.658,00 |
|
|
Shares in affiliated companies |
8.230.865,00 |
8.346.623,00 |
18.307.787,00 |
|
|
Loans to affiliated companies |
|
1.210.447,00 |
1.202.024,00 |
|
|
Shares in associated companies |
3.897.856,00 |
3.473.043,00 |
1.583.451,00 |
|
|
Securities |
|
|
302.327,00 |
|
|
Other loans |
223.961,00 |
655.193,00 |
1.352.392,00 |
|
|
Long term deposits and guarantees |
42.075,00 |
57.663,00 |
55.403,00 |
|
|
Provisions |
-229.869,00 |
-383.726,00 |
-383.726,00 |
|
|
V. Owners equity |
|
|
|
|
|
VI. Long term trade liabilities |
|
|
|
|
|
C) DEFERRED EXPENSES |
67.749,00 |
41.270,00 |
25.890,00 |
|
|
D) CURRENT ASSETS |
47.882.092,00 |
57.606.789,00 |
63.502.410,00 |
|
|
I. Not paid in shareholder capital |
|
|
|
|
|
II. Inventory |
6.894.361,00 |
11.991.770,00 |
14.814.256,00 |
|
|
Goods available for sale |
6.468.829,00 |
11.356.977,00 |
14.552.127,00 |
|
|
Raw material inventory |
|
166.031,00 |
168.465,00 |
|
|
Finished goods |
510.332,00 |
588.762,00 |
231.218,00 |
|
|
Provisions |
-84.800,00 |
-120.000,00 |
-137.554,00 |
|
|
III. Debtors |
34.662.623,00 |
41.622.874,00 |
46.775.777,00 |
|
|
Clients |
30.131.905,00 |
37.027.278,00 |
39.693.661,00 |
|
|
Amounts owned by affiliated companies |
5.890.905,00 |
4.542.261,00 |
5.954.161,00 |
|
|
Amounts owned by associated companies |
1.853,00 |
404.554,00 |
631.956,00 |
|
|
Other debts |
602.973,00 |
377.824,00 |
487.845,00 |
|
|
Labor costs |
156.709,00 |
145.982,00 |
216.778,00 |
|
|
Taxes refunds |
49.894,00 |
335.273,00 |
1.061.479,00 |
|
|
Provisions |
-2.171.616,00 |
-1.210.298,00 |
-1.270.103,00 |
|
|
IV. Short term financial assets |
4.304.758,00 |
1.801.819,00 |
190.486,00 |
|
|
Receivables in affiliated companies |
2.241.111,00 |
36.684,00 |
7.955,00 |
|
|
Short term investment |
2.063.647,00 |
1.765.135,00 |
182.531,00 |
|
|
V. Short term owners equity |
|
|
|
|
|
VI. Cash |
1.964.503,00 |
2.017.809,00 |
1.568.872,00 |
|
|
VII. Prepaid expenses and accrued income |
55.847,00 |
172.517,00 |
153.019,00 |
|
|
ASSETS (A + B + C + D) |
62.914.533,00 |
76.005.012,00 |
90.505.665,00 |
Balance Sheet (LIABILITIES)
|
(Figures given in Euros) |
31/12/2002 (12) |
31/12/2003 (12) |
31/12/2004 (12) |
|
|
|
A) SHAREHOLDERS EQUITY |
19.950.229,00 |
22.161.035,00 |
24.177.613,00 |
|
|
I. Capital |
6.010.157,00 |
6.010.157,00 |
6.010.157,00 |
|
|
II. Premium share account |
269.253,00 |
269.253,00 |
269.253,00 |
|
|
III. Revaluation reserve |
|
|
|
|
|
IV. Reserves |
11.504.608,00 |
13.670.819,00 |
15.881.625,00 |
|
|
Retained earnings |
1.202.024,00 |
1.202.024,00 |
1.202.024,00 |
|
|
Other funds |
10.302.584,00 |
12.468.795,00 |
14.679.601,00 |
|
|
V. Prior year earnings |
|
|
|
|
|
VI. Prior year profit or losses |
2.166.211,00 |
2.210.806,00 |
2.016.578,00 |
|
|
VII. Dividend paid during the year |
|
|
|
|
|
VIII. Own shares for change in capital |
|
|
|
|
|
B) DEFERRED INCOME |
116.458,00 |
155.458,00 |
142.820,00 |
|
|
Capital grants |
116.458,00 |
116.458,00 |
116.458,00 |
|
|
Other deferred income |
|
39.000,00 |
26.362,00 |
|
|
C) PROVISIONS FOR LIABILITIES AND EXPENSES |
408.685,00 |
444.745,00 |
544.745,00 |
|
|
Other provisions |
408.685,00 |
444.745,00 |
544.745,00 |
|
|
D) LONG TERM LIABILITIES |
1.009.627,00 |
2.055.869,00 |
6.419.281,00 |
|
|
I. Bonds |
|
|
|
|
|
II. Bank loans |
284.780,00 |
1.740.009,00 |
3.679.169,00 |
|
|
Long term bank loans |
|
1.580.987,00 |
3.621.759,00 |
|
|
Leasing |
284.780,00 |
159.022,00 |
57.410,00 |
|
|
III. Debts with associed and affiliated
companies |
|
|
2.502.789,00 |
|
|
Debt with affiliated companies |
|
|
2.502.789,00 |
|
|
IV. Other creditors |
681.178,00 |
282.991,00 |
215.254,00 |
|
|
Other debts |
681.178,00 |
282.991,00 |
215.254,00 |
|
|
V. Deferred debts on shares |
43.669,00 |
32.869,00 |
22.069,00 |
|
|
Affiliated companies |
43.669,00 |
32.869,00 |
|
|
|
Associated companies |
|
|
22.069,00 |
|
|
VI. Long term debt with creditor |
|
|
|
|
|
E) SHORT TERM LIABILITIES |
41.429.534,00 |
51.187.905,00 |
59.221.206,00 |
|
|
I. Negotiable bonds |
|
|
|
|
|
II. Bank loans |
23.230.658,00 |
25.722.945,00 |
30.287.694,00 |
|
|
Loans and other debts |
22.981.645,00 |
25.514.107,00 |
30.075.097,00 |
|
|
Debt interest |
108.387,00 |
72.923,00 |
105.690,00 |
|
|
Leasing |
140.626,00 |
135.915,00 |
106.907,00 |
|
|
III. Short term debts with associated and
affiliated companies |
499.628,00 |
371.679,00 |
332.307,00 |
|
|
With affiliated companies |
320.311,00 |
338.471,00 |
52.687,00 |
|
|
Associeted companies |
179.317,00 |
33.208,00 |
279.620,00 |
|
|
IV. Trade creditors |
15.883.361,00 |
23.230.800,00 |
25.418.084,00 |
|
|
Expenses |
15.883.361,00 |
23.230.800,00 |
25.418.084,00 |
|
|
V. Other non trade payables |
1.815.887,00 |
1.862.481,00 |
3.183.121,00 |
|
|
Government |
591.644,00 |
1.087.855,00 |
1.735.953,00 |
|
|
Other debts |
736.172,00 |
308.537,00 |
846.187,00 |
|
|
Accounts receivable |
488.071,00 |
466.089,00 |
600.981,00 |
|
|
VI. Provisions for current assets |
|
|
|
|
|
VII. Accruals and deferred incomes |
|
|
|
|
|
F) SHORT TERM PROVISIONS FOR LIABILITIES AND
EXPENSES |
|
|
|
|
|
LIABILITIES (A + B + C + D + E + F) |
62.914.533,00 |
76.005.012,00 |
90.505.665,00 |
Profit and Loss Account
|
(Figures given in Euros) |
31/12/2002 (12) |
31/12/2003 (12) |
31/12/2004 (12) |
|
|
|
A) EXPENSES (A.1 a A.16) |
|
|
|
|
|
A.1. Change in stocks of finished goods and work in
progress |
|
4.975.749,00 |
357.544,00 |
|
|
A.2. Supplies |
97.921.194,00 |
110.950.257,00 |
123.255.831,00 |
|
|
Material consumed |
97.921.194,00 |
110.950.257,00 |
123.255.831,00 |
|
|
A.3. Labor cost |
4.295.887,00 |
5.605.980,00 |
6.555.491,00 |
|
|
Wages |
3.704.535,00 |
4.729.964,00 |
5.550.761,00 |
|
|
Social security expenses |
591.352,00 |
876.016,00 |
1.004.730,00 |
|
|
A.4. Assets depreciation |
345.366,00 |
802.861,00 |
879.625,00 |
|
|
A.5 Variance in provision for current assets |
366.927,00 |
44.316,00 |
77.359,00 |
|
|
Variance in provision for inventory |
19.277,00 |
35.200,00 |
17.554,00 |
|
|
Variance in provision for bad debts |
347.650,00 |
9.116,00 |
59.805,00 |
|
|
A.6. Other operating costs |
7.211.248,00 |
9.170.306,00 |
10.292.250,00 |
|
|
External costs |
6.501.181,00 |
8.583.875,00 |
9.621.952,00 |
|
|
Taxes |
43.426,00 |
46.361,00 |
62.046,00 |
|
|
Other day to day expenses |
666.641,00 |
540.070,00 |
608.252,00 |
|
|
A.I. OPERATING RESULT
(B.1+B.2+B.3+B.4-A.1-A.2-A.3-A.4-A.5-A.6) |
5.377.569,00 |
3.856.705,00 |
3.840.047,00 |
|
|
A.7. Financial expenses |
1.153.210,00 |
676.206,00 |
998.634,00 |
|
|
Debts with related companies |
448.523,00 |
464.859,00 |
578.523,00 |
|
|
Other companies debts |
704.687,00 |
211.347,00 |
383.427,00 |
|
|
Losses from financial investments |
|
|
36.684,00 |
|
|
A.8. Variation in financial investments provision |
|
|
|
|
|
A.9. Exchange losses |
5.830.546,00 |
9.820.623,00 |
5.367.934,00 |
|
|
A.II. POSITIVE FINANCIAL RESULTS
(B.5+B.6+B.7+B.8-A.7-A.8-A.9) |
|
|
|
|
|
A.III. PROFIT FROM ORDINARY ACTIVITIES
(A.I+A.II-B.I-B.II) |
4.735.077,00 |
3.425.645,00 |
3.016.540,00 |
|
|
A.10. Variation in provision in fixed assets |
4.574,00 |
153.857,00 |
|
|
|
A.11. Losses in fixed assets |
387.821,00 |
7.431,00 |
27.052,00 |
|
|
A.12. Losses from shares and bonds |
|
|
|
|
|
A.13. Extraordinary charges |
992.647,00 |
35.331,00 |
124.295,00 |
|
|
A.14. Prior year’s expenses and losses |
|
|
|
|
|
A.IV. POSITIVE EXTRAORDINARY RESULT
(B.9+B.10+B.11+B.12+B.13-A.10-A.11-A.12-A.13-A.14) |
|
10.002,00 |
127.231,00 |
|
|
A.V. EARNINGS / LOSS BEFORE TAXES
(A.III+A.IV-B.III-B.IV) |
3.413.537,00 |
3.435.647,00 |
3.143.771,00 |
|
|
A.15. Corporate Taxes |
1.247.326,00 |
1.224.841,00 |
1.127.193,00 |
|
|
A.16. Other taxes |
|
|
|
|
|
A.VI. YEAR END RESULT (PROFIT)
(A.V-A.15-A.16) |
2.166.211,00 |
2.210.806,00 |
2.016.578,00 |
|
|
B) INCOMES (B.1 a B13) |
|
|
|
|
|
B.1. Turnover |
114.761.637,00 |
134.805.240,00 |
143.919.093,00 |
|
|
Sales |
114.761.637,00 |
134.805.240,00 |
143.919.093,00 |
|
|
B.2. Increase in inventory of finished goods |
65.313,00 |
|
|
|
|
B.3. Expenses capitalized |
|
|
|
|
|
B.4. Other operating income |
691.241,00 |
600.934,00 |
1.339.054,00 |
|
|
Other incomes |
691.241,00 |
600.934,00 |
1.339.054,00 |
|
|
B.I. OPERATING LOSSES (A.1+A.2+A.3+A.4+A.5+A.6-B.1-B.2-B.3-B.4) |
|
|
|
|
|
B.5. Incomes from share |
76.561,00 |
265.924,00 |
70.183,00 |
|
|
From affiliated companies |
76.561,00 |
265.924,00 |
68.632,00 |
|
|
From associated companies |
|
|
1.551,00 |
|
|
B.6. Income from securities |
|
|
|
|
|
B.7. Other income from interrest |
483.442,00 |
142.488,00 |
119.548,00 |
|
|
From other companies |
483.442,00 |
142.488,00 |
119.548,00 |
|
|
B.8. Gains on exchange |
5.781.261,00 |
9.657.357,00 |
5.353.330,00 |
|
|
B.II. FINANCIAL LOSSES
(A.7+A.8+A.9-B.5-B.6-B.7-B.8) |
642.492,00 |
431.060,00 |
823.507,00 |
|
|
B.III. LOSSES FROM ORDINARY ACTIVITIES
(B.I+B.II-A.I-A.II) |
|
|
|
|
|
B.9. Gains from disposal of fixed assets |
5.310,00 |
137.317,00 |
6.854,00 |
|
|
B.10. Gains from dealing in own shares |
|
|
|
|
|
B.11. Paid in surplus |
|
|
|
|
|
B.12. Extraordinary income |
58.192,00 |
69.304,00 |
271.724,00 |
|
|
B.13. Prior year’s income and profits |
|
|
|
|
|
B.IV. EXTRAORDINARY LOSSES
(A.10+A.11+A.12+A.13+A.14-B.9-B.10-B.11-B.12-B.13) |
1.321.540,00 |
|
|
|
|
B.V. LOSS BEFORE TAXES
(B.III+B.IV-A.III-A.IV) |
|
|
|
|
|
B.VI. NET LOSS (B.V+A.15+A.16) |
|
|
|
Main Ratios
|
(Figures given in Euros) |
2.002 (12) |
2.003 (12) |
2.004 (12) |
|
|
|
ACTIVITY |
|
|
|
|
|
Increase of the Sales Figures |
|
17,47 |
6,76 |
|
|
Assets Turnover |
1,82 |
1,77 |
1,59 |
|
|
Productivity |
2,42 |
1,84 |
1,73 |
|
|
Increase of the Added Value |
|
-0,73 |
10,11 |
|
|
PROFITABILITY |
|
|
|
|
|
Economic Profitability |
3,44 |
2,91 |
2,23 |
|
|
Financial Profitability |
10,86 |
9,98 |
8,34 |
|
|
Financial Expenses |
1,00 |
0,50 |
0,69 |
|
|
BALANCE (IN DAYS OF SALES) |
|
|
|
|
|
Customers’ Credit (In days of sales) |
109,00 |
111,00 |
117,00 |
|
|
Suppliers’ Credit (In days of sales) |
58,00 |
72,00 |
74,00 |
|
|
Working Capital (In days of sales) |
20,00 |
17,00 |
11,00 |
|
|
Working Capital Requirement (In days of sales) |
73,00 |
76,00 |
82,00 |
|
|
Treasury (In days of sales) |
0,00 |
0,00 |
0,00 |
|
|
BALANCE |
|
|
|
|
|
Working Capital |
6.452.558,00 |
6.418.884,00 |
4.281.204,00 |
|
|
Working Capital Requirement |
23.413.955,00 |
28.322.201,00 |
32.809.540,00 |
|
|
Treasury |
-16.961.397,00 |
-21.903.317,00 |
-28.528.336,00 |
|
|
Balance Ratio |
1,43 |
1,35 |
1,16 |
|
|
SOLVENCY |
|
|
|
|
|
Borrowing Ratio |
67,46 |
70,05 |
72,53 |
|
|
Own / Permanent Funds |
92,86 |
89,30 |
77,28 |
|
|
Payback Capacity |
0,37 |
0,39 |
0,45 |
|
|
LIQUIDITY |
|
|
|
|
|
General Liquidity |
1,16 |
1,13 |
1,07 |
|
|
Immediate Liquidity |
0,15 |
0,08 |
0,03 |
Sectorial Analysis
Summary of Assets, Liability & Equity
|
(Figures given in Percentages) |
Company |
Sector |
Company |
|
|
2.004 |
|
|
|
Assets |
|||
|
DUE FROM SHAREHOLDERS FOR UNCALLED CAPITAL |
0,00 |
0,14 |
-0,14 |
|
FIXED ASSETS |
29,81 |
22,93 |
6,88 |
|
ACCRUED EXPENSES |
0,03 |
0,03 |
-0,00 |
|
CURRENT ASSETS |
70,16 |
76,90 |
-6,74 |
|
TOTAL ASSETS |
100,00 |
100,00 |
0,00 |
|
Liabilities |
|||
|
SHAREHOLDERS EQUITY |
26,71 |
36,43 |
-9,72 |
|
ACCRUED INCOME |
0,16 |
0,43 |
-0,27 |
|
RISK AND EXPENDITURE COVER |
0,60 |
0,53 |
0,07 |
|
LONG-TERM CREDITORS |
7,09 |
6,65 |
0,44 |
|
SHORT-TERM CREDITORS |
65,43 |
55,95 |
9,48 |
|
SHORT-TERM RISK AND EXPENDITURE COVER |
0,00 |
0,00 |
0,00 |
|
TOTAL LIABILITIES |
100,00 |
100,00 |
0,00 |
Analytical Account of Results
|
(Figures given in Percentages) |
Company |
Sector |
Company |
|
|
2.004 |
|
|
|
Net turnover |
99,08 |
92,16 |
6,91 |
|
Other operating income |
0,92 |
7,84 |
-6,91 |
|
Production Value |
100,00 |
100,00 |
0,00 |
|
Operating expenses |
85,10 |
81,31 |
3,79 |
|
Other operation expenses |
7,09 |
8,89 |
-1,80 |
|
Added value |
7,82 |
9,80 |
-1,99 |
|
Labor cost |
4,51 |
6,69 |
-2,18 |
|
Gross Economic Result |
3,30 |
3,11 |
0,19 |
|
Assets depreciation |
0,61 |
0,55 |
0,05 |
|
Variation in provision for current assets |
0,05 |
0,08 |
-0,03 |
|
Net Economic Result |
2,64 |
2,48 |
0,17 |
|
Financial income |
3,82 |
0,98 |
2,84 |
|
Financial expenses |
4,38 |
0,67 |
3,71 |
|
Variation in financial investment provision |
0,00 |
-0,00 |
0,00 |
|
Ordinary Activities Result |
2,08 |
2,78 |
-0,71 |
|
Extraordinary income |
0,19 |
0,14 |
0,05 |
|
Extraordinary expenses |
0,10 |
0,21 |
-0,11 |
|
Variation in provision in fixed assets |
0,00 |
0,06 |
-0,06 |
|
Results before Taxes |
2,16 |
2,65 |
-0,49 |
|
Corporaye taxes |
0,78 |
0,82 |
-0,04 |
|
Net Result |
1,39 |
1,83 |
-0,45 |
|
Assets depreciation |
0,61 |
0,55 |
0,05 |
|
Provisions fund variation |
0,05 |
0,14 |
-0,09 |
|
Net Self-Financing |
2,05 |
2,52 |
-0,48 |
Ratios
|
(Figures given in ) |
Company |
Ptile25 |
Medium |
Ptile75 |
|
|
2.004 |
|
|
|
|
ACTIVITY |
|
|
|
|
|
Increase of the Sales Figures |
6,76 |
-0,71 |
8,07 |
17,15 |
|
Assets Turnover |
1,59 |
1,68 |
2,43 |
4,37 |
|
Fixed Assets Turnover |
5,33 |
6,05 |
14,32 |
41,12 |
|
Increase of the Added Value |
10,11 |
-5,78 |
4,22 |
13,80 |
|
PRODUCTIVITY |
|
|
|
|
|
Productivity |
1,73 |
1,27 |
1,54 |
2,05 |
|
Change of Personnel Costs |
16,94 |
3,31 |
6,36 |
16,53 |
|
Average Personnel Costs |
53.296,68 |
23.483,33 |
39.026,42 |
54.876,20 |
|
Value Added by Employees |
92.296,93 |
47.677,19 |
71.728,41 |
90.288,66 |
|
CASH FLOW |
|
|
|
|
|
Cash Flow |
2.973.562,00 |
640.726,45 |
1.384.793,10 |
4.272.052,16 |
|
Operating Cash Flow |
4.797.031,00 |
359.000,00 |
1.641.941,00 |
6.028.705,43 |
|
Change in Cash Flow |
-7,42 |
-16,99 |
5,88 |
23,54 |
|
PROFITABILITY |
|
|
|
|
|
Economic Profitability |
2,23 |
0,54 |
2,98 |
5,18 |
|
Financial Profitability |
8,34 |
3,62 |
11,50 |
23,41 |
|
Financial Expenses |
0,69 |
0,00 |
0,18 |
0,63 |
|
Gross Economic Profitability |
5,30 |
2,93 |
5,82 |
10,73 |
|
Gross Financial Profitability |
19,84 |
8,94 |
24,12 |
46,48 |
|
BALANCE (IN DAYS OF SALES) |
|
|
|
|
|
Customers’ Credit (In days of sales) |
117,00 |
31,27 |
89,06 |
122,48 |
|
Suppliers’ Credit (In days of sales) |
74,00 |
20,10 |
44,18 |
74,58 |
|
Working Capital (In days of sales) |
10,00 |
3,41 |
15,23 |
42,90 |
|
Working Capital Requirement (In days of sales) |
82,00 |
-2,67 |
3,61 |
52,20 |
|
Treasury (In days of sales) |
0,00 |
-21,60 |
0,12 |
27,96 |
|
Operating Current Assets |
158,00 |
56,15 |
115,87 |
164,68 |
|
BALANCE |
|
|
|
|
|
Working Capital |
4.281.204,00 |
595.301,15 |
5.134.100,59 |
7.231.175,51 |
|
Working Capital Requirement |
32.809.540,00 |
-409.014,89 |
1.322.296,00 |
8.232.510,52 |
|
Treasury |
-28.528.336,00 |
-3.606.869,36 |
57.000,00 |
5.224.609,63 |
|
Balance Ratio |
1,16 |
1,17 |
1,51 |
3,15 |
|
SOLVENCY |
|
|
|
|
|
Borrowing Ratio |
72,53 |
55,52 |
75,08 |
82,86 |
|
Own / Permanent Funds |
77,28 |
89,86 |
97,21 |
99,92 |
|
Payback Capacity |
0,45 |
0,18 |
0,27 |
0,43 |
|
Long term Indebtedness |
7,09 |
0,00 |
0,30 |
2,53 |
|
Gearing |
374,34 |
224,80 |
401,27 |
593,59 |
|
Financing Basic Ratio |
1,00 |
1,00 |
1,00 |
1,00 |
|
Assets Guarantee |
1,38 |
1,11 |
1,33 |
1,67 |
|
LIQUIDITY |
|
|
|
|
|
General Liquidity |
1,07 |
1,04 |
1,20 |
1,45 |
|
Immediate Liquidity |
0,03 |
0,02 |
0,07 |
0,35 |
The date when this report
was last updated is 05/05/2006.
This company was last
displayed on 19/05/2006, it has been viewed 76 times in the
last quarter and 994 times in total .
RATING EXPLANATIONS
RATING
|
STATUS |
PROPOSED CREDIT LINE |
|
|
>86 |
Aaa |
Possesses an extremely
sound financial base with the strongest capability for timely payment of
interest and principal sums |
Unlimited |
|
71-85 |
Aa |
Possesses adequate
working capital. No caution needed for credit transaction. It has above
average (strong) capability for payment of interest and principal sums |
Large |
|
56-70 |
A |
Financial &
operational base are regarded healthy. General unfavourable factors will not
cause fatal effect. Satisfactory capability for payment of interest and
principal sums |
Fairly Large |
|
41-55 |
Ba |
Overall operation is
considered normal. Capable to meet normal commitments. |
Satisfactory |
|
26-40 |
B |
Unfavourable &
favourable factors carry similar weight in credit consideration. Capability
to overcome financial difficulties seems comparatively below average/normal. |
Small |
|
11-25 |
Ca |
Adverse factors are
apparent. Repayment of interest and principal sums in default or expected to
be in default upon maturity |
Limited with full
security |
|
<10 |
C |
Absolute credit risk
exists. Caution needed to be exercised |
Credit not recommended |