
MIRA
INFORM REPORT
|
Report Date : |
9th
November, 2006 |
IDENTIFICATION
DETAILS
|
Name : |
CONGEFISH
IMPORT SA |
|
|
|
|
Registered Office : |
Calle Longitudinal
Seis (Mercabarna), 37, 08040 , Barcelona (Barcelona) |
|
|
|
|
Country : |
Spain |
|
|
|
|
Financials (as on) : |
31.12.2005 |
|
|
|
|
Date of Incorporation : |
04.12.2002 |
|
|
|
|
Legal Form : |
Joint Stock Company |
|
|
|
|
Line of Business : |
Wholesale of fish, other food, including fish, crustaceans and
molluscs |
RATING & COMMENTS
|
MIRA’s Rating : |
Ba |
|
RATING |
STATUS |
PROPOSED CREDIT LINE |
|
|
41-55 |
Ba |
Overall operation is considered normal.
Capable to meet normal commitments. |
Satisfactory |
|
Status : |
Good |
|
|
|
|
Payment Behaviour : |
Regular
|
|
|
|
|
Litigation : |
Clear |
Company Name
CONGEFISH
IMPORT SA.
TAX NUMBER
A63035901
Identification and Characteristics
Tax Number A63035901
NAME CONGEFISH
IMPORT SA.
FORMER NAME CONGEFISH
IMPORT SA.
BUSINESS ADDRESS CALLE
LONGITUDINAL SEIS (MERCABARNA), 37
Postcode 08040
BARCELONA (BARCELONA)
FORMER ADDRESS POLIGONO
IND SUNYER 4 6. C/ AUGUST
Postcode 08034
BARCELONA (BARCELONA)
URL http://www.congefish.com
TELEPHONE 932627102
FAX 932627103
LEGAL FORM JOINT
STOCK COMPANY
DATE FOUNDED 04/12/2002
CAPITAL 60.300,00 Euros
PAID-UP CAPITAL 60.300,00 Euros
NUMBER OF EMPLOYEES 8
BANKS BSCH;
CAIXA CATALUNYA; CAIXA SABADELL OF 0313;
BANCAJA;
ACTIVITY 1612800 - Wholesale
of fish,
CNAE 5138 - Wholesale
of other food, including fish, crustaceans and
molluscs
EXPORT COMPANY YES
IMPORT COMPANY YES
Synthesis
FINANCIAL SITUATION (Year ending: 31/12/2005)
![]()
PROFITABILITY ![]() 4/9 Nil
4/9 Nil
TREASURY ![]() 6/9 Average
6/9 Average
BALANCE SHEET ![]() 9/9 Excellent
9/9 Excellent
DEBT ![]() 4/9 Heavy
4/9 Heavy
INCIDENTS
![]()
COMMITMENTS ![]() 9/9 Respected
9/9 Respected
INCIDENTS ![]() 9/9 None
or Negligible
9/9 None
or Negligible
PREVIOUS EXPERIENCE
![]()
PREVIOUS EXPERIENCE ![]() 7/9 Normal
7/9 Normal
Credit Appraisal
CREDIT ACCORDING TO OBJECTIVE DATA (From 0 to 500.000,00 Euros):
FAVOURABLE TOWARDS 156.864,16 Max.
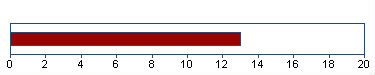
SOLVENCY RATING:
13/20 (BASED ON HOMOGENEOUS FORMULATION)
Financial Elements
Figures
given in Euros
|
|
Balance
sheet 2.003 (12) |
Balance
sheet 2.004 (12) |
Balance
sheet 2.005 (12) |
%
Sales |
|
SALES |
5.803.068,80 |
11.375.087,71 |
16.819.327,19 |
|
|
ADDED VALUE |
257.966,77 |
449.557,33 |
693.272,26 |
4,12 |
|
BUSINESS RESULT |
78.514,23 |
52.768,74 |
96.637,18 |
0,57 |
|
OWN FUNDS |
139.545,55 |
192.314,29 |
288.951,47 |
|
|
DEBT |
2.616.126,58 |
2.191.095,13 |
7.044.894,85 |
|
|
TOTAL ASSET |
2.755.672,13 |
2.383.409,42 |
7.333.846,32 |
|
The
sales of 16.819.327,19 Euros show a change of
47,86% compared with 2.004 . Between 2.003
and 2.004 , this change was 96,02% .
Added
value grew by 54,21% compared with the previous year. Shareholders
equity are 288.951,47 Euros for an indebtedness of
7.044.894,85 Euros .
The
result 96.637,18 Euros means financial profitability of
33,44% and economic profitability of 1,32% . This result
means growth of 83,13% compared with the 2.004 .
THE
FIGURES FOR THE LAST BALANCE SHEET ARE RELEVANT:
SOURCE: FROM
THE MERCANTILE REGISTER
DATE: 22/09/2006
Comparative Sector Analysis
|
|
Company |
Sector |
Difference |
|
|
(2.005) |
|
|
|
%
of PRODUCTION VALUE |
|
|
|
|
SALES |
98,84 |
98,18 |
0,66 |
|
ADDED
VALUE |
4,07 |
10,98 |
-6,91 |
|
BUSINESS
RESULT |
0,57 |
1,59 |
-1,02 |
|
%
OF TOTAL ASSETS |
|
|
|
|
OWN
FUNDS |
3,94 |
35,24 |
-31,30 |
|
DEBT |
96,06 |
64,76 |
31,30 |
Compared sector
(CNAE) : 513 - Comercio al por mayor de productos
alimenticios, bebidas y tabaco
Number of companies :
784
Size (Sales Figure)
: 7.000.000,00 - 40.000.000,00 Euros
The turnover of the
company is 0,66% above the mean for the sector.
The company’s added
value was 4,07% s/ the production value, and 6,91% below the mean
for the sector.
The company’s
business result was 0,57% of the PV, 1,02% below the mean for the
sector.
The company’s own
resources are 3,94% , 31,30% below the mean for the sector.
The company’s
outside resources are 96,06% , 31,30% above the mean for the
sector.
Legal Actions
No legal incidences registered for this company in
the official source
No claims registered for this company in the official
sources
AFFECTED BY: No significant elemento
Main Board members, Directors and
Auditor
|
Position |
Surname and name |
Date
of appointment |
|
SOLE
ADMINISTRATOR |
FONTANET GOMEZ
ALEXIS |
14/02/2003 |
Financial Links
|
Shareholders |
||||
|
Company Name |
|
|
Source |
Information Date |
|
GOMEZ VILLAR
LYDIA |
|
50,00%
|
OWN SOURCES |
13/03/2006 |
|
FONTANET GOMEZ
ALBERTO |
|
25,00%
|
OWN SOURCES |
13/03/2006 |
|
FONTANET GOMEZ
ALEXIS |
|
25,00%
|
OWN SOURCES |
13/03/2006 |
Proceedings published in the
B.O.R.M.E. (Official Mercantile Register Gazette)
|
Proceedings |
Date |
Notice
Num. |
Mercantile
Reg. |
|
Registration of
accounts (2005) |
22/09/2006 |
529751 |
BARCELONA |
|
Registration of
accounts (2004) |
28/09/2005 |
563099 |
BARCELONA |
|
Registration of
accounts (2003) |
22/12/2004 |
950865 |
BARCELONA |
|
Change of name |
09/12/2003 |
471198 |
BARCELONA |
|
Change of adress |
09/12/2003 |
471198 |
BARCELONA |
Complementary Information
El balance cerrado a 31/12/2002 (Deposito 02 y 03) esta disponible en
INFORMA, pero no ha sido cargado por tener una duracion inferior a
tres meses.
08/11/06 BLOQUE DE INVESTIGACION:
- Local en concesion administrativa de 45 m2.
- Realizan transacciones intracomunitarias de venta e importa de Su-
dafrica, Argentina e India.
----------------------------------------------------------------------
El Bloque de Investigacion no esta sujeto a actualizaciones sistemati-
cas.Los datos mostrados fueron aportados por las fuentes consultadas
en la fecha del encabezamiento.
Brands, Signs and Commercial
Names
|
Prevailing Brands |
|||||
|
Name: |
CONGEFISH |
||||
|
Kind
of Brand: |
JOINT |
File: |
M2558528 |
||
|
Request
Date: |
22/09/2003 |
Bulletin
Date: |
Bulletin
Date: |
Current
situation: |
APPROVED
REGISTER |
|
Types:
35 |
|
||||
Total
Marcas: 1
The information on the last account
contained in this report is extracted from the Mercantile Register file of the
legal address of the Company and dated 22/09/2006
Balance Sheet (ASSETS)
|
(Figures given in
Euros) |
31/12/2003 (12)
|
31/12/2004 (12)
|
31/12/2005 (12)
|
|
|
|
A) DUE FROM
SHAREHOLDERS FOR UNCALLED CAPITAL |
30.148,00 |
30.148,00 |
|
|
|
B) FIXED ASSETS |
73.840,06 |
91.043,21 |
103.805,28 |
|
|
I. Establishment
expenses |
3.661,18 |
2.715,74 |
1.770,30 |
|
|
II. Intangible
assets |
27.795,03 |
38.491,44 |
51.114,21 |
|
|
Concessions,
patents,licences , trademarks |
984,37 |
1.266,37 |
1.266,37 |
|
|
Software |
27.309,78 |
44.740,38 |
64.479,34 |
|
|
Amortization |
-499,12 |
-7.515,31 |
-14.631,50 |
|
|
III. Tangible
assets |
39.353,80 |
41.556,54 |
42.881,18 |
|
|
Other property
plant and equipement |
3.865,20 |
13.202,12 |
13.777,12 |
|
|
Other assets |
40.629,82 |
44.988,80 |
57.343,60 |
|
|
Depreciation |
-5.141,22 |
-16.634,38 |
-28.239,54 |
|
|
IV. Financial
assets |
3.030,05 |
8.279,49 |
8.039,59 |
|
|
Securities |
3.000,00 |
7.242,94 |
7.242,94 |
|
|
Long term
deposits and guarantees |
30,05 |
1.036,55 |
796,65 |
|
|
V. Owners equity |
|
|
|
|
|
VI. Long term
trade liabilities |
|
|
|
|
|
C) DEFERRED
EXPENSES |
|
|
|
|
|
D) CURRENT ASSETS |
2.651.684,07 |
2.262.218,21 |
7.230.041,04 |
|
|
I. Not paid in
shareholder capital |
|
|
|
|
|
II. Inventory |
315.992,78 |
977.279,60 |
1.618.207,62 |
|
|
Goods available
for sale |
303.992,78 |
965.279,60 |
977.083,59 |
|
|
Cash advance |
12.000,00 |
12.000,00 |
641.124,03 |
|
|
III. Debtors |
2.025.578,67 |
1.002.436,07 |
5.320.632,80 |
|
|
Clients |
2.035.516,48 |
905.876,85 |
5.210.373,79 |
|
|
Taxes refunds |
10.248,34 |
105.105,22 |
124.251,01 |
|
|
Provisions |
-20.186,15 |
-8.546,00 |
-13.992,00 |
|
|
IV. Short term
financial assets |
|
132.000,00 |
|
|
|
Other loans |
|
132.000,00 |
|
|
|
V. Short term
owners equity |
|
|
|
|
|
VI. Cash |
310.112,62 |
146.298,62 |
266.055,25 |
|
|
VII. Prepaid
expenses and accrued income |
|
4.203,92 |
25.145,37 |
|
|
ASSETS (A + B + C
+ D) |
2.755.672,13 |
2.383.409,42 |
7.333.846,32 |
Balance Sheet (LIABILITIES)
|
(Figures given in
Euros) |
31/12/2003 (12)
|
31/12/2004 (12)
|
31/12/2005 (12)
|
|
|
|
A) SHAREHOLDERS
EQUITY |
139.545,55 |
192.314,29 |
288.951,47 |
|
|
I. Capital |
60.300,00 |
60.300,00 |
60.300,00 |
|
|
II. Premium share
account |
|
|
|
|
|
III. Revaluation
reserve |
|
|
|
|
|
IV. Reserves |
731,32 |
79.245,55 |
132.014,29 |
|
|
Retained earnings |
|
|
12.060,00 |
|
|
Other funds |
731,32 |
79.245,55 |
119.954,29 |
|
|
V. Prior year
earnings |
|
|
|
|
|
VI. Prior year
profit or losses |
78.514,23 |
52.768,74 |
96.637,18 |
|
|
VII. Dividend
paid during the year |
|
|
|
|
|
VIII. Own shares
for change in capital |
|
|
|
|
|
B) DEFERRED
INCOME |
|
|
|
|
|
C) PROVISIONS FOR
LIABILITIES AND EXPENSES |
|
|
|
|
|
D) LONG TERM
LIABILITIES |
38.800,00 |
33.389,61 |
23.927,48 |
|
|
I. Bonds |
|
|
|
|
|
II. Bank loans |
38.800,00 |
33.389,61 |
23.927,48 |
|
|
Long term bank loans |
38.800,00 |
33.389,61 |
23.927,48 |
|
|
III. Debts with
associed and affiliated companies |
|
|
|
|
|
IV. Other
creditors |
|
|
|
|
|
V. Deferred debts
on shares |
|
|
|
|
|
VI. Long term
debt with creditor |
|
|
|
|
|
E) SHORT TERM
LIABILITIES |
2.577.326,58 |
2.157.705,52 |
7.020.967,37 |
|
|
I. Negotiable
bonds |
|
|
|
|
|
II. Bank loans |
1.523.695,01 |
1.554.525,23 |
4.490.557,17 |
|
|
Loans and other
debts |
1.523.695,01 |
1.554.525,23 |
4.490.557,17 |
|
|
III. Short term
debts with associated and affiliated companies |
|
|
|
|
|
IV. Trade
creditors |
765.925,75 |
382.504,97 |
2.353.828,94 |
|
|
Expenses |
559.397,48 |
|
1.108.370,60 |
|
|
Bills payable |
206.528,27 |
382.504,97 |
1.245.458,34 |
|
|
V. Other non
trade payables |
287.705,82 |
220.675,32 |
176.581,26 |
|
|
Government |
44.863,82 |
30.723,20 |
20.827,60 |
|
|
Other debts |
242.842,00 |
189.952,12 |
155.753,66 |
|
|
VI. Provisions
for current assets |
|
|
|
|
|
VII. Accruals and
deferred incomes |
|
|
|
|
|
F) SHORT TERM
PROVISIONS FOR LIABILITIES AND EXPENSES |
|
|
|
|
|
LIABILITIES (A +
B + C + D + E + F) |
2.755.672,13 |
2.383.409,42 |
7.333.846,32 |
Profit and Loss Account
|
(Figures given in
Euros) |
31/12/2003 (12)
|
31/12/2004 (12)
|
31/12/2005 (12)
|
|
|
|
A) EXPENSES (A.1
a A.16) |
|
|
|
|
|
A.1. Change in
stocks of finished goods and work in progress |
|
|
|
|
|
A.2. Supplies |
5.431.953,30 |
10.419.427,84 |
15.794.856,07 |
|
|
Material consumed |
5.308.933,26 |
10.046.970,50 |
15.406.609,94 |
|
|
Other expenses |
123.020,04 |
372.457,34 |
388.246,13 |
|
|
A.3. Labor cost |
90.219,01 |
297.218,84 |
277.884,99 |
|
|
Wages |
87.070,99 |
273.696,90 |
256.191,08 |
|
|
Social security
expenses |
3.148,02 |
23.521,94 |
21.693,91 |
|
|
A.4. Assets depreciation |
6.585,78 |
19.454,79 |
19.666,79 |
|
|
A.5 Variance in
provision for current assets |
20.186,15 |
8.546,00 |
13.992,00 |
|
|
Variance in
provision for bad debts |
20.186,15 |
8.546,00 |
13.992,00 |
|
|
A.6. Other
operating costs |
189.322,02 |
526.330,81 |
528.143,43 |
|
|
External costs |
189.290,73 |
526.330,81 |
527.659,93 |
|
|
Taxes |
31,29 |
|
483,50 |
|
|
A.I. OPERATING
RESULT (B.1+B.2+B.3+B.4-A.1-A.2-A.3-A.4-A.5-A.6) |
140.975,83 |
124.337,70 |
381.728,48 |
|
|
A.7. Financial
expenses |
25.161,82 |
105.265,97 |
148.150,43 |
|
|
Other companies
debts |
25.161,82 |
105.265,97 |
148.150,43 |
|
|
A.8. Variation in
financial investments provision |
|
|
|
|
|
A.9. Exchange
losses |
2.099,20 |
1.123,18 |
102.706,65 |
|
|
A.II. POSITIVE
FINANCIAL RESULTS (B.5+B.6+B.7+B.8-A.7-A.8-A.9) |
|
|
|
|
|
A.III. PROFIT
FROM ORDINARY ACTIVITIES (A.I+A.II-B.I-B.II) |
113.856,38 |
68.722,16 |
141.112,59 |
|
|
A.10. Variation
in provision in fixed assets |
|
|
|
|
|
A.11. Losses in
fixed assets |
|
|
|
|
|
A.12. Losses from
shares and bonds |
|
|
|
|
|
A.13.
Extraordinary charges |
|
1.356,73 |
1.799,59 |
|
|
A.14. Prior
year’s expenses and losses |
|
|
|
|
|
A.IV. POSITIVE
EXTRAORDINARY RESULT (B.9+B.10+B.11+B.12+B.13-A.10-A.11-A.12-A.13-A.14) |
|
6.661,76 |
7.559,99 |
|
|
A.V. EARNINGS /
LOSS BEFORE TAXES (A.III+A.IV-B.III-B.IV) |
113.856,38 |
75.383,92 |
148.672,58 |
|
|
A.15. Corporate
Taxes |
35.342,15 |
22.615,18 |
52.035,40 |
|
|
A.16. Other taxes |
|
|
|
|
|
A.VI. YEAR END
RESULT (PROFIT) (A.V-A.15-A.16) |
78.514,23 |
52.768,74 |
96.637,18 |
|
|
B) INCOMES (B.1 a
B13) |
|
|
|
|
|
B.1. Turnover |
5.803.068,80 |
11.375.087,71 |
16.819.327,19 |
|
|
Sales |
6.033.090,71 |
12.711.674,12 |
17.911.778,31 |
|
|
Discounts |
-230.021,91 |
-1.336.586,41 |
-1.092.451,12 |
|
|
B.2. Increase in
inventory of finished goods |
|
|
|
|
|
B.3. Expenses
capitalized |
|
|
|
|
|
B.4. Other
operating income |
76.173,29 |
20.228,27 |
196.944,57 |
|
|
Other incomes |
76.173,29 |
20.228,27 |
196.944,57 |
|
|
B.I. OPERATING
LOSSES (A.1+A.2+A.3+A.4+A.5+A.6-B.1-B.2-B.3-B.4) |
|
|
|
|
|
B.5. Incomes from
share |
|
|
|
|
|
B.6. Income from
securities |
|
|
|
|
|
B.7. Other income
from interrest |
141,57 |
9.181,97 |
2.785,66 |
|
|
From other
companies |
141,57 |
9.181,97 |
2.785,66 |
|
|
B.8. Gains on
exchange |
|
41.591,64 |
7.455,53 |
|
|
B.II. FINANCIAL
LOSSES (A.7+A.8+A.9-B.5-B.6-B.7-B.8) |
27.119,45 |
55.615,54 |
240.615,89 |
|
|
B.III. LOSSES
FROM ORDINARY ACTIVITIES (B.I+B.II-A.I-A.II) |
|
|
|
|
|
B.9. Gains from
disposal of fixed assets |
|
|
|
|
|
B.10. Gains from
dealing in own shares |
|
|
|
|
|
B.11. Paid in
surplus |
|
|
|
|
|
B.12.
Extraordinary income |
|
8.018,49 |
9.359,58 |
|
|
B.13. Prior
year’s income and profits |
|
|
|
|
|
B.IV.
EXTRAORDINARY LOSSES (A.10+A.11+A.12+A.13+A.14-B.9-B.10-B.11-B.12-B.13) |
|
|
|
|
|
B.V. LOSS BEFORE
TAXES (B.III+B.IV-A.III-A.IV) |
|
|
|
|
|
B.VI. NET LOSS
(B.V+A.15+A.16) |
|
|
|
Main Ratios
|
(Figures given in
Euros) |
2.003 (12)
|
2.004 (12)
|
2.005 (12)
|
|
|
|
ACTIVITY |
|
|
|
|
|
Increase of the
Sales Figures |
|
96,02 |
47,86 |
|
|
Assets Turnover |
2,11 |
4,77 |
2,29 |
|
|
Productivity |
2,86 |
1,51 |
2,50 |
|
|
Increase of the
Added Value |
|
74,27 |
54,21 |
|
|
PROFITABILITY |
|
|
|
|
|
Economic
Profitability |
2,85 |
2,21 |
1,32 |
|
|
Financial
Profitability |
56,26 |
27,44 |
33,44 |
|
|
Financial
Expenses |
0,43 |
0,93 |
0,88 |
|
|
BALANCE (IN DAYS
OF SALES) |
|
|
|
|
|
Customers’ Credit
(In days of sales) |
126,00 |
32,00 |
114,00 |
|
|
Suppliers’ Credit
(In days of sales) |
51,00 |
13,00 |
54,00 |
|
|
Working Capital
(In days of sales) |
5,00 |
3,00 |
4,00 |
|
|
Working Capital
Requirement (In days of sales) |
82,00 |
45,00 |
95,00 |
|
|
Treasury (In days
of sales) |
0,00 |
0,00 |
0,00 |
|
|
BALANCE |
|
|
|
|
|
Working Capital |
74.357,49 |
104.512,69 |
209.073,67 |
|
|
Working Capital
Requirement |
1.318.087,88 |
1.410.887,30 |
4.433.575,59 |
|
|
Treasury |
-1.213.582,39 |
-1.276.226,61 |
-4.224.501,92 |
|
|
Balance Ratio |
2,01 |
2,15 |
3,01 |
|
|
SOLVENCY |
|
|
|
|
|
Borrowing Ratio |
94,94 |
91,93 |
96,06 |
|
|
Own / Permanent
Funds |
73,82 |
82,93 |
92,35 |
|
|
Payback Capacity |
0,45 |
0,19 |
0,42 |
|
|
LIQUIDITY |
|
|
|
|
|
General Liquidity |
1,03 |
1,05 |
1,03 |
|
|
Immediate
Liquidity |
0,12 |
0,13 |
0,04 |
Sectorial Analysis
Summary of Assets, Liability & Equity
|
(Figures given in
Percentages) |
Company |
Sector |
Company |
|
|
2.005 |
|
|
|
Assets |
|||
|
DUE
FROM SHAREHOLDERS FOR UNCALLED CAPITAL |
0,00 |
0,07 |
-0,07 |
|
FIXED
ASSETS |
1,42 |
33,38 |
-31,96 |
|
ACCRUED
EXPENSES |
0,00 |
0,27 |
-0,27 |
|
CURRENT
ASSETS |
98,58 |
66,29 |
32,29 |
|
TOTAL
ASSETS |
100,00 |
100,00 |
0,00 |
|
Liabilities |
|||
|
SHAREHOLDERS
EQUITY |
3,94 |
35,24 |
-31,30 |
|
ACCRUED
INCOME |
0,00 |
2,16 |
-2,16 |
|
RISK
AND EXPENDITURE COVER |
0,00 |
0,45 |
-0,45 |
|
LONG-TERM
CREDITORS |
0,33 |
8,97 |
-8,64 |
|
SHORT-TERM
CREDITORS |
95,73 |
53,16 |
42,57 |
|
SHORT-TERM
RISK AND EXPENDITURE COVER |
0,00 |
0,01 |
-0,01 |
|
TOTAL
LIABILITIES |
100,00 |
100,00 |
0,00 |
Analytical Account of Results
|
(Figures given in
Percentages) |
Company |
Sector |
Company |
|
|
2.005 |
|
|
|
Net
turnover |
98,84 |
98,18 |
0,66 |
|
Other
operating income |
1,16 |
1,82 |
-0,66 |
|
Production
Value |
100,00 |
100,00 |
0,00 |
|
Operating
expenses |
92,82 |
81,58 |
11,24 |
|
Other
operation expenses |
3,10 |
7,43 |
-4,33 |
|
Added
value |
4,07 |
10,98 |
-6,91 |
|
Labor
cost |
1,63 |
7,19 |
-5,55 |
|
Gross
Economic Result |
2,44 |
3,80 |
-1,35 |
|
Assets
depreciation |
0,12 |
1,23 |
-1,11 |
|
Variation
in provision for current assets |
0,08 |
0,20 |
-0,12 |
|
Net
Economic Result |
2,24 |
2,36 |
-0,12 |
|
Financial
income |
0,06 |
0,33 |
-0,27 |
|
Financial
expenses |
1,47 |
0,62 |
0,86 |
|
Variation
in financial investment provision |
0,00 |
0,00 |
-0,00 |
|
Ordinary
Activities Result |
0,83 |
2,08 |
-1,25 |
|
Extraordinary
income |
0,06 |
0,44 |
-0,38 |
|
Extraordinary
expenses |
0,01 |
0,18 |
-0,17 |
|
Variation
in provision in fixed assets |
0,00 |
0,02 |
-0,02 |
|
Results
before Taxes |
0,87 |
2,32 |
-1,44 |
|
Corporaye
taxes |
0,31 |
0,73 |
-0,42 |
|
Net
Result |
0,57 |
1,59 |
-1,02 |
|
Assets
depreciation |
0,12 |
1,23 |
-1,11 |
|
Provisions
fund variation |
0,08 |
0,22 |
-0,14 |
|
Net
Self-Financing |
0,77 |
3,04 |
-2,27 |
Ratios
|
(Figures given in
) |
Company |
Ptile25
|
Medium
|
Ptile75
|
|
|
2.005 |
|
|
|
|
ACTIVITY |
|
|
|
|
|
Increase
of the Sales Figures |
47,86 |
-3,56 |
5,50 |
13,49 |
|
Assets
Turnover |
2,29 |
1,91 |
2,81 |
3,89 |
|
Fixed
Assets Turnover |
162,03 |
5,55 |
10,86 |
24,67 |
|
Increase
of the Added Value |
54,21 |
-4,28 |
5,34 |
15,51 |
|
PRODUCTIVITY |
|
|
|
|
|
Productivity |
2,50 |
1,29 |
1,49 |
1,91 |
|
Change
of Personnel Costs |
-6,50 |
1,37 |
8,44 |
17,12 |
|
Average
Personnel Costs |
34.735,62 |
17.412,08 |
22.181,41 |
28.573,30 |
|
Value
Added by Employees |
86.659,03 |
26.048,10 |
34.590,48 |
50.345,63 |
|
CASH FLOW |
|
|
|
|
|
Cash
Flow |
130.295,97 |
150.614,70 |
278.165,55 |
512.320,39 |
|
Operating
Cash Flow |
415.387,27 |
183.769,81 |
361.991,71 |
648.167,46 |
|
Change
in Cash Flow |
61,32 |
-18,13 |
3,02 |
23,63 |
|
PROFITABILITY |
|
|
|
|
|
Economic
Profitability |
1,32 |
1,13 |
2,69 |
5,25 |
|
Financial
Profitability |
33,44 |
4,88 |
10,31 |
17,09 |
|
Financial
Expenses |
0,88 |
0,10 |
0,34 |
0,72 |
|
Gross
Economic Profitability |
5,66 |
5,10 |
8,01 |
12,18 |
|
Gross
Financial Profitability |
143,76 |
18,13 |
30,04 |
44,68 |
|
BALANCE (IN DAYS
OF SALES) |
|
|
|
|
|
Customers’
Credit (In days of sales) |
113,00 |
33,13 |
53,47 |
78,14 |
|
Suppliers’
Credit (In days of sales) |
53,00 |
0,00 |
41,84 |
77,50 |
|
Working
Capital (In days of sales) |
4,00 |
-2,60 |
10,52 |
31,26 |
|
Working
Capital Requirement (In days of sales) |
94,00 |
-8,57 |
9,84 |
32,20 |
|
Treasury
(In days of sales) |
0,00 |
-13,60 |
2,97 |
17,84 |
|
Operating
Current Assets |
154,00 |
63,17 |
90,69 |
129,42 |
|
BALANCE |
|
|
|
|
|
Working
Capital |
209.073,67 |
-66.378,21 |
337.190,54 |
1.141.950,94 |
|
Working
Capital Requirement |
4.433.575,59 |
-262.551,90 |
297.866,52 |
1.246.950,60 |
|
Treasury |
-4.224.501,92 |
-541.580,11 |
85.374,63 |
530.434,14 |
|
Balance
Ratio |
3,01 |
0,94 |
1,36 |
2,40 |
|
SOLVENCY |
|
|
|
|
|
Borrowing
Ratio |
96,06 |
54,75 |
71,78 |
82,54 |
|
Own
/ Permanent Funds |
92,35 |
63,29 |
86,85 |
99,44 |
|
Payback
Capacity |
0,42 |
0,15 |
0,23 |
0,33 |
|
Long
term Indebtedness |
0,33 |
0,07 |
4,19 |
12,53 |
|
Gearing |
2.538,09 |
221,02 |
354,39 |
572,83 |
|
Financing
Basic Ratio |
1,00 |
1,00 |
1,00 |
1,02 |
|
Assets
Guarantee |
1,04 |
1,17 |
1,33 |
1,76 |
|
LIQUIDITY |
|
|
|
|
|
General
Liquidity |
1,03 |
0,97 |
1,13 |
1,46 |
|
Immediate
Liquidity |
0,04 |
0,04 |
0,12 |
0,36 |
The date when this report was last updated
is 08/11/2006.
This company was last displayed
on 02/11/2006, it has been viewed 15 times in the last quarter
and 284 times in total .
RATING EXPLANATIONS
|
RATING |
STATUS |
PROPOSED CREDIT LINE |
|
|
>86 |
Aaa |
Possesses an extremely sound financial
base with the strongest capability for timely payment of interest and
principal sums |
Unlimited |
|
71-85 |
Aa |
Possesses adequate working capital. No
caution needed for credit transaction. It has above average (strong)
capability for payment of interest and principal sums |
Large |
|
56-70 |
A |
Financial & operational base are
regarded healthy. General unfavourable factors will not cause fatal effect.
Satisfactory capability for payment of interest and principal sums |
Fairly Large |
|
41-55 |
Ba |
Overall operation is considered normal.
Capable to meet normal commitments. |
Satisfactory |
|
26-40 |
B |
Unfavourable & favourable factors
carry similar weight in credit consideration. Capability to overcome
financial difficulties seems comparatively below average/normal. |
Small |
|
11-25 |
Ca |
Adverse factors are apparent. Repayment of
interest and principal sums in default or expected to be in default upon
maturity |
Limited with full security |
|
<10 |
C |
Absolute credit risk exists. Caution
needed to be exercised |
Credit not recommended |
|
NR |
In view of the lack of information, we
have no basis upon which to recommend credit dealings |
No Rating |
|