
MIRA
INFORM REPORT
|
Report Date : |
9th
November, 2006 |
IDENTIFICATION
DETAILS
|
Name : |
RAMON
SABATER SA |
|
|
|
|
Registered Office : |
Avenida Murcia, 49, 30110
Murcia (Murcia) |
|
|
|
|
Country : |
Spain |
|
|
|
|
Financials (as on) : |
31.12.2004 |
|
|
|
|
Date of Incorporation : |
07.01.1987 |
|
|
|
|
Legal Form : |
Joint Stock Company |
|
|
|
|
Line of Business : |
Manufacture of condiments, seasonings, aromatic
herbs, sauces & other dressings. |
RATING & COMMENTS
|
MIRA’s Rating : |
A |
|
RATING |
STATUS |
PROPOSED CREDIT LINE |
|
|
56-70 |
A |
Financial & operational base are
regarded healthy. General unfavourable factors will not cause fatal effect.
Satisfactory capability for payment of interest and principal sums |
Fairly Large |
|
Status : |
Good |
|
|
|
|
Payment Behaviour : |
Regular
|
|
|
|
|
Litigation : |
Clear |
Company Name
RAMON
SABATER SA
TAX NUMBER
A30116198
Identification and
Characteristics
Tax Number A30116198
NAME RAMON
SABATER SA
BUSINESS ADDRESS AVENIDA
MURCIA, 49
Postcode 30110
MURCIA (MURCIA)
URL http://www.rsabater.com
TELEPHONE 968897900
FAX 968879900
LEGAL FORM JOINT
STOCK COMPANY
DATE FOUNDED 07/01/1987
CAPITAL 90.151,82 Euros
PAID-UP CAPITAL 90.151,82 Euros
NUMBER OF EMPLOYEES 60
BANKS B
POPULAR OF 0016; CAJAMURCIA OF 0130; BBVA OF 4557;
BSCH;
ACTIVITY 1423400 - Mfg.
of aromatic herbs, sauces & other dressings
CNAE 1587 - Manufacture
of condiments and seasonings
EXPORT COMPANY YES
IMPORT COMPANY YES
Synthesis
FINANCIAL SITUATION (Year ending: 31/12/2004)
![]()
PROFITABILITY ![]() 6/9 Average
6/9 Average
TREASURY ![]() 9/9 Excellent
9/9 Excellent
BALANCE SHEET ![]() 9/9 Excellent
9/9 Excellent
DEBT ![]() 7/9 Low
7/9 Low
INCIDENTS
![]()
COMMITMENTS ![]() 9/9 Respected
9/9 Respected
INCIDENTS ![]() 9/9 None
or Negligible
9/9 None
or Negligible
PREVIOUS EXPERIENCE
![]()
PREVIOUS EXPERIENCE ![]() 9/9 Very
favourable
9/9 Very
favourable
Credit Appraisal
CREDIT ACCORDING TO OBJECTIVE DATA (From 0 to 500.000,00 Euros):
FAVOURABLE TOWARDS 500.000,00 Max.
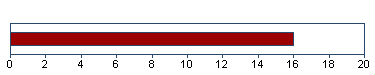
SOLVENCY RATING:
16/20 (BASED ON HOMOGENEOUS FORMULATION)
Financial Elements
Figures
given in Euros
|
|
Balance
sheet 2.002 (12) |
Balance
sheet 2.003 (12) |
Balance
sheet 2.004 (12) |
%
Sales |
|
SALES |
15.602.705,00 |
14.883.810,05 |
16.511.550,36 |
|
|
ADDED VALUE |
4.435.698,00 |
4.071.448,10 |
3.405.102,87 |
20,62 |
|
BUSINESS RESULT |
1.935.417,00 |
1.594.564,43 |
1.046.796,65 |
6,34 |
|
OWN FUNDS |
6.054.752,00 |
7.649.316,48 |
8.696.112,83 |
|
|
DEBT |
5.380.937,00 |
5.560.392,05 |
6.894.024,32 |
|
|
TOTAL ASSET |
11.570.406,00 |
13.324.595,94 |
15.685.195,20 |
|
The
sales of 16.511.550,36 Euros show a change of
10,94% compared with 2.003 . Between 2.002
and 2.003 , this change was -4,61% .
Added
value grew by -16,37% compared with the previous year. Shareholders
equity are 8.696.112,83 Euros for an indebtedness of
6.894.024,32 Euros .
The
result 1.046.796,65 Euros means financial profitability of
12,04% and economic profitability of 6,67% . This result
means growth of -34,35% compared with the 2.003 .
THE
FIGURES FOR THE LAST BALANCE SHEET ARE RELEVANT:
SOURCE: FROM
THE MERCANTILE REGISTER
DATE: 01/12/2005
Auditors’ opinion
FAVOURABLE
(2.004)
Auditors
AREAS AUDITORES
SL
Comparative Sector Analysis
|
|
Company |
Sector |
Difference |
|
|
(2.004) |
|
|
|
%
of PRODUCTION VALUE |
|
|
|
|
SALES |
99,88 |
98,82 |
1,06 |
|
ADDED
VALUE |
20,60 |
26,01 |
-5,41 |
|
BUSINESS
RESULT |
6,33 |
4,01 |
2,32 |
|
%
OF TOTAL ASSETS |
|
|
|
|
OWN
FUNDS |
55,44 |
43,90 |
11,54 |
|
DEBT |
43,95 |
56,10 |
-12,15 |
Compared sector
(CNAE): 158 - Fabricación de otros productos alimenticios
Number of
companies: 135
Size (Sales
Figure): 7.000.000,00 - 40.000.000,00 Euros
The turnover of the
company is 1,06% above the mean for the sector.
The company’s added
value was 20,60% s/ the production value, and 5,41% below the mean
for the sector.
The company’s
business result was 6,33% of the PV, 2,32% above the mean for the
sector.
The company’s own
resources are 55,44% , 11,54% above the mean for the sector.
The company’s
outside resources are 43,95% , 12,15% below the mean for the
sector.
Legal Actions
No legal incidences registered for this company in
the official source
CLAIM FILED AGAINST THE ADMINISTRATION: 1 (
Last 21/09/2004 )
![]() With
the Social Security: 0
With
the Social Security: 0
![]() With
the Tax Authorities: 0
With
the Tax Authorities: 0
![]() With
Other Organisms: 1
With
Other Organisms: 1
AFFECTED BY: No significant elemento
Last claim filed
against the administration
(Figures given in Euros)
Rest of Organisms: 1
![]() NOTIFICATIONS:
NOTIFICATIONS:
Information
Date Organization Amount
21/09/2004 COUNSELLING DE
TRABAJO Y POLITICA SOCIAL 1.502,54
Main Board members, Directors and
Auditor
|
Position |
Surname and name |
Date
of appointment |
|
VICE-PRESIDENT |
SABATER SANCHEZ
RAMON |
26/08/2002 |
|
BOARD MEMBER |
SABATER SANCHEZ
JOSE |
26/08/2002 |
|
BOARD MEMBER |
SANCHEZ TOVAR
ENCARNACION |
26/08/2002 |
|
BOARD MEMBER |
SABATER SANCHEZ
MARIA JOSEFA |
26/08/2002 |
|
BOARD MEMBER |
SABATER SANCHEZ
ENCARNACION |
26/08/2002 |
|
AUDITOR |
AREAS AUDITORES
SL |
30/06/2006 |
Financial Links
|
Shareholders |
||||
|
Company Name |
CIF/Country |
|
Source |
Information Date |
|
PROENYRA S.L. |
B73146029 |
100,00%
|
OWN SOURCES |
05/07/2005 |
Proceedings published in the
B.O.R.M.E. (Official Mercantile Register Gazette)
|
Proceedings |
Date |
Notice
Num. |
Mercantile
Reg. |
|
Resignations |
30/06/2006 |
341227 |
MURCIA |
|
Appointments |
30/06/2006 |
341227 |
MURCIA |
|
Registration of
accounts (2004) |
03/10/2005 |
639807 |
MURCIA |
|
Re-elections |
27/09/2005 |
410899 |
MURCIA |
|
Registration of
accounts (2003) |
25/02/2005 |
076290 |
MURCIA |
Press articles
17/07/2004 LA
VERDAD GENERAL INFORMATION
CAJAMURCIA Y LA EMPRESA RAMON SABATER SA ULTIMAN LA
COMPRA DEL CENTRO DE OCIO ZIG ZAG, EN LA AVENIDA DE JUAN CARLOS I DE MURCIA. LA
ENTIDAD DE AHORRO HA ENTRADO EN LA OPERACION A TRAVES DE SUMMA INVERSIONES
INMOBILIARIAS, EM PRESA DE LA CAJA QUE SE CREO PARA EL DESARROLLO DE NEGOCIOS
INMOBILIARIOS, Y ADQUIERE CON ESTE MOVIMIENTO EL 35% DEL COMPLEJO. EL PRECIO DE
VENTA DEL COMPLEJO, CUYO ANTERIOR PROPIETARIO ERA INMOBILIARIA LAYETANA, ASCIENDE
A 16 MM. DE EUROS.
26/03/2004 LA
VERDAD GENERAL INFORMATION
RAMON SABATER LOPEZ, DESTACADO EMPRESARIO DE CABEZO
DE TORRES, FALLECIO EL 25/03/04. SABATER ERA PRESIDENTE DEL CONSEJO DE ADMON.
DE LAS EMPRESAS, RA MON SABATER SA, AGRICOLAS CAMPOLLANO SL. E INDUR SL.
Complementary Information
05/07/05 BLOQUE DE INVESTIGACION:
- Domicilio social: Av Murcia, 49 en Cabezo de Torres (Murcia). Se
trata de un almacen.
- Otro establecimiento: Av Alto de las Atalayas, 231 en Murcia.
- Actividad: elaboracion de especias, salsas y condimentos.
- El numero total de accionistas asciende a 1.
- Realiza transacciones intracomunitarias de sus ventas.
- Realiza operaciones de importacion con Sudamerica.
----------------------------------------------------------------------
El Bloque de Investigacion no esta sujeto a actualizaciones sistemati-
cas. Los datos mostrados fueron aportados por las fuentes consultadas
en la fecha del encabezamiento.
The information on the last account
contained in this report is extracted from the Mercantile Register file of the
legal address of the Company and dated 01/12/2005
Balance Sheet (ASSETS)
|
(Figures given in
Euros) |
31/12/2002 (12)
|
31/12/2003 (12)
|
31/12/2004 (12)
|
|
|
|
A) DUE FROM
SHAREHOLDERS FOR UNCALLED CAPITAL |
|
|
|
|
|
B) FIXED ASSETS |
3.279.644,00 |
3.018.465,19 |
3.102.573,80 |
|
|
I. Establishment
expenses |
|
|
|
|
|
II. Intangible
assets |
3.301,00 |
3.023,31 |
9.181,06 |
|
|
Concessions,
patents,licences , trademarks |
5.227,00 |
|
|
|
|
Software |
29.066,00 |
26.345,84 |
34.672,63 |
|
|
Amortization |
-30.992,00 |
-23.322,53 |
-25.491,57 |
|
|
III. Tangible
assets |
3.255.831,00 |
2.994.931,04 |
3.072.881,90 |
|
|
Property, plant
and equipment |
2.170.065,00 |
2.206.825,05 |
2.206.825,05 |
|
|
Machinery,
equipment and other |
1.881.074,00 |
1.649.499,71 |
2.033.006,10 |
|
|
Other property
plant and equipement |
245.442,00 |
221.850,83 |
249.258,24 |
|
|
Prepaid expenses
on fixed assets |
101.302,00 |
100.952,40 |
207.257,00 |
|
|
Other assets |
340.195,00 |
280.936,66 |
313.032,87 |
|
|
Depreciation |
-1.482.247,00 |
-1.465.133,61 |
-1.936.497,36 |
|
|
IV. Financial
assets |
20.512,00 |
20.510,84 |
20.510,84 |
|
|
Securities |
1.154,00 |
1.153,20 |
1.153,20 |
|
|
Long term
deposits and guarantees |
19.358,00 |
19.357,64 |
19.357,64 |
|
|
V. Owners equity |
|
|
|
|
|
VI. Long term
trade liabilities |
|
|
|
|
|
C) DEFERRED
EXPENSES |
|
|
|
|
|
D) CURRENT ASSETS |
8.290.762,00 |
10.306.130,75 |
12.582.621,40 |
|
|
I. Not paid in
shareholder capital |
|
|
|
|
|
II. Inventory |
350.155,00 |
627.038,54 |
1.852.130,04 |
|
|
Raw material
inventory |
274.092,00 |
522.167,49 |
1.204.425,83 |
|
|
Work in Progress |
36.772,00 |
57.058,50 |
383.078,08 |
|
|
Finished goods |
39.291,00 |
47.812,55 |
99.973,80 |
|
|
Cash advance |
|
|
164.652,33 |
|
|
III. Debtors |
3.470.013,00 |
2.760.514,79 |
8.217.792,36 |
|
|
Clients |
3.416.226,00 |
2.667.637,53 |
3.595.804,47 |
|
|
Amounts owned by
affiliated companies |
|
|
4.810.092,00 |
|
|
Amounts owned by
associated companies |
|
|
4.977,51 |
|
|
Other debts |
147.609,00 |
76.050,51 |
49.585,00 |
|
|
Labor costs |
915,00 |
479,00 |
10.103,77 |
|
|
Taxes refunds |
236.565,00 |
378.477,64 |
109.359,50 |
|
|
Provisions |
-331.302,00 |
-362.129,89 |
-362.129,89 |
|
|
IV. Short term
financial assets |
2.451.242,00 |
5.754.948,87 |
|
|
|
Receivables in
affiliated companies |
|
4.554.947,92 |
|
|
|
Other loans |
2.451.242,00 |
1.200.000,95 |
|
|
|
V. Short term
owners equity |
|
|
|
|
|
VI. Cash |
2.019.352,00 |
1.163.628,55 |
2.512.699,00 |
|
|
VII. Prepaid
expenses and accrued income |
|
|
|
|
|
ASSETS (A + B + C
+ D) |
11.570.406,00 |
13.324.595,94 |
15.685.195,20 |
Balance Sheet (LIABILITIES)
|
(Figures given in
Euros) |
31/12/2002 (12)
|
31/12/2003 (12)
|
31/12/2004 (12)
|
|
|
|
A) SHAREHOLDERS
EQUITY |
6.054.752,00 |
7.649.316,48 |
8.696.112,83 |
|
|
I. Capital |
90.152,00 |
90.151,82 |
90.151,82 |
|
|
II. Premium share
account |
|
|
|
|
|
III. Revaluation
reserve |
|
|
|
|
|
IV. Reserves |
4.029.183,00 |
5.964.600,23 |
7.559.164,36 |
|
|
Retained earnings |
18.030,00 |
18.030,36 |
18.030,36 |
|
|
Reserve fo the
parent company capital |
|
5.946.569,87 |
|
|
|
Other funds |
4.011.153,00 |
|
7.541.134,00 |
|
|
V. Prior year
earnings |
|
|
|
|
|
VI. Prior year
profit or losses |
1.935.417,00 |
1.594.564,43 |
1.046.796,65 |
|
|
VII. Dividend
paid during the year |
|
|
|
|
|
VIII. Own shares
for change in capital |
|
|
|
|
|
B) DEFERRED
INCOME |
134.717,00 |
114.887,41 |
95.058,05 |
|
|
Capital grants |
134.717,00 |
114.887,41 |
95.058,05 |
|
|
C) PROVISIONS FOR
LIABILITIES AND EXPENSES |
|
|
|
|
|
D) LONG TERM
LIABILITIES |
|
|
|
|
|
I. Bonds |
|
|
|
|
|
II. Bank loans |
|
|
|
|
|
III. Debts with
associed and affiliated companies |
|
|
|
|
|
IV. Other
creditors |
|
|
|
|
|
V. Deferred debts
on shares |
|
|
|
|
|
VI. Long term
debt with creditor |
|
|
|
|
|
E) SHORT TERM
LIABILITIES |
5.380.937,00 |
5.560.392,05 |
6.894.024,32 |
|
|
I. Negotiable
bonds |
|
|
|
|
|
II. Bank loans |
9.909,00 |
|
3.492.477,08 |
|
|
Loans and other
debts |
9.909,00 |
|
3.492.477,08 |
|
|
III. Short term
debts with associated and affiliated companies |
|
2.438.270,22 |
748.742,76 |
|
|
With affiliated
companies |
|
2.438.270,22 |
748.742,76 |
|
|
IV. Trade
creditors |
4.320.484,00 |
2.728.401,41 |
2.355.327,22 |
|
|
Accounts payable |
|
|
557.609,49 |
|
|
Expenses |
4.320.484,00 |
1.779.407,56 |
1.002.018,00 |
|
|
Bills payable |
|
948.993,85 |
795.699,73 |
|
|
V. Other non
trade payables |
1.023.727,00 |
357.405,82 |
282.854,64 |
|
|
Government |
1.020.914,00 |
120.453,08 |
129.692,21 |
|
|
Bills payable |
|
|
142.678,06 |
|
|
Other debts |
|
177.095,29 |
8.205,47 |
|
|
Accounts
receivable |
2.813,00 |
59.857,45 |
2.278,90 |
|
|
VI. Provisions
for current assets |
|
|
|
|
|
VII. Accruals and
deferred incomes |
26.817,00 |
36.314,60 |
14.622,62 |
|
|
F) SHORT TERM
PROVISIONS FOR LIABILITIES AND EXPENSES |
|
|
|
|
|
LIABILITIES (A +
B + C + D + E + F) |
11.570.406,00 |
13.324.595,94 |
15.685.195,20 |
Profit and Loss Account
|
(Figures given in
Euros) |
31/12/2002 (12)
|
31/12/2003 (12)
|
31/12/2004 (12)
|
|
|
|
A) EXPENSES (A.1
a A.16) |
|
|
|
|
|
A.1. Change in
stocks of finished goods and work in progress |
339.482,00 |
|
|
|
|
A.2. Supplies |
8.505.178,00 |
8.200.299,52 |
10.323.978,64 |
|
|
Material consumed |
7.921.275,00 |
7.297.235,56 |
9.010.883,86 |
|
|
Raw materials
consumed |
121.454,00 |
125.591,95 |
81.392,25 |
|
|
Other expenses |
462.449,00 |
777.472,01 |
1.231.702,53 |
|
|
A.3. Labor cost |
1.287.687,00 |
1.223.033,56 |
1.425.990,69 |
|
|
Wages |
1.021.215,00 |
933.848,01 |
1.100.192,75 |
|
|
Social security
expenses |
266.472,00 |
289.185,55 |
325.797,94 |
|
|
A.4. Assets
depreciation |
230.802,00 |
510.927,60 |
482.750,45 |
|
|
A.5 Variance in
provision for current assets |
|
67.261,62 |
|
|
|
Variance in
provision for bad debts |
|
67.261,62 |
|
|
|
A.6. Other
operating costs |
2.326.554,00 |
2.644.476,61 |
2.855.022,17 |
|
|
External costs |
2.308.514,00 |
2.618.849,11 |
2.820.437,00 |
|
|
Taxes |
18.040,00 |
25.627,50 |
34.585,17 |
|
|
A.I. OPERATING
RESULT (B.1+B.2+B.3+B.4-A.1-A.2-A.3-A.4-A.5-A.6) |
2.917.209,00 |
2.270.225,32 |
1.496.361,73 |
|
|
A.7. Financial
expenses |
54.564,00 |
53.861,55 |
37.790,03 |
|
|
Debts with
related companies |
|
53.861,55 |
37.790,03 |
|
|
Other companies
debts |
54.564,00 |
|
|
|
|
A.8. Variation in
financial investments provision |
|
|
|
|
|
A.9. Exchange
losses |
78.482,00 |
134.095,21 |
126.936,70 |
|
|
A.II. POSITIVE
FINANCIAL RESULTS (B.5+B.6+B.7+B.8-A.7-A.8-A.9) |
27.513,00 |
|
|
|
|
A.III. PROFIT
FROM ORDINARY ACTIVITIES (A.I+A.II-B.I-B.II) |
2.944.722,00 |
2.157.611,90 |
1.460.162,64 |
|
|
A.10. Variation
in provision in fixed assets |
|
|
|
|
|
A.11. Losses in
fixed assets |
|
7.044,24 |
|
|
|
A.12. Losses from
shares and bonds |
|
|
|
|
|
A.13.
Extraordinary charges |
1.542,00 |
11.785,06 |
26.225,56 |
|
|
A.14. Prior
year’s expenses and losses |
5.226,00 |
2.746,62 |
|
|
|
A.IV. POSITIVE
EXTRAORDINARY RESULT (B.9+B.10+B.11+B.12+B.13-A.10-A.11-A.12-A.13-A.14) |
26.551,00 |
165.124,13 |
45.838,01 |
|
|
A.V. EARNINGS /
LOSS BEFORE TAXES (A.III+A.IV-B.III-B.IV) |
2.971.273,00 |
2.322.736,03 |
1.506.000,65 |
|
|
A.15. Corporate
Taxes |
1.035.856,00 |
728.171,60 |
459.204,00 |
|
|
A.16. Other taxes |
|
|
|
|
|
A.VI. YEAR END
RESULT (PROFIT) (A.V-A.15-A.16) |
1.935.417,00 |
1.594.564,43 |
1.046.796,65 |
|
|
B) INCOMES (B.1 a
B13) |
|
|
|
|
|
B.1. Turnover |
15.602.705,00 |
14.883.810,05 |
16.511.550,36 |
|
|
Sales |
15.885.708,00 |
15.159.236,02 |
16.501.865,04 |
|
|
Services provided |
150.229,00 |
159.837,64 |
461.102,37 |
|
|
Discounts |
-433.232,00 |
-435.263,61 |
-451.417,05 |
|
|
B.2. Increase in
inventory of finished goods |
|
28.808,11 |
52.161,25 |
|
|
B.3. Expenses
capitalized |
|
|
|
|
|
B.4. Other
operating income |
4.207,00 |
3.606,07 |
20.392,07 |
|
|
Other incomes |
4.207,00 |
3.606,07 |
3.606,07 |
|
|
Grants |
|
|
16.786,00 |
|
|
B.I. OPERATING
LOSSES (A.1+A.2+A.3+A.4+A.5+A.6-B.1-B.2-B.3-B.4) |
|
|
|
|
|
B.5. Incomes from
share |
|
|
|
|
|
B.6. Income from
securities |
|
|
|
|
|
B.7. Other income
from interrest |
114.566,00 |
28.121,47 |
20.090,70 |
|
|
From affiliated
companies |
|
28.121,47 |
20.044,87 |
|
|
From other
companies |
114.566,00 |
|
45,83 |
|
|
B.8. Gains on
exchange |
45.993,00 |
47.221,87 |
108.436,94 |
|
|
B.II. FINANCIAL
LOSSES (A.7+A.8+A.9-B.5-B.6-B.7-B.8) |
|
112.613,42 |
36.199,09 |
|
|
B.III. LOSSES
FROM ORDINARY ACTIVITIES (B.I+B.II-A.I-A.II) |
|
|
|
|
|
B.9. Gains from
disposal of fixed assets |
2.650,00 |
28.927,75 |
1.619,97 |
|
|
B.10. Gains from
dealing in own shares |
|
|
20,79 |
|
|
B.11. Paid in
surplus |
19.829,00 |
19.829,36 |
19.829,00 |
|
|
B.12. Extraordinary
income |
10.829,00 |
137.942,94 |
11.583,91 |
|
|
B.13. Prior
year’s income and profits |
11,00 |
|
39.009,90 |
|
|
B.IV.
EXTRAORDINARY LOSSES (A.10+A.11+A.12+A.13+A.14-B.9-B.10-B.11-B.12-B.13) |
|
|
|
|
|
B.V. LOSS BEFORE
TAXES (B.III+B.IV-A.III-A.IV) |
|
|
|
|
|
B.VI. NET LOSS
(B.V+A.15+A.16) |
|
|
|
Main Ratios
|
(Figures given in
Euros) |
2.002 (12)
|
2.003 (12)
|
2.004 (12)
|
|
|
|
ACTIVITY |
|
|
|
|
|
Increase of the
Sales Figures |
19,88 |
-4,61 |
10,94 |
|
|
Assets Turnover |
1,35 |
1,12 |
1,05 |
|
|
Productivity |
3,45 |
3,33 |
2,39 |
|
|
Increase of the
Added Value |
180,66 |
-8,21 |
-16,37 |
|
|
PROFITABILITY |
|
|
|
|
|
Economic
Profitability |
16,73 |
11,97 |
6,67 |
|
|
Financial
Profitability |
31,97 |
20,85 |
12,04 |
|
|
Financial
Expenses |
0,35 |
0,36 |
0,23 |
|
|
BALANCE (IN DAYS
OF SALES) |
|
|
|
|
|
Customers’ Credit
(In days of sales) |
80,00 |
67,00 |
179,00 |
|
|
Suppliers’ Credit
(In days of sales) |
176,00 |
120,00 |
83,00 |
|
|
Working Capital
(In days of sales) |
67,00 |
115,00 |
124,00 |
|
|
Working Capital
Requirement (In days of sales) |
0,00 |
0,00 |
145,00 |
|
|
Treasury (In days
of sales) |
103,00 |
167,00 |
0,00 |
|
|
BALANCE |
|
|
|
|
|
Working Capital |
2.909.825,00 |
4.745.738,70 |
5.688.597,08 |
|
|
Working Capital
Requirement |
-1.550.860,00 |
-2.172.838,72 |
6.668.375,16 |
|
|
Treasury |
4.460.685,00 |
6.918.577,42 |
-979.778,08 |
|
|
Balance Ratio |
1,89 |
2,57 |
2,83 |
|
|
SOLVENCY |
|
|
|
|
|
Borrowing Ratio |
46,51 |
41,73 |
43,95 |
|
|
Own / Permanent
Funds |
97,82 |
98,52 |
98,92 |
|
|
Payback Capacity |
0,34 |
0,36 |
0,41 |
|
|
LIQUIDITY |
|
|
|
|
|
General Liquidity |
1,54 |
1,85 |
1,83 |
|
|
Immediate
Liquidity |
0,83 |
1,24 |
0,36 |
Sectorial Analysis
Summary of Assets, Liability & Equity
|
(Figures given in
Percentages) |
Company |
Sector |
Company |
|
|
2.004 |
|
|
|
Assets |
|||
|
DUE
FROM SHAREHOLDERS FOR UNCALLED CAPITAL |
0,00 |
0,00 |
0,00 |
|
FIXED
ASSETS |
19,78 |
46,47 |
-26,69 |
|
ACCRUED
EXPENSES |
0,00 |
0,66 |
-0,66 |
|
CURRENT
ASSETS |
80,22 |
52,86 |
27,36 |
|
TOTAL
ASSETS |
100,00 |
100,00 |
0,00 |
|
Liabilities |
|||
|
SHAREHOLDERS
EQUITY |
55,44 |
43,90 |
11,54 |
|
ACCRUED
INCOME |
0,61 |
2,19 |
-1,58 |
|
RISK
AND EXPENDITURE COVER |
0,00 |
0,39 |
-0,39 |
|
LONG-TERM
CREDITORS |
0,00 |
14,15 |
-14,15 |
|
SHORT-TERM
CREDITORS |
43,95 |
39,35 |
4,60 |
|
SHORT-TERM
RISK AND EXPENDITURE COVER |
0,00 |
0,01 |
-0,01 |
|
TOTAL
LIABILITIES |
100,00 |
100,00 |
0,00 |
Analytical Account of Results
|
(Figures given in
Percentages) |
Company |
Sector |
Company |
|
|
2.004 |
|
|
|
Net
turnover |
99,88 |
98,82 |
1,06 |
|
Other
operating income |
0,12 |
1,18 |
-1,06 |
|
Production
Value |
100,00 |
100,00 |
0,00 |
|
Operating
expenses |
62,13 |
57,14 |
4,99 |
|
Other
operation expenses |
17,27 |
16,85 |
0,42 |
|
Added
value |
20,60 |
26,01 |
-5,41 |
|
Labor
cost |
8,63 |
15,26 |
-6,64 |
|
Gross
Economic Result |
11,97 |
10,75 |
1,22 |
|
Assets
depreciation |
2,92 |
4,26 |
-1,34 |
|
Variation
in provision for current assets |
0,00 |
0,17 |
-0,17 |
|
Net
Economic Result |
9,05 |
6,32 |
2,73 |
|
Financial
income |
0,78 |
0,48 |
0,30 |
|
Financial
expenses |
1,00 |
1,37 |
-0,37 |
|
Variation
in financial investment provision |
0,00 |
0,04 |
-0,04 |
|
Ordinary
Activities Result |
8,83 |
5,40 |
3,43 |
|
Extraordinary
income |
0,44 |
0,75 |
-0,32 |
|
Extraordinary
expenses |
0,16 |
0,43 |
-0,27 |
|
Variation
in provision in fixed assets |
0,00 |
0,10 |
-0,10 |
|
Results
before Taxes |
9,11 |
5,62 |
3,49 |
|
Corporaye
taxes |
2,78 |
1,61 |
1,17 |
|
Net
Result |
6,33 |
4,01 |
2,32 |
|
Assets
depreciation |
2,92 |
4,26 |
-1,34 |
|
Provisions
fund variation |
0,00 |
0,31 |
-0,31 |
|
Net
Self-Financing |
9,25 |
8,58 |
0,67 |
Ratios
|
(Figures given in
) |
Company |
Ptile25
|
Medium
|
Ptile75
|
|
|
2.004 |
|
|
|
|
ACTIVITY |
|
|
|
|
|
Increase
of the Sales Figures |
10,94 |
-1,31 |
5,89 |
13,59 |
|
Assets
Turnover |
1,05 |
1,02 |
1,26 |
1,57 |
|
Fixed
Assets Turnover |
5,32 |
1,97 |
3,10 |
4,38 |
|
Increase
of the Added Value |
-16,37 |
-2,00 |
4,72 |
13,18 |
|
PRODUCTIVITY |
|
|
|
|
|
Productivity |
2,39 |
1,42 |
1,63 |
2,11 |
|
Change
of Personnel Costs |
16,60 |
2,96 |
9,23 |
15,73 |
|
Average
Personnel Costs |
23.766,51 |
20.011,87 |
25.995,82 |
32.155,10 |
|
Value
Added by Employees |
56.751,72 |
31.137,55 |
40.794,88 |
56.110,78 |
|
CASH FLOW |
|
|
|
|
|
Cash
Flow |
1.529.547,10 |
646.721,63 |
1.149.232,00 |
2.112.061,00 |
|
Operating
Cash Flow |
1.979.112,18 |
833.610,11 |
1.403.094,66 |
2.637.890,63 |
|
Change
in Cash Flow |
-29,60 |
-11,76 |
2,80 |
20,00 |
|
PROFITABILITY |
|
|
|
|
|
Economic
Profitability |
6,67 |
1,00 |
3,53 |
8,14 |
|
Financial
Profitability |
12,04 |
3,01 |
9,44 |
16,57 |
|
Financial
Expenses |
0,23 |
0,46 |
0,93 |
1,74 |
|
Gross
Economic Profitability |
12,62 |
7,65 |
11,69 |
17,68 |
|
Gross
Financial Profitability |
22,76 |
20,59 |
29,50 |
44,57 |
|
BALANCE (IN DAYS
OF SALES) |
|
|
|
|
|
Customers’
Credit (In days of sales) |
179,00 |
59,82 |
87,26 |
116,34 |
|
Suppliers’
Credit (In days of sales) |
82,00 |
59,54 |
90,99 |
129,68 |
|
Working
Capital (In days of sales) |
124,00 |
-9,53 |
26,50 |
68,24 |
|
Working
Capital Requirement (In days of sales) |
145,00 |
4,56 |
47,99 |
89,94 |
|
Treasury
(In days of sales) |
0,00 |
-57,46 |
-16,94 |
14,05 |
|
Operating
Current Assets |
274,00 |
117,41 |
158,73 |
196,13 |
|
BALANCE |
|
|
|
|
|
Working
Capital |
5.688.597,08 |
-338.935,67 |
1.295.231,86 |
3.154.840,01 |
|
Working
Capital Requirement |
6.668.375,16 |
111.519,66 |
2.219.901,50 |
3.826.920,00 |
|
Treasury |
-979.778,08 |
-2.347.812,98 |
-690.394,28 |
549.953,02 |
|
Balance
Ratio |
2,83 |
0,92 |
1,22 |
1,76 |
|
SOLVENCY |
|
|
|
|
|
Borrowing
Ratio |
43,95 |
38,69 |
59,55 |
73,46 |
|
Own
/ Permanent Funds |
98,92 |
61,27 |
83,97 |
96,44 |
|
Payback
Capacity |
0,41 |
0,25 |
0,38 |
0,57 |
|
Long
term Indebtedness |
|
1,45 |
8,48 |
16,89 |
|
Gearing |
180,37 |
163,10 |
247,20 |
376,82 |
|
Financing
Basic Ratio |
1,00 |
1,00 |
1,01 |
1,04 |
|
Assets
Guarantee |
2,28 |
1,30 |
1,59 |
2,56 |
|
LIQUIDITY |
|
|
|
|
|
General
Liquidity |
1,82 |
0,92 |
1,21 |
1,74 |
|
Immediate
Liquidity |
0,36 |
0,03 |
0,08 |
0,30 |
The date when this report was last updated
is 08/11/2006.
This company was last displayed
on 31/10/2006, it has been viewed 17 times in the last
quarter and 262 times in total .
RATING EXPLANATIONS
|
RATING |
STATUS |
PROPOSED CREDIT LINE |
|
|
>86 |
Aaa |
Possesses an extremely sound financial
base with the strongest capability for timely payment of interest and
principal sums |
Unlimited |
|
71-85 |
Aa |
Possesses adequate working capital. No
caution needed for credit transaction. It has above average (strong)
capability for payment of interest and principal sums |
Large |
|
56-70 |
A |
Financial & operational base are
regarded healthy. General unfavourable factors will not cause fatal effect.
Satisfactory capability for payment of interest and principal sums |
Fairly Large |
|
41-55 |
Ba |
Overall operation is considered normal.
Capable to meet normal commitments. |
Satisfactory |
|
26-40 |
B |
Unfavourable & favourable factors
carry similar weight in credit consideration. Capability to overcome
financial difficulties seems comparatively below average/normal. |
Small |
|
11-25 |
Ca |
Adverse factors are apparent. Repayment of
interest and principal sums in default or expected to be in default upon
maturity |
Limited with full security |
|
<10 |
C |
Absolute credit risk exists. Caution
needed to be exercised |
Credit not recommended |
|
NR |
In view of the lack of information, we
have no basis upon which to recommend credit dealings |
No Rating |
|