
MIRA
INFORM REPORT
|
Report Date : |
16.11.2006 |
IDENTIFICATION
DETAILS
|
Name : |
FACET PEDREROS SA |
|
|
|
|
Registered Office : |
Avenida
Diagonal, 463, 08036 Barcelona (Barcelona) |
|
|
|
|
Country : |
Spain |
|
|
|
|
Financials (as on) : |
31/12/2004 |
|
|
|
|
Date of Incorporation : |
12/01/1987 |
|
|
|
|
Legal Form : |
Joint Stock Company |
|
|
|
|
Line of Business : |
Wholesalers of jewellery articles
(jewels, watches, etc.) |
RATING & COMMENTS
|
MIRA’s Rating : |
Ba |
|
RATING |
STATUS |
PROPOSED CREDIT LINE |
|
|
41-55 |
Ba |
Overall operation is considered normal.
Capable to meet normal commitments. |
Satisfactory |
|
Status : |
Good |
|
|
|
|
Payment Behaviour : |
Regular
|
|
|
|
|
Litigation : |
Clear |
Name & address
FACET PEDREROS SA
TAX NUMBER
A58288168
Identification and
Characteristics
|
Tax Number |
A58288168 |
|
NAME |
FACET
PEDREROS SA |
|
TRADE NAME |
FACET
PEDREROS, S.A. |
|
BUSINESS ADDRESS |
AVENIDA
DIAGONAL, 463 |
|
Postcode |
08036
BARCELONA (BARCELONA) |
|
FORMER ADDRESS |
CALLE
JONQUERES, 18 |
|
Postcode |
08003
BARCELONA (BARCELONA) |
|
URL |
http://www.facetdiamonds.com |
|
TELEPHONE |
933633480 |
|
FAX |
933633481 |
|
LEGAL FORM |
JOINT
STOCK COMPANY |
|
DATE FOUNDED |
12/01/1987 |
|
CAPITAL |
1.138.500,00 Euros |
|
PAID-UP CAPITAL |
1.138.500,00 Euros |
|
NUMBER OF EMPLOYEES |
32 |
|
BANKS |
B
POPULAR OF 0002; B DE SABADELL OF 0025; DEUTSCHE BANK OF
0002; |
|
ACTIVITY |
1619300 - Wholesale
of jewellery articles (jewels, watches, etc.) |
|
CNAE |
5152 - Wholesale
of metals and metal ores |
|
EXPORT COMPANY |
YES |
|
IMPORT COMPANY |
YES |
Synthesis
|
||
|
FINANCIAL
SITUATION (Year ending: 31/12/2004) |
||
|
|
|
|
|
PROFITABILITY |
|
5/9 Medium |
|
TREASURY |
|
6/9 Average |
|
BALANCE
SHEET |
|
7/9 Good |
|
DEBT |
|
5/9 Important |
|
INCIDENTS |
||
|
|
|
|
|
COMMITMENTS |
|
9/9 Respected |
|
INCIDENTS |
|
9/9 None
or Negligible |
|
PREVIOUS
EXPERIENCE |
||
|
|
|
|
|
PREVIOUS
EXPERIENCE |
|
8/9 Favourable |
Credit Appraisal
|
CREDIT
ACCORDING TO OBJECTIVE DATA (From 0 to 500.000,00 Euros): |
|
FAVOURABLE
TOWARDS 300.001,20 Max. |
|
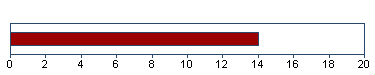
SOLVENCY
RATING: |
|
14/20 (BASED
ON HOMOGENEOUS FORMULATION) |
|
|
|
|
Financial Elements
Figures
given in Euros
|
|
Balance sheet 2.002 (12) |
Balance sheet 2.003 (12) |
Balance sheet 2.004 (12) |
% Sales |
|
SALES |
12.659.547,64 |
12.924.755,32 |
16.383.720,40 |
|
|
ADDED
VALUE |
1.519.730,99 |
1.410.876,44 |
1.655.488,97 |
10,10 |
|
BUSINESS
RESULT |
208.050,30 |
281.469,44 |
560.610,48 |
3,42 |
|
OWN
FUNDS |
2.261.267,07 |
2.463.041,51 |
2.919.289,49 |
|
|
DEBT |
9.498.198,54 |
11.058.236,26 |
12.043.054,66 |
|
|
TOTAL
ASSET |
12.088.702,85 |
13.928.901,96 |
15.509.972,67 |
|
|
The
sales of 16.383.720,40 Euros show a change of
26,76% compared with 2.003 . Between 2.002
and 2.003 , this change was 2,09% . |
||||
|
Added
value grew by 17,34% compared with the previous year.
Shareholders equity are 2.919.289,49 Euros for an
indebtedness of 12.043.054,66 Euros . |
||||
|
The
result 560.610,48 Euros means financial profitability of
19,20% and economic profitability of 3,61% . This
result means growth of 99,17% compared with the
2.003 . |
||||
|
|
||||
|
THE
FIGURES FOR THE LAST BALANCE SHEET ARE RELEVANT: |
||||
|
SOURCE: FROM
THE MERCANTILE REGISTER |
||||
|
DATE: 17/10/2005 |
||||
|
|
||||
|
Auditors’
opinion: |
||||
|
FAVOURABLE
(2.004) |
||||
|
|
||||
|
Auditors:
|
||||
|
C.C.
AUDITORES S.A. |
||||
Comparative Sector Analysis
|
|
Company |
Sector |
Difference |
|
|
(2.004) |
|
|
|
% of PRODUCTION VALUE |
|
|
|
|
SALES |
99,67 |
99,27 |
0,40 |
|
ADDED VALUE |
10,07 |
13,51 |
-3,44 |
|
BUSINESS RESULT |
3,41 |
2,93 |
0,48 |
|
% OF TOTAL ASSETS |
|
|
|
|
OWN FUNDS |
18,82 |
38,75 |
-19,93 |
|
DEBT |
77,65 |
61,25 |
16,40 |
Compared
sector (CNAE): 515 - Comercio al por mayor de
productos no agrarios semielaborados, chatarra y productos de desecho
Number
of companies: 661
Size
(Sales Figure): 7.000.000,00 - 40.000.000,00
Euros
The
turnover of the company is 0,40% above the mean for the sector.
The
company’s added value was 10,07% s/ the production value, and 3,44%
below the mean for the sector.
The company’s
business result was 3,41% of the PV, 0,48% above the mean for the
sector.
The
company’s own resources are 18,82% , 19,93% below the mean for the
sector.
The
company’s outside resources are 77,65% , 16,40% above the mean for
the sector.
Legal Actions
|
No
legal incidences registered for this company in the official source |
|
No
claims registered for this company in the official sources |
|
AFFECTED
BY: No significant elemento |
Main Board members, Directors and
Auditor
|
Position |
Surname
and name |
Date of appointment |
|
SOLE
ADMINISTRATOR |
ZEEVY
PAZ |
18/11/2002 |
|
AUDITOR |
CC
AUDITORES SA |
24/12/2004 |
Financial Links
|
Shareholders |
||||
|
Company
Name |
CIF/Country |
|
Source |
Information
Date |
|
FACET
PEDREROS SA |
A58288168 |
Major.
|
OWN
SOURCES |
12/05/2006 |
|
Shareholdings |
||||
|
Company
Name |
CIF/Country |
Percent. |
Source |
Information
Date |
|
FACET
GEMS LIMITED |
REINO
UNIDO |
100,00%
|
OWN
SOURCES |
12/07/2005 |
|
FRANGEM
SARL |
FRANCIA
|
99,98%
|
OWN
SOURCES |
12/07/2005 |
|
FACET
DIAMONDS ANTWERPEN BVBA |
BÉLGICA
|
99,00%
|
OWN
SOURCES |
12/07/2005 |
|
FACET
PEDREROS SA |
A58288168 |
0,00%
|
OWN
SOURCES |
12/05/2006 |
Proceedings published in the
B.O.R.M.E. (Official Mercantile Register Gazette)
|
Proceedings |
Date |
Notice Num. |
Mercantile Reg. |
|
Appointments |
18/07/2006 |
368238 |
BARCELONA |
|
Registration
of accounts (2004) |
28/09/2005 |
564809 |
BARCELONA |
|
Appointments |
24/12/2004 |
534852 |
BARCELONA |
|
Registration
of accounts (2003) |
22/11/2004 |
878109 |
BARCELONA |
|
Registration
of accounts (2002) |
29/01/2004 |
044382 |
BARCELONA |
Press articles
|
|
||
|
16/02/2001 |
VANGUARDIA |
LEGAL
ANNOUNCE |
|
EN
JUNTA GRAL. UNIVERSAL CELEBRADA EL 09/02/01 SE ACORDO TRASLADAR EL DOMI CILIO
SOCIAL A LA AV. DIAGONAL, 463, BIS, CUARTO, DE BARCELONA. |
||
Complementary Information
|
12/07/05
BLOQUE DE INVESTIGACION: |
|
- Su
domicilio social se encuentra en Av Diagonal, 463 en Barcelona. |
|
Son
las oficinas. |
|
- Se
dedica a la venta productos de joyeria. |
|
-
Realiza transacciones intracomunitarias de sus compras con Belgica, |
|
Inglaterra
y Francia. |
|
---------------------------------------------------------------------- |
|
El
bloque de Investigacion no esta sujeto a actualizaciones sistemati- |
|
cas.Los
datos mostrados fueron aportados por las fuentes consultadas |
|
en la
fecha del encabezamiento. |
Brands, Signs and Commercial Names
|
Prevailing
Brands |
|||||
|
Name: |
FACET |
||||
|
Kind of Brand: |
JOINT |
File: |
M2092866 |
||
|
Request Date: |
19/05/1997 |
Bulletin Date: |
Bulletin Date: |
Current situation: |
APPROVED REGISTER |
|
Types: 14 |
|
||||
|
Name: |
FACET |
||||
|
Kind of Brand: |
JOINT |
File: |
M2092867 |
||
|
Request Date: |
19/05/1997 |
Bulletin Date: |
Bulletin Date: |
Current situation: |
APPROVED REGISTER |
|
Types: 35 |
|
||||
|
Prevailing
Commercial Names |
|||||
|
Name: |
FACET PEDREROS, S.A. |
||||
|
Kind of Brand: |
DENOMINATIVE |
File: |
N158422 |
||
|
Request Date: |
16/11/1990 |
Bulletin Date: |
Bulletin Date: |
Current situation: |
RENEWED REGISTER |
|
|
|
||||
Total
Marcas: 3
The information on the last
account contained in this report is extracted from the Mercantile Register file
of the legal address of the Company and dated 17/10/2005
Balance Sheet (ASSETS)
|
(Figures
given in Euros) |
31/12/2002 (12) |
31/12/2003 (12) |
31/12/2004 (12) |
|
|
|
A)
DUE FROM SHAREHOLDERS FOR UNCALLED CAPITAL |
|
|
|
|
|
B)
FIXED ASSETS |
1.626.265,49 |
2.519.053,39 |
3.201.469,03 |
|
|
I.
Establishment expenses |
|
|
|
|
|
II.
Intangible assets |
203.240,88 |
176.377,75 |
141.563,95 |
|
|
Software |
100.494,16 |
144.662,16 |
178.040,96 |
|
|
Leasing |
192.537,31 |
150.796,66 |
119.333,94 |
|
|
Amortization |
-89.790,59 |
-119.081,07 |
-155.810,95 |
|
|
III.
Tangible assets |
399.462,94 |
1.250.123,45 |
1.222.517,28 |
|
|
Property,
plant and equipment |
|
849.811,42 |
849.811,42 |
|
|
Machinery,
equipment and other |
22.232,10 |
27.205,10 |
30.273,57 |
|
|
Other
property plant and equipement |
417.173,86 |
444.077,17 |
461.285,11 |
|
|
Other
assets |
108.169,24 |
166.849,40 |
224.159,00 |
|
|
Depreciation |
-148.112,26 |
-237.819,64 |
-343.011,82 |
|
|
IV.
Financial assets |
917.006,47 |
985.996,99 |
1.730.832,60 |
|
|
Shares
in affiliated companies |
91.518,17 |
91.518,17 |
629.652,34 |
|
|
Loans
to affiliated companies |
461.121,12 |
577.813,98 |
551.588,24 |
|
|
Other
loans |
267.340,20 |
250.777,37 |
496.422,03 |
|
|
Long
term deposits and guarantees |
125.287,03 |
115.877,47 |
103.159,99 |
|
|
Provisions |
-28.260,05 |
-49.990,00 |
-49.990,00 |
|
|
V.
Owners equity |
106.555,20 |
106.555,20 |
106.555,20 |
|
|
VI.
Long term trade liabilities |
|
|
|
|
|
C)
DEFERRED EXPENSES |
9.577,82 |
15.045,43 |
11.848,80 |
|
|
D)
CURRENT ASSETS |
10.452.859,54 |
11.394.803,14 |
12.296.654,84 |
|
|
I.
Not paid in shareholder capital |
|
|
|
|
|
II.
Inventory |
2.740.983,00 |
1.383.152,45 |
3.952.965,74 |
|
|
Goods
available for sale |
|
1.383.152,45 |
3.952.965,74 |
|
|
Raw
material inventory |
2.740.983,00 |
|
|
|
|
III.
Debtors |
7.258.561,36 |
9.685.723,65 |
8.206.715,41 |
|
|
Clients |
6.278.701,59 |
7.687.692,16 |
7.815.288,65 |
|
|
Amounts
owned by affiliated companies |
1.152.022,48 |
2.159.740,70 |
558.608,65 |
|
|
Other
debts |
24.957,04 |
25.257,05 |
25.542,03 |
|
|
Labor
costs |
15.096,01 |
14.109,93 |
5.535,24 |
|
|
Taxes
refunds |
33.479,43 |
28.223,48 |
21.971,11 |
|
|
Provisions |
-245.695,19 |
-229.299,67 |
-220.230,27 |
|
|
IV.
Short term financial assets |
11.920,11 |
285,48 |
|
|
|
Other
loans |
11.920,11 |
285,48 |
|
|
|
V.
Short term owners equity |
|
|
|
|
|
VI.
Cash |
441.395,07 |
308.506,95 |
127.558,07 |
|
|
VII.
Prepaid expenses and accrued income |
|
17.134,61 |
9.415,62 |
|
|
ASSETS
(A + B + C + D) |
12.088.702,85 |
13.928.901,96 |
15.509.972,67 |
Balance Sheet (LIABILITIES)
|
(Figures
given in Euros) |
31/12/2002 (12) |
31/12/2003 (12) |
31/12/2004 (12) |
|
|
|
A)
SHAREHOLDERS EQUITY |
2.261.267,07 |
2.463.041,51 |
2.919.289,49 |
|
|
I.
Capital |
1.138.500,00 |
1.138.500,00 |
1.138.500,00 |
|
|
II.
Premium share account |
64.900,00 |
64.900,00 |
64.900,00 |
|
|
III.
Revaluation reserve |
|
|
|
|
|
IV.
Reserves |
849.816,77 |
978.172,07 |
1.155.279,01 |
|
|
Retained
earnings |
227.700,35 |
227.700,35 |
227.700,35 |
|
|
Sinking
fund from owner equity |
106.555,20 |
106.555,20 |
106.555,20 |
|
|
Other
funds |
515.472,87 |
643.828,17 |
820.935,11 |
|
|
Capital
adjustments in Euros |
88,35 |
88,35 |
88,35 |
|
|
V.
Prior year earnings |
|
|
|
|
|
VI.
Prior year profit or losses |
208.050,30 |
281.469,44 |
560.610,48 |
|
|
VII.
Dividend paid during the year |
|
|
|
|
|
VIII.
Own shares for change in capital |
|
|
|
|
|
B)
DEFERRED INCOME |
329.237,24 |
407.624,19 |
503.957,26 |
|
|
Rate
difference |
329.237,24 |
407.624,19 |
503.957,26 |
|
|
C)
PROVISIONS FOR LIABILITIES AND EXPENSES |
|
|
43.671,26 |
|
|
Other
provisions |
|
|
43.671,26 |
|
|
D)
LONG TERM LIABILITIES |
413.307,19 |
987.991,35 |
750.472,21 |
|
|
I.
Bonds |
|
|
|
|
|
II.
Bank loans |
190.423,17 |
732.532,85 |
600.219,18 |
|
|
Long
term bank loans |
190.423,17 |
732.532,85 |
600.219,18 |
|
|
III.
Debts with associed and affiliated companies |
|
|
|
|
|
IV.
Other creditors |
222.884,02 |
255.458,50 |
150.253,03 |
|
|
Other
debts |
222.884,02 |
255.458,50 |
150.253,03 |
|
|
V.
Deferred debts on shares |
|
|
|
|
|
VI.
Long term debt with creditor |
|
|
|
|
|
E)
SHORT TERM LIABILITIES |
9.084.891,35 |
10.070.244,91 |
11.292.582,45 |
|
|
I.
Negotiable bonds |
|
|
|
|
|
II.
Bank loans |
4.935.109,98 |
4.873.389,76 |
4.980.919,58 |
|
|
Loans
and other debts |
4.934.638,39 |
4.872.432,26 |
4.980.452,18 |
|
|
Debt
interest |
471,59 |
957,50 |
467,40 |
|
|
III.
Short term debts with associated and affiliated companies |
|
204.260,86 |
|
|
|
With
affiliated companies |
|
204.260,86 |
|
|
|
IV.
Trade creditors |
3.805.616,90 |
4.383.472,91 |
5.855.841,96 |
|
|
Expenses |
3.805.616,90 |
4.383.472,91 |
5.855.841,96 |
|
|
V.
Other non trade payables |
329.333,28 |
593.990,19 |
440.689,72 |
|
|
Government |
250.036,92 |
487.961,31 |
362.267,59 |
|
|
Other
debts |
79.296,36 |
106.028,88 |
78.422,13 |
|
|
VI.
Provisions for current assets |
14.831,19 |
15.131,19 |
15.131,19 |
|
|
VII.
Accruals and deferred incomes |
|
|
|
|
|
F)
SHORT TERM PROVISIONS FOR LIABILITIES AND EXPENSES |
|
|
|
|
|
LIABILITIES
(A + B + C + D + E + F) |
12.088.702,85 |
13.928.901,96 |
15.509.972,67 |
Profit and Loss Account
|
(Figures
given in Euros) |
31/12/2002 (12) |
31/12/2003 (12) |
31/12/2004 (12) |
|
|
|
A)
EXPENSES (A.1 a A.15) |
|
|
|
|
|
A.1
Operating Expenses |
10.444.041,60 |
10.918.154,49 |
13.967.434,82 |
|
|
A.3.
Labor cost |
780.391,22 |
830.528,80 |
902.118,75 |
|
|
Wages |
635.702,11 |
673.524,64 |
731.617,62 |
|
|
Social
security expenses |
144.689,11 |
157.004,16 |
170.501,13 |
|
|
A.3.
Assets depreciation |
103.624,40 |
119.682,18 |
141.922,06 |
|
|
A.4.
Variance in provision for current assets |
127.360,93 |
11.197,04 |
6.523,34 |
|
|
A.5.
Other operating costs |
695.775,05 |
595.724,39 |
814.850,14 |
|
|
A.I.
OPERATING RESULT (B.1-A.1-A.2-A.3-A.4-A.5) |
508.354,44 |
449.468,42 |
604.924,82 |
|
|
A.6.
Financial expenses |
276.546,61 |
209.771,98 |
207.958,83 |
|
|
Debts
with related companies |
276.546,61 |
|
|
|
|
Other
companies debts |
|
209.771,98 |
207.958,83 |
|
|
A.7.
Variation in financial investments provision |
|
|
|
|
|
A.8.
Exchange losses |
382.766,13 |
352.854,99 |
172.667,41 |
|
|
A.II.
POSITIVE FINANCIAL RESULTS (B.2+B.3-A.6-A.7-A.8) |
|
|
134.265,50 |
|
|
A.III.
PROFIT FROM ORDINARY ACTIVITIES (A.I+A.II-B.I-B.II) |
252.840,52 |
447.660,65 |
739.190,32 |
|
|
A.9.
Variation in provision in fixed assets |
|
21.729,95 |
|
|
|
A.10.
Losses in fixed assets |
339,66 |
351,91 |
|
|
|
A.11.
Losses from shares and bonds |
|
|
|
|
|
A.12.
Extraordinary charges |
8.260,05 |
|
43.730,32 |
|
|
A.13.
Prior year’s expenses and losses |
|
|
|
|
|
A.IV.
POSITIVE EXTRAORDINARY RESULT (B.4+B.5+B.6+B.7+B.8-A.9-A.10-A.11-A.12-A.13) |
13.979,22 |
|
|
|
|
A.V.
EARNINGS / LOSS BEFORE TAXES (A.III+A.IV-B.III-B.IV) |
266.819,74 |
425.598,50 |
721.929,86 |
|
|
A.14.
Corporate Taxes |
58.769,44 |
144.129,06 |
161.319,38 |
|
|
A.15.
Other taxes |
|
|
|
|
|
A.VI.
YEAR END RESULT (PROFIT) (A.V-A.14-A.15) |
208.050,30 |
281.469,44 |
560.610,48 |
|
|
B)
INCOMES (B.1 a B.8) |
|
|
|
|
|
B.1.
Operating income |
12.659.547,64 |
12.924.755,32 |
16.437.773,93 |
|
|
Turnover |
12.659.547,64 |
12.924.755,32 |
16.383.720,40 |
|
|
Other
operating income |
|
|
54.053,53 |
|
|
B.I.
OPERATING LOSSES (A.1+A.2+A.3+A.4+A.5-B.1) |
|
|
|
|
|
B.2.
Financial Income |
47.481,59 |
44.374,94 |
45.911,91 |
|
|
In
affiliated companies |
|
13.302,83 |
16.716,33 |
|
|
Other |
47.481,59 |
31.072,11 |
29.195,58 |
|
|
B.3.
Gains on exchange |
356.317,23 |
516.444,26 |
468.979,83 |
|
|
B.II.
FINANCIAL LOSSES (A.6+A.7+A.8-B.2-B.3) |
255.513,92 |
1.807,77 |
|
|
|
B.III.
LOSSES FROM ORDINARY ACTIVITIES (B.I+B.II-A.I-A.II) |
|
|
|
|
|
B.4.
Gains from disposal of fixed assets |
|
|
|
|
|
B.5.
Gains from dealing in own shares |
|
|
|
|
|
B.6.
Paid in surplus |
|
|
|
|
|
B.7.
Extraordinary income |
22.578,93 |
19,71 |
26.469,86 |
|
|
B.8.
Prior year’s income and profits |
|
|
|
|
|
B.IV.
EXTRAORDINARY LOSSES (A.9+A.10+A.11+A.12+A.13-B.4-B.5-B.6-B.7-B.8) |
|
22.062,15 |
17.260,46 |
|
|
B.V.
LOSS BEFORE TAXES (B.III+B.IV-A.III-A.IV) |
|
|
|
|
|
B.VI.
NET LOSS (B.V+A.14+A.15) |
|
|
|
Main Ratios
|
(Figures
given in Euros) |
2.002 (12) |
2.003 (12) |
2.004 (12) |
|
|
|
ACTIVITY |
|
|
|
|
|
Increase
of the Sales Figures |
6,35 |
2,10 |
26,76 |
|
|
Assets
Turnover |
1,05 |
0,93 |
1,06 |
|
|
Productivity |
1,95 |
1,70 |
1,84 |
|
|
Increase
of the Added Value |
-18,10 |
-7,16 |
17,34 |
|
|
PROFITABILITY |
|
|
|
|
|
Economic
Profitability |
1,72 |
2,02 |
3,62 |
|
|
Financial
Profitability |
9,20 |
11,43 |
19,20 |
|
|
Financial
Expenses |
2,18 |
1,62 |
1,27 |
|
|
BALANCE
(IN DAYS OF SALES) |
|
|
|
|
|
Customers’
Credit (In days of sales) |
206,00 |
270,00 |
180,00 |
|
|
Suppliers’
Credit (In days of sales) |
131,00 |
145,00 |
151,00 |
|
|
Working
Capital (In days of sales) |
39,00 |
37,00 |
22,00 |
|
|
Working
Capital Requirement (In days of sales) |
166,00 |
164,00 |
129,00 |
|
|
Treasury
(In days of sales) |
0,00 |
0,00 |
0,00 |
|
|
BALANCE |
|
|
|
|
|
Working
Capital |
1.367.968,19 |
1.324.558,23 |
1.004.072,39 |
|
|
Working
Capital Requirement |
5.849.762,99 |
5.889.155,56 |
5.857.433,90 |
|
|
Treasury |
-4.481.794,80 |
-4.564.597,33 |
-4.853.361,51 |
|
|
Balance
Ratio |
1,84 |
1,52 |
1,31 |
|
|
SOLVENCY |
|
|
|
|
|
Borrowing
Ratio |
78,57 |
79,39 |
77,65 |
|
|
Own /
Permanent Funds |
75,28 |
63,83 |
69,22 |
|
|
Payback
Capacity |
0,74 |
0,85 |
0,73 |
|
|
LIQUIDITY |
|
|
|
|
|
General
Liquidity |
1,15 |
1,13 |
1,09 |
|
|
Immediate
Liquidity |
0,05 |
0,03 |
0,01 |
Sectorial Analysis
Summary of Assets, Liability
& Equity
|
(Figures
given in Percentages) |
Company |
Sector |
Company |
|
|
2.004 |
|
|
|
Assets |
|||
|
DUE
FROM SHAREHOLDERS FOR UNCALLED CAPITAL |
0,00 |
0,02 |
-0,02 |
|
FIXED
ASSETS |
20,64 |
26,57 |
-5,93 |
|
ACCRUED
EXPENSES |
0,08 |
0,31 |
-0,23 |
|
CURRENT
ASSETS |
79,28 |
73,11 |
6,17 |
|
TOTAL
ASSETS |
100,00 |
100,00 |
0,00 |
|
Liabilities |
|||
|
SHAREHOLDERS
EQUITY |
18,82 |
38,75 |
-19,93 |
|
ACCRUED
INCOME |
3,25 |
0,26 |
2,99 |
|
RISK
AND EXPENDITURE COVER |
0,28 |
0,17 |
0,11 |
|
LONG-TERM
CREDITORS |
4,84 |
6,88 |
-2,04 |
|
SHORT-TERM
CREDITORS |
72,81 |
53,94 |
18,87 |
|
SHORT-TERM
RISK AND EXPENDITURE COVER |
0,00 |
0,01 |
-0,01 |
|
TOTAL
LIABILITIES |
100,00 |
100,00 |
0,00 |
Analytical Account of Results
|
(Figures
given in Percentages) |
Company |
Sector |
Company |
|
|
2.004 |
|
|
|
Net
turnover |
99,67 |
99,27 |
0,40 |
|
Other
operating income |
0,33 |
0,73 |
-0,40 |
|
Production
Value |
100,00 |
100,00 |
0,00 |
|
Operating
expenses |
84,97 |
78,54 |
6,43 |
|
Other
operation expenses |
4,96 |
7,95 |
-2,99 |
|
Added
value |
10,07 |
13,51 |
-3,44 |
|
Labor
cost |
5,49 |
7,45 |
-1,96 |
|
Gross
Economic Result |
4,58 |
6,06 |
-1,48 |
|
Assets
depreciation |
0,86 |
1,32 |
-0,46 |
|
Variation
in provision for current assets |
0,04 |
0,30 |
-0,26 |
|
Net
Economic Result |
3,68 |
4,44 |
-0,76 |
|
Financial
income |
3,13 |
0,60 |
2,53 |
|
Financial
expenses |
2,32 |
0,95 |
1,36 |
|
Variation
in financial investment provision |
0,00 |
0,00 |
-0,00 |
|
Ordinary
Activities Result |
4,50 |
4,08 |
0,41 |
|
Extraordinary
income |
0,16 |
0,41 |
-0,25 |
|
Extraordinary
expenses |
0,27 |
0,22 |
0,05 |
|
Variation
in provision in fixed assets |
0,00 |
0,03 |
-0,03 |
|
Results
before Taxes |
4,39 |
4,24 |
0,15 |
|
Corporaye
taxes |
0,98 |
1,31 |
-0,33 |
|
Net
Result |
3,41 |
2,93 |
0,48 |
|
Assets
depreciation |
0,86 |
1,32 |
-0,46 |
|
Provisions
fund variation |
0,04 |
0,33 |
-0,29 |
|
Net
Self-Financing |
4,31 |
4,59 |
-0,27 |
Ratios
|
(Figures
given in ) |
Company |
Ptile25 |
Medium |
Ptile75 |
|
|
2.004 |
|
|
|
|
ACTIVITY |
|
|
|
|
|
Increase
of the Sales Figures |
26,76 |
-1,33 |
5,33 |
13,26 |
|
Assets
Turnover |
1,06 |
1,31 |
1,65 |
2,15 |
|
Fixed
Assets Turnover |
5,10 |
4,67 |
9,17 |
19,61 |
|
Increase
of the Added Value |
17,34 |
-5,60 |
5,38 |
14,86 |
|
PRODUCTIVITY |
|
|
|
|
|
Productivity |
1,84 |
1,45 |
1,80 |
2,32 |
|
Change
of Personnel Costs |
8,62 |
2,80 |
9,07 |
15,90 |
|
Average
Personnel Costs |
29.100,60 |
21.586,06 |
27.828,95 |
35.212,61 |
|
Value
Added by Employees |
53.402,87 |
37.164,07 |
50.708,88 |
72.985,12 |
|
CASH
FLOW |
|
|
|
|
|
Cash
Flow |
709.055,88 |
232.387,65 |
456.446,54 |
847.505,73 |
|
Operating
Cash Flow |
753.370,22 |
348.856,67 |
621.024,74 |
1.135.561,64 |
|
Change
in Cash Flow |
63,35 |
-19,07 |
1,16 |
24,08 |
|
PROFITABILITY |
|
|
|
|
|
Economic
Profitability |
3,62 |
1,73 |
3,49 |
6,93 |
|
Financial
Profitability |
19,20 |
5,72 |
10,98 |
18,15 |
|
Financial
Expenses |
1,27 |
0,34 |
0,70 |
1,15 |
|
Gross
Economic Profitability |
4,86 |
5,46 |
8,69 |
13,76 |
|
Gross
Financial Profitability |
25,81 |
17,33 |
26,70 |
42,04 |
|
BALANCE
(IN DAYS OF SALES) |
|
|
|
|
|
Customers’
Credit (In days of sales) |
180,00 |
74,18 |
99,59 |
125,75 |
|
Suppliers’
Credit (In days of sales) |
150,00 |
31,25 |
68,61 |
104,85 |
|
Working
Capital (In days of sales) |
22,00 |
12,06 |
36,47 |
73,51 |
|
Working
Capital Requirement (In days of sales) |
128,00 |
22,16 |
66,91 |
102,05 |
|
Treasury
(In days of sales) |
0,00 |
-52,24 |
-13,54 |
9,35 |
|
Operating
Current Assets |
270,00 |
125,11 |
165,51 |
204,59 |
|
BALANCE |
|
|
|
|
|
Working
Capital |
1.004.072,39 |
346.893,64 |
1.261.232,95 |
2.691.262,42 |
|
Working
Capital Requirement |
5.857.433,90 |
728.690,83 |
2.018.402,01 |
3.839.256,03 |
|
Treasury |
-4.853.361,51 |
-1.823.814,59 |
-470.376,35 |
307.196,45 |
|
Balance
Ratio |
1,31 |
1,22 |
1,90 |
3,62 |
|
SOLVENCY |
|
|
|
|
|
Borrowing
Ratio |
77,65 |
47,63 |
65,26 |
79,10 |
|
Own
/ Permanent Funds |
69,22 |
76,18 |
93,60 |
99,76 |
|
Payback
Capacity |
0,73 |
0,24 |
0,34 |
0,48 |
|
Long
term Indebtedness |
4,84 |
0,00 |
2,09 |
8,31 |
|
Gearing |
531,29 |
190,93 |
287,84 |
478,36 |
|
Financing
Basic Ratio |
1,00 |
1,00 |
1,00 |
1,00 |
|
Assets
Guarantee |
1,29 |
1,22 |
1,48 |
2,07 |
|
LIQUIDITY |
|
|
|
|
|
General
Liquidity |
1,09 |
1,08 |
1,30 |
1,75 |
|
Immediate
Liquidity |
0,01 |
0,03 |
0,08 |
0,22 |
RATING EXPLANATIONS
|
RATING |
STATUS |
PROPOSED CREDIT LINE |
|
|
>86 |
Aaa |
Possesses an extremely sound financial
base with the strongest capability for timely payment of interest and
principal sums |
Unlimited |
|
71-85 |
Aa |
Possesses adequate working capital. No
caution needed for credit transaction. It has above average (strong)
capability for payment of interest and principal sums |
Large |
|
56-70 |
A |
Financial & operational base are
regarded healthy. General unfavourable factors will not cause fatal effect.
Satisfactory capability for payment of interest and principal sums |
Fairly Large |
|
41-55 |
Ba |
Overall operation is considered normal.
Capable to meet normal commitments. |
Satisfactory |
|
26-40 |
B |
Unfavourable & favourable factors
carry similar weight in credit consideration. Capability to overcome
financial difficulties seems comparatively below average/normal. |
Small |
|
11-25 |
Ca |
Adverse factors are apparent. Repayment of
interest and principal sums in default or expected to be in default upon
maturity |
Limited with full security |
|
<10 |
C |
Absolute credit risk exists. Caution
needed to be exercised |
Credit not recommended |
|
NR |
In view of the lack of information, we
have no basis upon which to recommend credit dealings |
No Rating |
|