
MIRA
INFORM REPORT
|
Report Date : |
16th
November, 2006 |
IDENTIFICATION
DETAILS
|
Name : |
FACETS
PEDREROS S. A. |
|
|
|
|
Registered Office : |
Avenida Diagonal, 463 08036
Barcelona (Barcelona) |
|
|
|
|
Country : |
Spain |
|
|
|
|
Financials (as on) : |
31.12.2004 |
|
|
|
|
Date of Incorporation : |
12/01/1987 |
|
|
|
|
Legal Form : |
Joint Stock Company |
|
|
|
|
Line of Business : |
Wholesale of jewellery articles (jewels, watches,
etc.) & metals and metal ores. |
RATING & COMMENTS
|
MIRA’s Rating : |
A |
|
RATING |
STATUS |
PROPOSED CREDIT LINE |
|
|
56-70 |
A |
Financial & operational base are
regarded healthy. General unfavourable factors will not cause fatal effect.
Satisfactory capability for payment of interest and principal sums |
Fairly Large |
|
Status : |
Good |
|
|
|
|
Payment Behaviour : |
Regular
|
|
|
|
|
Litigation : |
Clear |
Company name
FACET
PEDREROS SA
TAX NUMBER
A58288168
Identification and
Characteristics
Tax Number A58288168
NAME FACET
PEDREROS SA
TRADE NAME FACET
PEDREROS, S.A.
BUSINESS ADDRESS AVENIDA
DIAGONAL, 463
Postcode 08036
BARCELONA (BARCELONA)
FORMER ADDRESS CALLE
JONQUERES, 18
Postcode 08003
BARCELONA (BARCELONA)
URL http://www.facetdiamonds.com
TELEPHONE 933633480
FAX 933633481
LEGAL FORM JOINT
STOCK COMPANY
DATE FOUNDED 12/01/1987
CAPITAL 1.138.500,00 Euros
PAID-UP CAPITAL 1.138.500,00 Euros
NUMBER OF EMPLOYEES 32
BANKS B
POPULAR OF 0002; B DE SABADELL OF 0025; DEUTSCHE
BANK
OF 0002;
ACTIVITY 1619300 - Wholesale
of jewellery articles (jewels, watches, etc.)
CNAE 5152 - Wholesale
of metals and metal ores
EXPORT COMPANY YES
IMPORT COMPANY YES
Synthesis
FINANCIAL SITUATION (Year ending: 31/12/2004)
![]()
PROFITABILITY ![]() 5/9 Medium
5/9 Medium
TREASURY ![]() 6/9 Average
6/9 Average
BALANCE SHEET ![]() 7/9 Good
7/9 Good
DEBT ![]() 5/9 Important
5/9 Important
INCIDENTS
![]()
COMMITMENTS ![]() 9/9 Respected
9/9 Respected
INCIDENTS ![]() 9/9 None
or Negligible
9/9 None
or Negligible
PREVIOUS EXPERIENCE
![]()
PREVIOUS EXPERIENCE ![]() 8/9 Favourable
8/9 Favourable
Credit Appraisal
CREDIT ACCORDING TO OBJECTIVE DATA (From 0 to 500.000,00 Euros):
FAVOURABLE TOWARDS 300.001,20 Max.
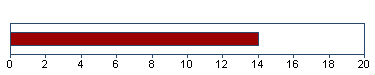
SOLVENCY RATING:
14/20 (BASED ON HOMOGENEOUS FORMULATION)
Financial Elements
Figures
given in Euros
|
|
Balance
sheet 2.002 (12) |
Balance
sheet 2.003 (12) |
Balance
sheet 2.004 (12) |
%
Sales |
|
SALES |
12.659.547,64 |
12.924.755,32 |
16.383.720,40 |
|
|
ADDED VALUE |
1.519.730,99 |
1.410.876,44 |
1.655.488,97 |
10,10 |
|
BUSINESS RESULT |
208.050,30 |
281.469,44 |
560.610,48 |
3,42 |
|
OWN FUNDS |
2.261.267,07 |
2.463.041,51 |
2.919.289,49 |
|
|
DEBT |
9.498.198,54 |
11.058.236,26 |
12.043.054,66 |
|
|
TOTAL ASSET |
12.088.702,85 |
13.928.901,96 |
15.509.972,67 |
|
The
sales of 16.383.720,40 Euros show a change of
26,76% compared with 2.003 . Between 2.002
and 2.003 , this change was 2,09% .
Added
value grew by 17,34% compared with the previous year. Shareholders
equity are 2.919.289,49 Euros for an indebtedness of
12.043.054,66 Euros
.
The
result 560.610,48 Euros means financial profitability of
19,20% and economic profitability of 3,61% . This result means
growth of 99,17% compared with the 2.003 .
THE FIGURES FOR THE LAST BALANCE
SHEET ARE RELEVANT
SOURCE: FROM THE MERCANTILE REGISTER
DATE: 17/10/2005
Auditors’ opinion
FAVOURABLE (2.004)
Auditors
C.C. AUDITORES S.A.
Comparative Sector Analysis
|
|
Company |
Sector |
Difference |
|
|
(2.004) |
|
|
|
%
of PRODUCTION VALUE |
|
|
|
|
SALES |
99,67 |
99,27 |
0,40 |
|
ADDED
VALUE |
10,07 |
13,51 |
-3,44 |
|
BUSINESS
RESULT |
3,41 |
2,93 |
0,48 |
|
%
OF TOTAL ASSETS |
|
|
|
|
OWN
FUNDS |
18,82 |
38,75 |
-19,93 |
|
DEBT |
77,65 |
61,25 |
16,40 |
Compared sector
(CNAE) : 515 -
Comercio al por mayor de productos no agrarios semielaborados, chatarra y
productos de desecho
Number of companies : 661
Size (Sales Figure) : 7.000.000,00
- 40.000.000,00 Euros
The turnover of the
company is 0,40% above the mean for the sector.
The company’s added
value was 10,07% s/ the production value, and 3,44% below the mean
for the sector.
The company’s
business result was 3,41% of the PV, 0,48% above the mean for the
sector.
The company’s own
resources are 18,82% , 19,93% below the mean for the sector.
The company’s
outside resources are 77,65% , 16,40% above the mean for the
sector.
Legal Actions
No legal incidences registered for this company in
the official source
No claims registered for this company in the
official sources
AFFECTED BY: No significant elemento
Main Board members, Directors and
Auditor
|
Position |
Surname and name |
Date
of appointment |
|
SOLE
ADMINISTRATOR |
ZEEVY PAZ |
18/11/2002 |
|
AUDITOR |
CC AUDITORES SA |
24/12/2004 |
Financial Links
|
Shareholders |
||||
|
Company Name |
CIF/Country |
|
Source |
Information Date |
|
FACET PEDREROS SA |
A58288168 |
Major.
|
OWN SOURCES |
12/05/2006 |
|
Shareholdings |
||||
|
Company Name |
CIF/Country |
Percent. |
Source |
Information Date |
|
FACET GEMS
LIMITED |
REINO UNIDO |
100,00%
|
OWN SOURCES |
12/07/2005 |
|
FRANGEM SARL |
FRANCIA |
99,98%
|
OWN SOURCES |
12/07/2005 |
|
FACET DIAMONDS
ANTWERPEN BVBA |
BÉLGICA |
99,00%
|
OWN SOURCES |
12/07/2005 |
|
FACET PEDREROS SA |
A58288168 |
0,00%
|
OWN SOURCES |
12/05/2006 |
Proceedings published in the
B.O.R.M.E. (Official Mercantile Register Gazette)
|
Proceedings |
Date |
Notice
Num. |
Mercantile
Reg. |
|
Appointments |
18/07/2006 |
368238 |
BARCELONA |
|
Registration of
accounts (2004) |
28/09/2005 |
564809 |
BARCELONA |
|
Appointments |
24/12/2004 |
534852 |
BARCELONA |
|
Registration of
accounts (2003) |
22/11/2004 |
878109 |
BARCELONA |
|
Registration of
accounts (2002) |
29/01/2004 |
044382 |
BARCELONA |
Press articles
|
|
||
|
16/02/2001 |
VANGUARDIA |
LEGAL ANNOUNCE |
|
EN JUNTA GRAL.
UNIVERSAL CELEBRADA EL 09/02/01 SE ACORDO TRASLADAR EL DOMI CILIO SOCIAL A LA
AV. DIAGONAL, 463, BIS, CUARTO, DE BARCELONA. |
||
Complementary Information
12/07/05 BLOQUE DE INVESTIGACION:
- Su domicilio social se encuentra en Av Diagonal, 463 en Barcelona.
Son las oficinas.
- Se dedica a la venta productos de joyeria.
- Realiza transacciones intracomunitarias de sus compras con Belgica,
Inglaterra y Francia.
----------------------------------------------------------------------
El bloque de Investigacion no esta sujeto a actualizaciones sistemati-
cas.Los datos mostrados fueron aportados por las fuentes consultadas en la fecha del
encabezamiento.
Remarks for customer
Here is our final
resport. Even thoudh this company is obli-ged to file their balance sheets in
the Mercantile Register,no official balance sheets are available for 2005.
Brands, Signs and Commercial
Names
|
Prevailing Brands |
|||||
|
Name: |
FACET |
||||
|
Kind
of Brand: |
JOINT |
File: |
M2092866 |
||
|
Request
Date: |
19/05/1997 |
Bulletin
Date: |
Bulletin
Date: |
Current
situation: |
APPROVED
REGISTER |
|
Types:
14 |
|
||||
|
Name: |
FACET |
||||
|
Kind
of Brand: |
JOINT |
File: |
M2092867 |
||
|
Request
Date: |
19/05/1997 |
Bulletin
Date: |
Bulletin
Date: |
Current
situation: |
APPROVED
REGISTER |
|
Types:
35 |
s |
||||
|
Prevailing Commercial
Names |
|||||
|
Name: |
FACET
PEDREROS, S.A. |
||||
|
Kind
of Brand: |
DENOMINATIVE |
File: |
N158422 |
||
|
Request
Date: |
16/11/1990 |
Bulletin
Date: |
Bulletin
Date: |
Current
situation: |
RENEWED
REGISTER |
Total
Marcas: 3
The information on the last account
contained in this report is extracted from the Mercantile Register file of the
legal address of the Company and dated 17/10/2005
Balance Sheet (ASSETS)
|
(Figures given in
Euros) |
31/12/2002 (12)
|
31/12/2003 (12)
|
31/12/2004 (12)
|
|
|
|
A) DUE FROM
SHAREHOLDERS FOR UNCALLED CAPITAL |
|
|
|
|
|
B) FIXED ASSETS |
1.626.265,49 |
2.519.053,39 |
3.201.469,03 |
|
|
I. Establishment
expenses |
|
|
|
|
|
II. Intangible
assets |
203.240,88 |
176.377,75 |
141.563,95 |
|
|
Software |
100.494,16 |
144.662,16 |
178.040,96 |
|
|
Leasing |
192.537,31 |
150.796,66 |
119.333,94 |
|
|
Amortization |
-89.790,59 |
-119.081,07 |
-155.810,95 |
|
|
III. Tangible
assets |
399.462,94 |
1.250.123,45 |
1.222.517,28 |
|
|
Property, plant
and equipment |
|
849.811,42 |
849.811,42 |
|
|
Machinery,
equipment and other |
22.232,10 |
27.205,10 |
30.273,57 |
|
|
Other property
plant and equipement |
417.173,86 |
444.077,17 |
461.285,11 |
|
|
Other assets |
108.169,24 |
166.849,40 |
224.159,00 |
|
|
Depreciation |
-148.112,26 |
-237.819,64 |
-343.011,82 |
|
|
IV. Financial
assets |
917.006,47 |
985.996,99 |
1.730.832,60 |
|
|
Shares in
affiliated companies |
91.518,17 |
91.518,17 |
629.652,34 |
|
|
Loans to
affiliated companies |
461.121,12 |
577.813,98 |
551.588,24 |
|
|
Other loans |
267.340,20 |
250.777,37 |
496.422,03 |
|
|
Long term
deposits and guarantees |
125.287,03 |
115.877,47 |
103.159,99 |
|
|
Provisions |
-28.260,05 |
-49.990,00 |
-49.990,00 |
|
|
V. Owners equity |
106.555,20 |
106.555,20 |
106.555,20 |
|
|
VI. Long term
trade liabilities |
|
|
|
|
|
C) DEFERRED
EXPENSES |
9.577,82 |
15.045,43 |
11.848,80 |
|
|
D) CURRENT ASSETS |
10.452.859,54 |
11.394.803,14 |
12.296.654,84 |
|
|
I. Not paid in
shareholder capital |
|
|
|
|
|
II. Inventory |
2.740.983,00 |
1.383.152,45 |
3.952.965,74 |
|
|
Goods available
for sale |
|
1.383.152,45 |
3.952.965,74 |
|
|
Raw material
inventory |
2.740.983,00 |
|
|
|
|
III. Debtors |
7.258.561,36 |
9.685.723,65 |
8.206.715,41 |
|
|
Clients |
6.278.701,59 |
7.687.692,16 |
7.815.288,65 |
|
|
Amounts owned by
affiliated companies |
1.152.022,48 |
2.159.740,70 |
558.608,65 |
|
|
Other debts |
24.957,04 |
25.257,05 |
25.542,03 |
|
|
Labor costs |
15.096,01 |
14.109,93 |
5.535,24 |
|
|
Taxes refunds |
33.479,43 |
28.223,48 |
21.971,11 |
|
|
Provisions |
-245.695,19 |
-229.299,67 |
-220.230,27 |
|
|
IV. Short term
financial assets |
11.920,11 |
285,48 |
|
|
|
Other loans |
11.920,11 |
285,48 |
|
|
|
V. Short term
owners equity |
|
|
|
|
|
VI. Cash |
441.395,07 |
308.506,95 |
127.558,07 |
|
|
VII. Prepaid
expenses and accrued income |
|
17.134,61 |
9.415,62 |
|
|
ASSETS (A + B + C
+ D) |
12.088.702,85 |
13.928.901,96 |
15.509.972,67 |
Balance Sheet (LIABILITIES)
|
(Figures given in
Euros) |
31/12/2002 (12)
|
31/12/2003 (12)
|
31/12/2004 (12)
|
|
|
|
A) SHAREHOLDERS
EQUITY |
2.261.267,07 |
2.463.041,51 |
2.919.289,49 |
|
|
I. Capital |
1.138.500,00 |
1.138.500,00 |
1.138.500,00 |
|
|
II. Premium share
account |
64.900,00 |
64.900,00 |
64.900,00 |
|
|
III. Revaluation
reserve |
|
|
|
|
|
IV. Reserves |
849.816,77 |
978.172,07 |
1.155.279,01 |
|
|
Retained earnings |
227.700,35 |
227.700,35 |
227.700,35 |
|
|
Sinking fund from
owner equity |
106.555,20 |
106.555,20 |
106.555,20 |
|
|
Other funds |
515.472,87 |
643.828,17 |
820.935,11 |
|
|
Capital
adjustments in Euros |
88,35 |
88,35 |
88,35 |
|
|
V. Prior year
earnings |
|
|
|
|
|
VI. Prior year
profit or losses |
208.050,30 |
281.469,44 |
560.610,48 |
|
|
VII. Dividend
paid during the year |
|
|
|
|
|
VIII. Own shares
for change in capital |
|
|
|
|
|
B) DEFERRED
INCOME |
329.237,24 |
407.624,19 |
503.957,26 |
|
|
Rate difference |
329.237,24 |
407.624,19 |
503.957,26 |
|
|
C) PROVISIONS FOR
LIABILITIES AND EXPENSES |
|
|
43.671,26 |
|
|
Other provisions |
|
|
43.671,26 |
|
|
D) LONG TERM
LIABILITIES |
413.307,19 |
987.991,35 |
750.472,21 |
|
|
I. Bonds |
|
|
|
|
|
II. Bank loans |
190.423,17 |
732.532,85 |
600.219,18 |
|
|
Long term bank
loans |
190.423,17 |
732.532,85 |
600.219,18 |
|
|
III. Debts with
associed and affiliated companies |
|
|
|
|
|
IV. Other
creditors |
222.884,02 |
255.458,50 |
150.253,03 |
|
|
Other debts |
222.884,02 |
255.458,50 |
150.253,03 |
|
|
V. Deferred debts
on shares |
|
|
|
|
|
VI. Long term
debt with creditor |
|
|
|
|
|
E) SHORT TERM
LIABILITIES |
9.084.891,35 |
10.070.244,91 |
11.292.582,45 |
|
|
I. Negotiable
bonds |
|
|
|
|
|
II. Bank loans |
4.935.109,98 |
4.873.389,76 |
4.980.919,58 |
|
|
Loans and other
debts |
4.934.638,39 |
4.872.432,26 |
4.980.452,18 |
|
|
Debt interest |
471,59 |
957,50 |
467,40 |
|
|
III. Short term
debts with associated and affiliated companies |
|
204.260,86 |
|
|
|
With affiliated
companies |
|
204.260,86 |
|
|
|
IV. Trade
creditors |
3.805.616,90 |
4.383.472,91 |
5.855.841,96 |
|
|
Expenses |
3.805.616,90 |
4.383.472,91 |
5.855.841,96 |
|
|
V. Other non
trade payables |
329.333,28 |
593.990,19 |
440.689,72 |
|
|
Government |
250.036,92 |
487.961,31 |
362.267,59 |
|
|
Other debts |
79.296,36 |
106.028,88 |
78.422,13 |
|
|
VI. Provisions
for current assets |
14.831,19 |
15.131,19 |
15.131,19 |
|
|
VII. Accruals and
deferred incomes |
|
|
|
|
|
F) SHORT TERM
PROVISIONS FOR LIABILITIES AND EXPENSES |
|
|
|
|
|
LIABILITIES (A +
B + C + D + E + F) |
12.088.702,85 |
13.928.901,96 |
15.509.972,67 |
Profit and Loss Account
|
(Figures given in
Euros) |
31/12/2002 (12)
|
31/12/2003 (12)
|
31/12/2004 (12)
|
|
|
|
A) EXPENSES (A.1
a A.15) |
|
|
|
|
|
A.1 Operating
Expenses |
10.444.041,60 |
10.918.154,49 |
13.967.434,82 |
|
|
A.3. Labor cost |
780.391,22 |
830.528,80 |
902.118,75 |
|
|
Wages |
635.702,11 |
673.524,64 |
731.617,62 |
|
|
Social security
expenses |
144.689,11 |
157.004,16 |
170.501,13 |
|
|
A.3. Assets
depreciation |
103.624,40 |
119.682,18 |
141.922,06 |
|
|
A.4. Variance in
provision for current assets |
127.360,93 |
11.197,04 |
6.523,34 |
|
|
A.5. Other
operating costs |
695.775,05 |
595.724,39 |
814.850,14 |
|
|
A.I. OPERATING
RESULT (B.1-A.1-A.2-A.3-A.4-A.5) |
508.354,44 |
449.468,42 |
604.924,82 |
|
|
A.6. Financial
expenses |
276.546,61 |
209.771,98 |
207.958,83 |
|
|
Debts with
related companies |
276.546,61 |
|
|
|
|
Other companies
debts |
|
209.771,98 |
207.958,83 |
|
|
A.7. Variation in
financial investments provision |
|
|
|
|
|
A.8. Exchange
losses |
382.766,13 |
352.854,99 |
172.667,41 |
|
|
A.II. POSITIVE
FINANCIAL RESULTS (B.2+B.3-A.6-A.7-A.8) |
|
|
134.265,50 |
|
|
A.III. PROFIT
FROM ORDINARY ACTIVITIES (A.I+A.II-B.I-B.II) |
252.840,52 |
447.660,65 |
739.190,32 |
|
|
A.9. Variation in
provision in fixed assets |
|
21.729,95 |
|
|
|
A.10. Losses in
fixed assets |
339,66 |
351,91 |
|
|
|
A.11. Losses from
shares and bonds |
|
|
|
|
|
A.12.
Extraordinary charges |
8.260,05 |
|
43.730,32 |
|
|
A.13. Prior year’s
expenses and losses |
|
|
|
|
|
A.IV. POSITIVE
EXTRAORDINARY RESULT (B.4+B.5+B.6+B.7+B.8-A.9-A.10-A.11-A.12-A.13) |
13.979,22 |
|
|
|
|
A.V. EARNINGS /
LOSS BEFORE TAXES (A.III+A.IV-B.III-B.IV) |
266.819,74 |
425.598,50 |
721.929,86 |
|
|
A.14. Corporate
Taxes |
58.769,44 |
144.129,06 |
161.319,38 |
|
|
A.15. Other taxes |
|
|
|
|
|
A.VI. YEAR END
RESULT (PROFIT) (A.V-A.14-A.15) |
208.050,30 |
281.469,44 |
560.610,48 |
|
|
B) INCOMES (B.1 a
B.8) |
|
|
|
|
|
B.1. Operating
income |
12.659.547,64 |
12.924.755,32 |
16.437.773,93 |
|
|
Turnover |
12.659.547,64 |
12.924.755,32 |
16.383.720,40 |
|
|
Other operating
income |
|
|
54.053,53 |
|
|
B.I. OPERATING
LOSSES (A.1+A.2+A.3+A.4+A.5-B.1) |
|
|
|
|
|
B.2. Financial
Income |
47.481,59 |
44.374,94 |
45.911,91 |
|
|
In affiliated
companies |
|
13.302,83 |
16.716,33 |
|
|
Other |
47.481,59 |
31.072,11 |
29.195,58 |
|
|
B.3. Gains on
exchange |
356.317,23 |
516.444,26 |
468.979,83 |
|
|
B.II. FINANCIAL
LOSSES (A.6+A.7+A.8-B.2-B.3) |
255.513,92 |
1.807,77 |
|
|
|
B.III. LOSSES
FROM ORDINARY ACTIVITIES (B.I+B.II-A.I-A.II) |
|
|
|
|
|
B.4. Gains from
disposal of fixed assets |
|
|
|
|
|
B.5. Gains from
dealing in own shares |
|
|
|
|
|
B.6. Paid in
surplus |
|
|
|
|
|
B.7.
Extraordinary income |
22.578,93 |
19,71 |
26.469,86 |
|
|
B.8. Prior year’s
income and profits |
|
|
|
|
|
B.IV.
EXTRAORDINARY LOSSES (A.9+A.10+A.11+A.12+A.13-B.4-B.5-B.6-B.7-B.8) |
|
22.062,15 |
17.260,46 |
|
|
B.V. LOSS BEFORE
TAXES (B.III+B.IV-A.III-A.IV) |
|
|
|
|
|
B.VI. NET LOSS
(B.V+A.14+A.15) |
|
|
|
Main Ratios
|
(Figures given in
Euros) |
2.002 (12)
|
2.003 (12)
|
2.004 (12)
|
|
|
|
ACTIVITY |
|
|
|
|
|
Increase of the
Sales Figures |
6,35 |
2,10 |
26,76 |
|
|
Assets Turnover |
1,05 |
0,93 |
1,06 |
|
|
Productivity |
1,95 |
1,70 |
1,84 |
|
|
Increase of the
Added Value |
-18,10 |
-7,16 |
17,34 |
|
|
PROFITABILITY |
|
|
|
|
|
Economic
Profitability |
1,72 |
2,02 |
3,62 |
|
|
Financial
Profitability |
9,20 |
11,43 |
19,20 |
|
|
Financial
Expenses |
2,18 |
1,62 |
1,27 |
|
|
BALANCE (IN DAYS
OF SALES) |
|
|
|
|
|
Customers’ Credit
(In days of sales) |
206,00 |
270,00 |
180,00 |
|
|
Suppliers’ Credit
(In days of sales) |
131,00 |
145,00 |
151,00 |
|
|
Working Capital
(In days of sales) |
39,00 |
37,00 |
22,00 |
|
|
Working Capital
Requirement (In days of sales) |
166,00 |
164,00 |
129,00 |
|
|
Treasury (In days
of sales) |
0,00 |
0,00 |
0,00 |
|
|
BALANCE |
|
|
|
|
|
Working Capital |
1.367.968,19 |
1.324.558,23 |
1.004.072,39 |
|
|
Working Capital
Requirement |
5.849.762,99 |
5.889.155,56 |
5.857.433,90 |
|
|
Treasury |
-4.481.794,80 |
-4.564.597,33 |
-4.853.361,51 |
|
|
Balance Ratio |
1,84 |
1,52 |
1,31 |
|
|
SOLVENCY |
|
|
|
|
|
Borrowing Ratio |
78,57 |
79,39 |
77,65 |
|
|
Own / Permanent
Funds |
75,28 |
63,83 |
69,22 |
|
|
Payback Capacity |
0,74 |
0,85 |
0,73 |
|
|
LIQUIDITY |
|
|
|
|
|
General Liquidity |
1,15 |
1,13 |
1,09 |
|
|
Immediate
Liquidity |
0,05 |
0,03 |
0,01 |
Sectorial Analysis
Summary of Assets, Liability
& Equity
|
(Figures given in
Percentages) |
Company |
Sector |
Company |
|
|
2.004 |
|
|
|
Assets |
|||
|
DUE
FROM SHAREHOLDERS FOR UNCALLED CAPITAL |
0,00 |
0,02 |
-0,02 |
|
FIXED
ASSETS |
20,64 |
26,57 |
-5,93 |
|
ACCRUED
EXPENSES |
0,08 |
0,31 |
-0,23 |
|
CURRENT
ASSETS |
79,28 |
73,11 |
6,17 |
|
TOTAL
ASSETS |
100,00 |
100,00 |
0,00 |
|
Liabilities |
|||
|
SHAREHOLDERS
EQUITY |
18,82 |
38,75 |
-19,93 |
|
ACCRUED
INCOME |
3,25 |
0,26 |
2,99 |
|
RISK
AND EXPENDITURE COVER |
0,28 |
0,17 |
0,11 |
|
LONG-TERM
CREDITORS |
4,84 |
6,88 |
-2,04 |
|
SHORT-TERM
CREDITORS |
72,81 |
53,94 |
18,87 |
|
SHORT-TERM
RISK AND EXPENDITURE COVER |
0,00 |
0,01 |
-0,01 |
|
TOTAL
LIABILITIES |
100,00 |
100,00 |
0,00 |
Analytical Account of Results
|
(Figures given in
Percentages) |
Company |
Sector |
Company |
|
|
2.004 |
|
|
|
Net
turnover |
99,67 |
99,27 |
0,40 |
|
Other
operating income |
0,33 |
0,73 |
-0,40 |
|
Production
Value |
100,00 |
100,00 |
0,00 |
|
Operating
expenses |
84,97 |
78,54 |
6,43 |
|
Other
operation expenses |
4,96 |
7,95 |
-2,99 |
|
Added
value |
10,07 |
13,51 |
-3,44 |
|
Labor
cost |
5,49 |
7,45 |
-1,96 |
|
Gross
Economic Result |
4,58 |
6,06 |
-1,48 |
|
Assets
depreciation |
0,86 |
1,32 |
-0,46 |
|
Variation
in provision for current assets |
0,04 |
0,30 |
-0,26 |
|
Net
Economic Result |
3,68 |
4,44 |
-0,76 |
|
Financial
income |
3,13 |
0,60 |
2,53 |
|
Financial
expenses |
2,32 |
0,95 |
1,36 |
|
Variation
in financial investment provision |
0,00 |
0,00 |
-0,00 |
|
Ordinary
Activities Result |
4,50 |
4,08 |
0,41 |
|
Extraordinary
income |
0,16 |
0,41 |
-0,25 |
|
Extraordinary
expenses |
0,27 |
0,22 |
0,05 |
|
Variation
in provision in fixed assets |
0,00 |
0,03 |
-0,03 |
|
Results
before Taxes |
4,39 |
4,24 |
0,15 |
|
Corporaye
taxes |
0,98 |
1,31 |
-0,33 |
|
Net
Result |
3,41 |
2,93 |
0,48 |
|
Assets
depreciation |
0,86 |
1,32 |
-0,46 |
|
Provisions
fund variation |
0,04 |
0,33 |
-0,29 |
|
Net
Self-Financing |
4,31 |
4,59 |
-0,27 |
Ratios
|
(Figures given in
) |
Company |
Ptile25
|
Medium
|
Ptile75
|
|
|
2.004 |
|
|
|
|
ACTIVITY |
|
|
|
|
|
Increase
of the Sales Figures |
26,76 |
-1,33 |
5,33 |
13,26 |
|
Assets
Turnover |
1,06 |
1,31 |
1,65 |
2,15 |
|
Fixed
Assets Turnover |
5,10 |
4,67 |
9,17 |
19,61 |
|
Increase
of the Added Value |
17,34 |
-5,60 |
5,38 |
14,86 |
|
PRODUCTIVITY |
|
|
|
|
|
Productivity |
1,84 |
1,45 |
1,80 |
2,32 |
|
Change
of Personnel Costs |
8,62 |
2,80 |
9,07 |
15,90 |
|
Average
Personnel Costs |
29.100,60 |
21.586,06 |
27.828,95 |
35.212,61 |
|
Value
Added by Employees |
53.402,87 |
37.164,07 |
50.708,88 |
72.985,12 |
|
CASH FLOW |
|
|
|
|
|
Cash
Flow |
709.055,88 |
232.387,65 |
456.446,54 |
847.505,73 |
|
Operating
Cash Flow |
753.370,22 |
348.856,67 |
621.024,74 |
1.135.561,64 |
|
Change
in Cash Flow |
63,35 |
-19,07 |
1,16 |
24,08 |
|
PROFITABILITY |
|
|
|
|
|
Economic
Profitability |
3,62 |
1,73 |
3,49 |
6,93 |
|
Financial
Profitability |
19,20 |
5,72 |
10,98 |
18,15 |
|
Financial
Expenses |
1,27 |
0,34 |
0,70 |
1,15 |
|
Gross
Economic Profitability |
4,86 |
5,46 |
8,69 |
13,76 |
|
Gross
Financial Profitability |
25,81 |
17,33 |
26,70 |
42,04 |
|
BALANCE (IN DAYS
OF SALES) |
|
|
|
|
|
Customers’
Credit (In days of sales) |
180,00 |
74,18 |
99,59 |
125,75 |
|
Suppliers’
Credit (In days of sales) |
150,00 |
31,25 |
68,61 |
104,85 |
|
Working
Capital (In days of sales) |
22,00 |
12,06 |
36,47 |
73,51 |
|
Working
Capital Requirement (In days of sales) |
128,00 |
22,16 |
66,91 |
102,05 |
|
Treasury
(In days of sales) |
0,00 |
-52,24 |
-13,54 |
9,35 |
|
Operating
Current Assets |
270,00 |
125,11 |
165,51 |
204,59 |
|
BALANCE |
|
|
|
|
|
Working
Capital |
1.004.072,39 |
346.893,64 |
1.261.232,95 |
2.691.262,42 |
|
Working
Capital Requirement |
5.857.433,90 |
728.690,83 |
2.018.402,01 |
3.839.256,03 |
|
Treasury |
-4.853.361,51 |
-1.823.814,59 |
-470.376,35 |
307.196,45 |
|
Balance
Ratio |
1,31 |
1,22 |
1,90 |
3,62 |
|
SOLVENCY |
|
|
|
|
|
Borrowing
Ratio |
77,65 |
47,63 |
65,26 |
79,10 |
|
Own
/ Permanent Funds |
69,22 |
76,18 |
93,60 |
99,76 |
|
Payback
Capacity |
0,73 |
0,24 |
0,34 |
0,48 |
|
Long
term Indebtedness |
4,84 |
0,00 |
2,09 |
8,31 |
|
Gearing |
531,29 |
190,93 |
287,84 |
478,36 |
|
Financing
Basic Ratio |
1,00 |
1,00 |
1,00 |
1,00 |
|
Assets
Guarantee |
1,29 |
1,22 |
1,48 |
2,07 |
|
LIQUIDITY |
|
|
|
|
|
General
Liquidity |
1,09 |
1,08 |
1,30 |
1,75 |
|
Immediate
Liquidity |
0,01 |
0,03 |
0,08 |
0,22 |
The date
when this report was last updated is 30/10/2006.
This company was last displayed
on 15/11/2006,
it has been viewed 10 times
in the last quarter and 213 times in total .
RATING EXPLANATIONS
|
RATING |
STATUS |
PROPOSED CREDIT LINE |
|
|
>86 |
Aaa |
Possesses an extremely sound financial
base with the strongest capability for timely payment of interest and
principal sums |
Unlimited |
|
71-85 |
Aa |
Possesses adequate working capital. No
caution needed for credit transaction. It has above average (strong) capability
for payment of interest and principal sums |
Large |
|
56-70 |
A |
Financial & operational base are
regarded healthy. General unfavourable factors will not cause fatal effect.
Satisfactory capability for payment of interest and principal sums |
Fairly Large |
|
41-55 |
Ba |
Overall operation is considered normal.
Capable to meet normal commitments. |
Satisfactory |
|
26-40 |
B |
Unfavourable & favourable factors
carry similar weight in credit consideration. Capability to overcome
financial difficulties seems comparatively below average/normal. |
Small |
|
11-25 |
Ca |
Adverse factors are apparent. Repayment of
interest and principal sums in default or expected to be in default upon
maturity |
Limited with full security |
|
<10 |
C |
Absolute credit risk exists. Caution
needed to be exercised |
Credit not recommended |
|
NR |
In view of the lack of information, we
have no basis upon which to recommend credit dealings |
No Rating |
|