MIRA
INFORM REPORT
|
Report Date : |
21st
November, 2006 |
IDENTIFICATION
DETAILS
|
Name : |
AZULEJOS
VIVES S.A. |
|
|
|
|
Registered Office : |
Carretera Castellon - Teruel Km, 23 12110
Alcora (Castellon) |
|
|
|
|
Country : |
Spain |
|
|
|
|
Financials (as on) : |
31.12.2000 |
|
|
|
|
Date of Incorporation : |
14.09.1957 |
|
|
|
|
Legal Form : |
Joint Stock Company |
|
|
|
|
Line of Business : |
Manufacture of ceramic tiles and flags |
RATING & COMMENTS
|
MIRA’s Rating : |
B |
|
RATING |
STATUS |
PROPOSED CREDIT LINE |
|
|
26-40 |
B |
Unfavourable & favourable factors carry
similar weight in credit consideration. Capability to overcome financial
difficulties seems comparatively below average/normal. |
Small |
|
Maximum Credit Limit : |
500.000,00 Euros |
|
|
|
|
Status : |
Moderate
|
|
|
|
|
Payment Behaviour : |
Unknown
|
|
|
|
|
Litigation : |
Clear |
Company name
AZULEJOS
VIVES S.A.
TAX NUMBER
A12006177
Identification and
Characteristics
Tax Number A12006177
NAME AZULEJOS
VIVES S.A.
BUSINESS ADDRESS CARRETERA
CASTELLON - TERUEL KM, 23
Postcode 12110
ALCORA (CASTELLON)
URL http://www.vivesceramica.com
TELEPHONE 964360725
FAX 964362017
LEGAL FORM JOINT
STOCK COMPANY
DATE FOUNDED 14/09/1957
CAPITAL 784.320,80 Euros
PAID-UP CAPITAL 784.320,80 Euros
NUMBER OF EMPLOYEES 200
BANKS DEUTSCHE
BANK OF 0077; BSCH OF 6216; B DE SABADELL
OF 0275;
ACTIVITY 1247200 - Mfg.
of ceramic tiles & flags
CNAE 2630 - Manufacture
of ceramic tiles and flags
EXPORT COMPANY YES
Synthesis
INCIDENTS
![]()
COMMITMENTS ![]() 9/9 Respected
9/9 Respected
INCIDENTS ![]() 9/9 None
or Negligible
9/9 None
or Negligible
PREVIOUS EXPERIENCE
![]()
PREVIOUS EXPERIENCE ![]() 6/9 Average
6/9 Average
Credit Appraisal
CREDIT ACCORDING TO OBJECTIVE DATA (From 0 to 500.000,00 Euros):
FAVOURABLE TOWARDS 53.490,08 Max. Euros
CREDIT ACCORDING TO OBJECTIVE DATA (From 0 to 500.000,00 Euros):
Prudence advised.
SOLVENCY RATING:
6/20 (BASED ON HOMOGENEOUS FORMULATION)
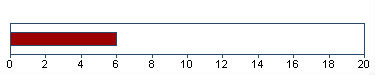
Analysis made on 20/11/2006
Financial Elements
Figures given in
Euros
|
|
Balance
sheet 1.998 (12) |
Balance
sheet 1.999 (12) |
Balance
sheet 2.000 (12) |
%
Sales |
|
SALES |
15.988.418,50 |
17.785.120,14 |
16.375.247,92 |
|
|
ADDED VALUE |
5.870.391,74 |
5.822.887,74 |
5.624.535,72 |
34,35 |
|
BUSINESS RESULT |
1.844.944,89 |
2.575.366,92 |
1.799.989,18 |
10,99 |
|
OWN FUNDS |
34.292.608,75 |
36.867.975,67 |
24.487.450,87 |
|
|
DEBT |
2.795.036,84 |
2.839.986,54 |
2.753.861,50 |
|
|
TOTAL ASSET |
37.087.645,60 |
39.707.962,21 |
27.241.312,37 |
|
The sales of 16.375.247,92 Euros show a change of
-7,93% compared with 1.999 . Between 1.998
and 1.999 , this change was 11,24% .
Added value grew by -3,41% compared with the previous year. Shareholders equity are 24.487.450,87 Euros for an indebtedness of 2.753.861,50 Euros .
The result 1.799.989,18 Euros means financial
profitability of 7,35% and economic profitability of
6,61% . This result means growth of -30,11% compared
with the 1.999 .
THE FIGURES FOR THE LAST BALANCE
SHEET ARE RELEVANT
SOURCE: FROM THE MERCANTILE REGISTER
DATE: 03/01/2003
Auditors’ opinion
FAVOURABLE WITH RESERVATIONS (2.000)
Auditors
PRICE WATERHOUSE AUDITORES S.A.
Comparative Sector Analysis
|
|
Company |
Sector |
Difference |
|
|
(2.000) |
|
|
|
%
of PRODUCTION VALUE |
|
|
|
|
SALES |
99,71 |
99,16 |
0,55 |
|
ADDED
VALUE |
34,25 |
36,30 |
-2,05 |
|
BUSINESS
RESULT |
10,96 |
2,92 |
8,04 |
|
%
OF TOTAL ASSETS |
|
|
|
|
OWN
FUNDS |
89,89 |
39,44 |
50,45 |
|
DEBT |
10,11 |
60,56 |
-50,45 |
Compared sector
(CNAE) : 263 -
Fabricación de azulejos y baldosas de cerámica
Number of companies : 85
Size (Sales Figure) : 7.000.000,00
- 40.000.000,00 Euros
The turnover of the
company is 0,55% above the mean for the sector.
The company’s added
value was 34,25% s/ the production value, and 2,05% below the mean
for the sector.
The company’s
business result was 10,96% of the PV, 8,04% above the mean for the
sector.
The company’s own
resources are 89,89% , 50,45% above the mean for the sector.
The company’s
outside resources are 10,11% , 50,45% below the mean for the
sector.
Legal Actions
No legal incidences registered for this company in
the official source
No claims registered for this company in the
official sources
AFFECTED BY: No significant elemento
Main Board members, Directors and
Auditor
Position Surname
and name Date of
appointment
SOLE ADMINISTRATOR ALCALATEN
SOCIEDAD LIMITADA 31/10/2002
AUDITOR PRICEWATERHOUSECOOPERS
AUDITORES S L 05/12/2002
Financial Links
Shareholders
Company Name CIF/Country Source Information
Date
AZULEJOS VIVES S.A. A12006177 Indet. OWN
SOURCES 26/06/2006
ALCALATEN SOCIEDAD
LIMITADA. B12051801 Indet. OWN
SOURCES 26/06/2006
Shareholdings
Company Name CIF/Country Percent. Source Information
Date
ARTE Y DISENO
CERAMICO SA A12220679 45,92% OWN
SOURCES 19/12/2005
AZULEJOS VIVES S.A. A12006177 0,00% OWN
SOURCES 26/06/2006
Proceedings published in the
B.O.R.M.E. (Official Mercantile Register Gazette)
Proceedings Date Notice
Num. Mercantile Reg.
Misprint 28/12/2005 550661 CASTELLON
Re-elections 05/12/2002 488517 CASTELLON
Registration of accounts (2000) 18/11/2002 792897 CASTELLON
Registration of accounts (1999) 18/11/2002 792837 CASTELLON
Capital decrease 31/10/2002 437502 CASTELLON
Complementary Information
20/11/06 BLOQUE DE INVESTIGACION:
- Su actividad concreta es la fabricacion de revestimientos ceramicos.
- Domicilio Social:Cr de Castellon-Teruel Km 23 Apdo 14 Alcora
Castellon. Local esta dedicado a oficina, factoria y almacen ubicado en zona industrial y
lo detenta en propiedad (sin verificacion registral)
----------------------------------------------------------------------
El Bloque de investigacion no esta sujeto a actualizaciones sistemati
cas.Los datos mostrados fueron aportados por las fuentes consultadasen
la fecha de encabezamiento.
Remarks for customer
Bank sources inform
us that the company has a correct function.Here is our final report. Even
though this company is obliged to file their balance sheets in the Mercantile
Register, no official balance sheets are available since 2.000
The information on the last account
contained in this report is extracted from the Mercantile Register file of the
legal address of the Company and dated 03/01/2003
Balance Sheet (ASSETS)
|
(Figures given in
Euros) |
31/12/1998 (12) |
31/12/1999 (12) |
31/12/2000 (12) |
|
|
|
A) DUE FROM
SHAREHOLDERS FOR UNCALLED CAPITAL |
|
|
|
|
|
B) FIXED ASSETS |
15.351.778,39 |
9.746.240,67 |
9.415.407,55 |
|
|
I. Establishment
expenses |
|
|
|
|
|
II. Intangible
assets |
919,55 |
973,64 |
865,46 |
|
|
Concessions,
patents,licences , trademarks |
|
1.033,74 |
1.033,74 |
|
|
Prepayments |
919,55 |
|
|
|
|
Amortization |
|
-60,10 |
-168,28 |
|
|
III. Tangible
assets |
4.499.555,25 |
4.283.305,09 |
4.138.359,00 |
|
|
Property, plant
and equipment |
3.705.011,24 |
3.789.213,03 |
3.789.213,03 |
|
|
Machinery,
equipment and other |
9.151.082,42 |
9.234.725,28 |
9.401.788,61 |
|
|
Other property
plant and equipement |
647.350,14 |
641.604,46 |
642.313,66 |
|
|
Other assets |
347.715,55 |
347.715,55 |
347.715,55 |
|
|
Depreciation |
-9.351.604,10 |
-9.729.953,24 |
-10.042.671,86 |
|
|
IV. Financial
assets |
8.446.642,15 |
5.461.961,94 |
4.860.949,84 |
|
|
Loans to affiliated
companies |
|
601.012,10 |
|
|
|
Shares in
associated companies |
344.980,95 |
344.980,95 |
344.980,95 |
|
|
Loans to
associated companies |
1.021.720,58 |
|
|
|
|
Securities |
4.517.753,90 |
4.517.753,90 |
4.517.753,90 |
|
|
Other loans |
2.554.301,44 |
|
|
|
|
Long term
deposits and guarantees |
10.151,09 |
480,81 |
480,81 |
|
|
Provisions |
-2.265,82 |
-2.265,82 |
-2.265,82 |
|
|
V. Owners equity |
2.404.661,45 |
|
415.233,25 |
|
|
VI. Long term
trade liabilities |
|
|
|
|
|
C) DEFERRED
EXPENSES |
|
|
|
|
|
D) CURRENT ASSETS |
21.735.867,20 |
29.961.721,54 |
17.825.904,82 |
|
|
I. Not paid in shareholder
capital |
|
|
|
|
|
II. Inventory |
8.762.203,55 |
8.096.768,96 |
6.954.635,61 |
|
|
Raw material
inventory |
698.135,66 |
780.684,67 |
718.822,50 |
|
|
Work in Progress |
59.073,48 |
76.340,56 |
104.912,67 |
|
|
Finished goods |
8.004.994,41 |
7.239.743,73 |
6.130.900,44 |
|
|
III. Debtors |
5.210.564,59 |
6.597.983,00 |
6.702.222,54 |
|
|
Clients |
4.939.159,54 |
6.783.599,58 |
4.073.846,36 |
|
|
Amounts owned by
associated companies |
96.967,29 |
|
2.813.842,51 |
|
|
Other debts |
368.654,81 |
5.078,55 |
5.078,55 |
|
|
Provisions |
-194.217,06 |
-190.695,13 |
-190.544,88 |
|
|
IV. Short term
financial assets |
2.747.983,60 |
8.132.114,48 |
|
|
|
Receivables in
affiliated companies |
|
8.132.114,48 |
|
|
|
Short term
investment |
2.701.206,83 |
|
|
|
|
Other loans |
46.776,77 |
|
|
|
|
V. Short term
owners equity |
|
|
|
|
|
VI. Cash |
5.013.636,96 |
7.130.335,48 |
4.168.217,28 |
|
|
VII. Prepaid
expenses and accrued income |
1.478,49 |
4.519,61 |
829,40 |
|
|
ASSETS (A + B + C
+ D) |
37.087.645,60 |
39.707.962,21 |
27.241.312,37 |
Balance Sheet (LIABILITIES)
|
(Figures given in
Euros) |
31/12/1998 (12) |
31/12/1999 (12) |
31/12/2000 (12) |
|
|
|
A) SHAREHOLDERS
EQUITY |
34.292.608,75 |
36.867.975,67 |
24.487.450,87 |
|
|
I. Capital |
784.320,80 |
784.320,80 |
784.320,80 |
|
|
II. Premium share
account |
|
|
|
|
|
III. Revaluation
reserve |
945.361,99 |
945.361,99 |
945.361,99 |
|
|
IV. Reserves |
30.717.981,08 |
32.562.925,97 |
20.957.778,90 |
|
|
Retained earnings |
183.320,71 |
183.320,71 |
183.320,71 |
|
|
Sinking fund from
owner equity |
2.404.661,45 |
|
415.233,25 |
|
|
Statuatory
reserve |
3.882,54 |
3.882,54 |
3.882,54 |
|
|
Other funds |
28.126.116,38 |
32.375.722,72 |
20.355.342,40 |
|
|
V. Prior year
earnings |
|
|
|
|
|
VI. Prior year
profit or losses |
1.844.944,89 |
2.575.366,92 |
1.799.989,18 |
|
|
VII. Dividend
paid during the year |
|
|
|
|
|
VIII. Own shares
for change in capital |
|
|
|
|
|
B) DEFERRED
INCOME |
|
|
|
|
|
C) PROVISIONS FOR
LIABILITIES AND EXPENSES |
|
|
|
|
|
D) LONG TERM
LIABILITIES |
|
|
|
|
|
I. Bonds |
|
|
|
|
|
II. Bank loans |
|
|
|
|
|
III. Debts with
associed and affiliated companies |
|
|
|
|
|
IV. Other
creditors |
|
|
|
|
|
V. Deferred debts
on shares |
|
|
|
|
|
VI. Long term
debt with creditor |
|
|
|
|
|
E) SHORT TERM
LIABILITIES |
2.795.036,84 |
2.839.986,54 |
2.753.861,50 |
|
|
I. Negotiable
bonds |
|
|
|
|
|
II. Bank loans |
|
|
|
|
|
III. Short term
debts with associated and affiliated companies |
196.242,47 |
213.407,38 |
18.733,55 |
|
|
With affiliated
companies |
|
18.204,66 |
18.733,55 |
|
|
Associeted
companies |
196.242,47 |
195.202,72 |
|
|
|
IV. Trade
creditors |
1.544.709,29 |
1.544.637,17 |
1.501.989,35 |
|
|
Expenses |
1.544.709,29 |
1.544.637,17 |
1.501.989,35 |
|
|
V. Other non
trade payables |
1.054.085,08 |
1.081.941,99 |
1.233.138,61 |
|
|
Government |
788.972,63 |
744.611,93 |
776.489,61 |
|
|
Other debts |
|
|
111.391,58 |
|
|
Accounts
receivable |
265.112,45 |
337.330,06 |
345.257,41 |
|
|
VI. Provisions
for current assets |
|
|
|
|
|
VII. Accruals and
deferred incomes |
|
|
|
|
|
F) SHORT TERM
PROVISIONS FOR LIABILITIES AND EXPENSES |
|
|
|
|
|
LIABILITIES (A +
B + C + D + E + F) |
37.087.645,60 |
39.707.962,21 |
27.241.312,37 |
Profit and Loss Account
|
(Figures given in
Euros) |
31/12/1998 (12) |
31/12/1999 (12) |
31/12/2000 (12) |
|
|
|
A) EXPENSES (A.1
a A.16) |
|
|
|
|
|
A.1. Change in
stocks of finished goods and work in progress |
|
747.989,61 |
1.080.271,18 |
|
|
A.2. Supplies |
8.037.761,59 |
7.962.538,92 |
5.444.622,74 |
|
|
Material consumed |
1.616.728,57 |
1.905.719,23 |
838.075,32 |
|
|
Raw materials
consumed |
4.129.692,40 |
3.960.669,77 |
4.466.992,42 |
|
|
Other expenses |
2.291.340,62 |
2.096.149,92 |
139.555,01 |
|
|
A.3. Labor cost |
2.955.771,52 |
3.176.042,46 |
3.322.274,71 |
|
|
Wages |
2.289.663,79 |
2.474.450,98 |
2.552.209,92 |
|
|
Social security
expenses |
666.107,73 |
701.591,48 |
770.064,79 |
|
|
A.4. Assets
depreciation |
557.823,37 |
401.037,35 |
330.815,09 |
|
|
A.5 Variance in
provision for current assets |
-42.882,21 |
-3.521,93 |
-150,25 |
|
|
Variance in
provision for bad debts |
-42.882,21 |
-3.521,93 |
-150,25 |
|
|
A.6. Other
operating costs |
3.268.466,10 |
3.296.713,67 |
4.273.538,64 |
|
|
External costs |
3.192.930,90 |
3.245.333,14 |
4.228.060,05 |
|
|
Taxes |
75.535,20 |
51.380,52 |
45.478,59 |
|
|
A.I. OPERATING
RESULT (B.1+B.2+B.3+B.4-A.1-A.2-A.3-A.4-A.5-A.6) |
2.399.679,06 |
2.249.329,87 |
1.971.596,17 |
|
|
A.7. Financial
expenses |
|
|
18,03 |
|
|
Other companies
debts |
|
|
18,03 |
|
|
A.8. Variation in
financial investments provision |
|
|
|
|
|
A.9. Exchange
losses |
59.962,98 |
2.650,46 |
1.033,74 |
|
|
A.II. POSITIVE
FINANCIAL RESULTS (B.5+B.6+B.7+B.8-A.7-A.8-A.9) |
410.743,69 |
676.174,68 |
773.370,36 |
|
|
A.III. PROFIT
FROM ORDINARY ACTIVITIES (A.I+A.II-B.I-B.II) |
2.810.422,75 |
2.925.504,55 |
2.744.966,52 |
|
|
A.10. Variation
in provision in fixed assets |
|
|
|
|
|
A.11. Losses in
fixed assets |
|
|
|
|
|
A.12. Losses from
shares and bonds |
|
|
|
|
|
A.13.
Extraordinary charges |
|
|
|
|
|
A.14. Prior
year’s expenses and losses |
|
|
|
|
|
A.IV. POSITIVE
EXTRAORDINARY RESULT (B.9+B.10+B.11+B.12+B.13-A.10-A.11-A.12-A.13-A.14) |
26.612,82 |
674.473,81 |
24.250,84 |
|
|
A.V. EARNINGS /
LOSS BEFORE TAXES (A.III+A.IV-B.III-B.IV) |
2.837.035,57 |
3.599.978,36 |
2.769.217,36 |
|
|
A.15. Corporate
Taxes |
992.090,68 |
1.024.611,45 |
969.228,18 |
|
|
A.16. Other taxes |
|
|
|
|
|
A.VI. YEAR END
RESULT (PROFIT) (A.V-A.15-A.16) |
1.844.944,89 |
2.575.366,92 |
1.799.989,18 |
|
|
B) INCOMES (B.1 a
B13) |
|
|
|
|
|
B.1. Turnover |
15.988.418,50 |
17.785.120,14 |
16.375.247,92 |
|
|
Sales |
15.624.127,03 |
17.129.530,13 |
16.376.618,23 |
|
|
Services provided |
364.291,47 |
655.590,01 |
280.582,50 |
|
|
Discounts |
|
|
-281.952,81 |
|
|
B.2. Increase in
inventory of finished goods |
1.142.271,59 |
|
|
|
|
B.3. Expenses capitalized |
|
|
|
|
|
B.4. Other
operating income |
45.929,35 |
45.009,80 |
47.720,36 |
|
|
Other incomes |
45.148,03 |
44.577,07 |
47.720,36 |
|
|
Grants |
781,32 |
432,73 |
|
|
|
B.I. OPERATING
LOSSES (A.1+A.2+A.3+A.4+A.5+A.6-B.1-B.2-B.3-B.4) |
|
|
|
|
|
B.5. Incomes from
share |
|
|
|
|
|
B.6. Income from
securities |
258.952,08 |
217.945,02 |
|
|
|
Group companies |
|
105.062,93 |
|
|
|
Associated
companies |
42.094,89 |
|
|
|
|
Other companies |
216.857,19 |
112.882,09 |
|
|
|
B.7. Other income
from interrest |
209.320,50 |
311.492,55 |
713.521,57 |
|
|
From affiliated
companies |
|
|
328.176,65 |
|
|
From other
companies |
209.320,50 |
311.492,55 |
385.344,92 |
|
|
B.8. Gains on
exchange |
2.434,10 |
149.387,57 |
60.900,56 |
|
|
B.II. FINANCIAL
LOSSES (A.7+A.8+A.9-B.5-B.6-B.7-B.8) |
|
|
|
|
|
B.III. LOSSES
FROM ORDINARY ACTIVITIES (B.I+B.II-A.I-A.II) |
|
|
|
|
|
B.9. Gains from
disposal of fixed assets |
3.606,07 |
1.953,29 |
1.202,02 |
|
|
B.10. Gains from
dealing in own shares |
|
672.520,52 |
|
|
|
B.11. Paid in
surplus |
13.540,80 |
|
|
|
|
B.12.
Extraordinary income |
9.465,94 |
|
|
|
|
B.13. Prior
year’s income and profits |
|
|
23.048,81 |
|
|
B.IV.
EXTRAORDINARY LOSSES (A.10+A.11+A.12+A.13+A.14-B.9-B.10-B.11-B.12-B.13) |
|
|
|
|
|
B.V. LOSS BEFORE
TAXES (B.III+B.IV-A.III-A.IV) |
|
|
|
|
|
B.VI. NET LOSS
(B.V+A.15+A.16) |
|
|
|
Main Ratios
|
(Figures given in
Euros) |
1.998 (12) |
1.999 (12) |
2.000 (12) |
|
|
|
ACTIVITY |
|
|
|
|
|
Increase of the
Sales Figures |
13,65 |
11,24 |
-7,93 |
|
|
Assets Turnover |
0,43 |
0,45 |
0,60 |
|
|
Productivity |
1,99 |
1,83 |
1,69 |
|
|
Increase of the
Added Value |
6,39 |
-0,81 |
-3,41 |
|
|
PROFITABILITY |
|
|
|
|
|
Economic
Profitability |
4,97 |
6,49 |
6,61 |
|
|
Financial
Profitability |
5,38 |
6,99 |
7,35 |
|
|
Financial
Expenses |
|
|
0,00 |
|
|
BALANCE (IN DAYS
OF SALES) |
|
|
|
|
|
Customers’ Credit
(In days of sales) |
117,00 |
134,00 |
147,00 |
|
|
Suppliers’ Credit
(In days of sales) |
81,00 |
64,00 |
83,00 |
|
|
Working Capital
(In days of sales) |
426,00 |
549,00 |
331,00 |
|
|
Working Capital
Requirement (In days of sales) |
252,00 |
240,00 |
240,00 |
|
|
Treasury (In days
of sales) |
175,00 |
309,00 |
92,00 |
|
|
BALANCE |
|
|
|
|
|
Working Capital |
18.940.830,36 |
27.121.735,00 |
15.072.043,32 |
|
|
Working Capital
Requirement |
11.179.209,79 |
11.859.285,04 |
10.903.826,04 |
|
|
Treasury |
7.761.620,57 |
15.262.449,97 |
4.168.217,28 |
|
|
Balance Ratio |
2,23 |
3,78 |
2,60 |
|
|
SOLVENCY |
|
|
|
|
|
Borrowing Ratio |
7,54 |
7,15 |
10,11 |
|
|
Own / Permanent
Funds |
100,00 |
100,00 |
100,00 |
|
|
Payback Capacity |
0,17 |
0,16 |
0,17 |
|
|
LIQUIDITY |
|
|
|
|
|
General Liquidity |
7,78 |
10,55 |
6,47 |
|
|
Immediate
Liquidity |
2,78 |
5,37 |
1,51 |
The date when this report was last updated
is 20/11/2006.
This company was last displayed
on 16/11/2006,
it has been viewed 9 times
in the last quarter and 186 times in total .
RATING EXPLANATIONS
|
RATING |
STATUS |
PROPOSED CREDIT LINE |
|
|
>86 |
Aaa |
Possesses an extremely sound financial
base with the strongest capability for timely payment of interest and
principal sums |
Unlimited |
|
71-85 |
Aa |
Possesses adequate working capital. No
caution needed for credit transaction. It has above average (strong)
capability for payment of interest and principal sums |
Large |
|
56-70 |
A |
Financial & operational base are
regarded healthy. General unfavourable factors will not cause fatal effect.
Satisfactory capability for payment of interest and principal sums |
Fairly Large |
|
41-55 |
Ba |
Overall operation is considered normal.
Capable to meet normal commitments. |
Satisfactory |
|
26-40 |
B |
Unfavourable & favourable factors
carry similar weight in credit consideration. Capability to overcome
financial difficulties seems comparatively below average/normal. |
Small |
|
11-25 |
Ca |
Adverse factors are apparent. Repayment of
interest and principal sums in default or expected to be in default upon
maturity |
Limited with full security |
|
<10 |
C |
Absolute credit risk exists. Caution
needed to be exercised |
Credit not recommended |
|
NR |
In view of the lack of information, we
have no basis upon which to recommend credit dealings |
No Rating |
|