
MIRA
INFORM REPORT
|
Report Date : |
23rd
November, 2006 |
IDENTIFICATION
DETAILS
|
Name : |
PORTICO
SA |
|
|
|
|
Registered Office : |
Barrio Arrufana, S/N, 36415
Mos (Pontevedra) |
|
|
|
|
Country : |
Spain |
|
|
|
|
Financials (as on) : |
31.12.2005 |
|
|
|
|
Date of Incorporation : |
13/10/1965 |
|
|
|
|
Legal Form : |
Joint Stock Company |
|
|
|
|
Line of Business : |
Wholesale of other products |
RATING & COMMENTS
|
MIRA’s Rating : |
Ba |
|
RATING |
STATUS |
PROPOSED CREDIT LINE |
|
|
41-55 |
Ba |
Overall operation is considered normal.
Capable to meet normal commitments. |
Satisfactory |
|
Status : |
Satisfactory
|
|
|
|
|
Payment Behaviour : |
Regular
|
|
|
|
|
Litigation : |
Clear |
Company name
PORTICO
SA
TAX NUMBER
A36605301
Identification and
Characteristics
Tax Number A36605301
NAME PORTICO
SA
FORMER NAME PORTICO
SL
BUSINESS ADDRESS BARRIO
ARRUFANA, S/N
Postcode 36415
MOS (PONTEVEDRA)
FORMER ADDRESS BAJADA
A LA GANDARA TRES
Postcode 36330
VIGO (PONTEVEDRA)
URL http://www.portico-sa.es
TELEPHONE 986288053
FAX 986291500
LEGAL FORM JOINT
STOCK COMPANY
DATE FOUNDED 13/10/1965
CAPITAL 2.709.000,00 Euros
PAID-UP CAPITAL 2.709.000,00 Euros
NUMBER OF EMPLOYEES 541
BANKS CAIXA
ONTINYENT; BANESTO OF 6037; BSCH OF 0031;
CAIXANOVA
OF 0000;
ACTIVITY 1619900 - Wholesale
of other products
CNAE 5170 - Other
wholesale
EXPORT COMPANY YES
IMPORT COMPANY YES
Synthesis
FINANCIAL SITUATION (Year ending: 31/12/2005)
![]()
PROFITABILITY ![]() 5/9 Medium
5/9 Medium
TREASURY ![]() 8/9 Very
good
8/9 Very
good
BALANCE SHEET ![]() 9/9 Excellent
9/9 Excellent
DEBT ![]() 6/9 Medium
6/9 Medium
INCIDENTS
![]()
COMMITMENTS ![]() 9/9 Respected
9/9 Respected
INCIDENTS ![]() 9/9 None
or Negligible
9/9 None
or Negligible
PREVIOUS EXPERIENCE
![]()
PREVIOUS EXPERIENCE ![]() 9/9 Very
favourable
9/9 Very
favourable
Credit Appraisal
CREDIT ACCORDING TO OBJECTIVE DATA (From 0 to 500.000,00 Euros):
FAVOURABLE TOWARDS 499.441,06 Max.
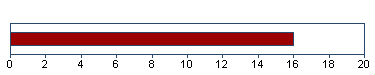
SOLVENCY RATING:
16/20 (BASED ON HOMOGENEOUS FORMULATION)
Financial Elements
Figures
given in Euros
|
|
Balance
sheet 2.003 (12) |
Balance
sheet 2.004 (12) |
Balance
sheet 2.005 (12) |
%
Sales |
|
SALES |
71.340.804,00 |
79.515.123,54 |
92.472.650,13 |
|
|
ADDED VALUE |
15.089.139,00 |
16.799.760,92 |
16.942.677,13 |
18,32 |
|
BUSINESS RESULT |
2.674.783,16 |
2.463.627,29 |
1.941.389,63 |
2,10 |
|
OWN FUNDS |
11.779.565,68 |
14.243.185,97 |
16.184.575,53 |
|
|
DEBT |
39.580.034,50 |
38.494.987,73 |
44.301.683,09 |
|
|
TOTAL ASSET |
51.498.998,20 |
52.877.571,72 |
60.690.128,64 |
|
The sales of 92.472.650,13 Euros
show a change of 16,30% compared with 2.004 . Between
2.003 and 2.004 , this change was 11,46% .
Added value grew by 0,85% compared with
the previous year. Shareholders equity are 16.184.575,53
Euros for an indebtedness of 44.301.683,09 Euros
.
The result 1.941.389,63 Euros
means financial profitability of 12,00% and economic profitability
of 3,20% . This result means growth of -21,20% compared
with the 2.004 .
THE FIGURES FOR THE LAST BALANCE
SHEET ARE RELEVANT
SOURCE: FROM THE MERCANTILE REGISTER
DATE: 20/11/2006
Auditors’ opinion
FAVOURABLE (2.005)
Auditors
DELOITTE S.L.
Comparative Sector Analysis
|
|
Company |
Sector |
Difference |
|
|
(2.005) |
|
|
|
%
of PRODUCTION VALUE |
|
|
|
|
SALES |
97,50 |
98,89 |
-1,39 |
|
ADDED
VALUE |
17,86 |
17,43 |
0,43 |
|
BUSINESS
RESULT |
2,05 |
4,08 |
-2,03 |
|
%
OF TOTAL ASSETS |
|
|
|
|
OWN
FUNDS |
26,67 |
39,36 |
-12,69 |
|
DEBT |
73,00 |
60,64 |
12,36 |
Compared sector (CNAE) : 517 - Otro comercio
al por mayor
Number of companies : 35
Size (Sales Figure) : >
40.000.000,00 Euros
The turnover of the
company is 1,39% below the mean for the sector.
The company’s added
value was 17,86% s/ the production value, and 0,43% above the mean
for the sector.
The company’s
business result was 2,05% of the PV, 2,03% below the mean for the
sector.
The company’s own
resources are 26,67% , 12,69% below the mean for the sector.
The company’s
outside resources are 73,00% , 12,36% above the mean for the
sector.
Legal Actions
No legal incidences registered for this company in
the official source
No claims registered for this company in the
official sources
AFFECTED BY: No significant elemento
Main Board members, Directors and
Auditor
|
Position |
Surname and name |
Date
of appointment |
|
CHAIRMAN |
CASTRO RODRIGUEZ
EMILIO |
28/02/2002 |
|
VICE-PRESIDENT |
COBAS GONZALEZ
JOSE ANTONIO |
28/02/2002 |
|
BOARD MEMBER |
PAMARCHI SL |
07/03/2003 |
|
BOARD MEMBER |
CASTRO REY
ANTONIO EMILIO |
28/02/2002 |
|
BOARD MEMBER |
CASTRO REY FATIMA |
28/02/2002 |
|
SECRETARY |
LOPEZ GARCIA JOSE
ANTONIO |
28/02/2002 |
|
AUDITOR |
ARTHUR ANDERSEN Y
CIA S COM |
14/12/1998 |
Financial Links
|
Shareholders |
|||||
|
Company Name |
CIF/Country |
|
Source |
Information Date |
|
|
|
B82064072 |
54,51%
|
M.REGISTER |
31/12/2005 |
|
|
URANUS
ENTERPRISES INC |
ESTADOS UNIDOS |
40,49%
|
M.REGISTER |
31/12/2005 |
|
|
JALNA COMPANY INC |
PAÍSES DIVERSOS |
5,00%
|
M.REGISTER |
31/12/2005 |
|
|
|
Company
with solvency rating below 7 |
||||
|
Shareholdings |
||||
|
Company Name |
CIF/Country |
Percent. |
Source |
Information Date |
|
LUZ DE
ALBA S.A. |
COSTA RICA |
100,00%
|
M.REGISTER |
31/12/2005 |
|
COMERCIAL
PORTICO LDA |
REPÚBLICA
CENTROAFRICANA |
99,94%
|
M.REGISTER |
31/12/2005 |
|
PORTICO
ITALIA S.R.L. |
ITALIA |
99,00%
|
M.REGISTER |
31/12/2005 |
|
SHOW
ROOM-ARTIGOS DE DECORACAO E MOBILIA PARA O LAR LDA |
PORTUGAL |
98,00%
|
M.REGISTER |
31/12/2005 |
|
PUERTANA
S.A. |
ARGENTINA |
70,00%
|
M.REGISTER |
31/12/2005 |
|
DETALHES
PARA CASA-DECORACAO E COMERCIO LTDA |
PORTUGAL |
50,00%
|
M.REGISTER |
31/12/2005 |
Proceedings published in the
B.O.R.M.E. (Official Mercantile Register Gazette)
|
Proceedings |
Date |
Notice
Num. |
Mercantile
Reg. |
|
Registration of
accounts (2005) |
27/09/2006 |
563460 |
PONTEVEDRA |
|
Appointments |
27/10/2005 |
456209 |
PONTEVEDRA |
|
Registration of
accounts (2004) |
20/09/2005 |
468668 |
PONTEVEDRA |
|
Registration of
accounts (2003) |
26/08/2004 |
260841 |
PONTEVEDRA |
|
Appointments |
13/05/2004 |
226124 |
PONTEVEDRA |
Press articles
23/11/2004 FARO DE VIGO BRANCHES
INFORMATION
EL GRUPO
VIGUES PORTICO, DEDICADO A LA IMPORTACION Y DISTRIBUCION DE MUEBLES Y OBJETOS
DE DECORACION, CONSTRUIRA UNA NAVE EN LA LOCALIDAD DE VILA NOVA DE FAMALICAO
(PORTUGAL). EL NUEVO CENTRO TIENE 1.500 METROS CUADRADOS DE SUPER FICIE, EN EL
QUE TRABAJARAN 10 PERSONAS, ESTIMANDOSE SU APERTURA PROXIMAMEN TE. LA CIA.
DISPONE DE OTRO CENTRO DE DISTRIBUCION EN PORTUGAL DE 6.000 ME TROS CUADRADOS Y
6 TIENDAS EN EL PAIS LUSO. PORTICO EMPLEA A MAS DE 250 PER SONAS Y ESTA
PRESENTE EN 11 PAISES, COMO REPUBLICA DOMINICANA, URUGUAY, VE NEZUELA, COSTA
RICA, CHILE, SALVADOR, ARGENTINA, HONDURAS Y NICARAGUA.
20/11/2003 EXPANSIÓN BRANCHES
INFORMATION
LAS
EMPRESAS ESPAÑOLAS MANGO Y PORTICO HAN ABIERTO SU PRIMERA TIENDA EN TE
GUCIGALPA (HONDURAS), CON PERSPECTIVAS DE EXTENDER LA RED A OTRAS CIUDADES DEL
PAIS. PORTICO, ESPECIALIZADA EN OBJETOS PARA EL HOGAR, TIENE COMO OBJE TIVO
ABRIR UNA SEGUNDA TIENDA EN EL CENTRO COMERCIAL MALL MULTIPLAZA DE LA CIUDAD
HONDUREÑA Y, POSTERIORMENTE, LO HARA EN CHOLUTECA, SAN PEDRO SAULA Y LA CEIBA,
EN EL SUR, NORTE Y CARIBE DE HONDURAS.
Complementary Information
18/10/06 BLOQUE DE INVESTIGACION:
- Actividad: Comercio al mayor y menor de muebles y articulos para el
hogar.
----------------------------------------------------------------------
El Bloque de Investigacion no esta sujeto a actualizaciones sistemati
cas.Los datos mostrados fueron aportados por las fuentes consultadas
en la fecha del encabezamiento.
Brands, Signs and Commercial
Names
|
Prevailing Brands |
|||||
|
Name |
HOTEL MAMA |
||||
|
Kind
of Brand: |
JOINT |
File: |
M2645881 |
||
|
Request
Date: |
11/04/2005 |
Bulletin
Date: |
Bulletin
Date: |
Current
situation: |
APPROVED
REGISTER |
|
Types:
27 |
|
||||
|
Name |
PORTICO |
||||
|
Kind
of Brand: |
DENOMINATIVE |
File: |
M2618601 |
||
|
Request
Date: |
20/10/2004 |
Bulletin
Date: |
Bulletin
Date: |
Current
situation: |
APPROVED
REGISTER |
|
Types:
16 |
|
||||
|
Name |
PRT PEOPLE RECOGNIZE OUR TASTE |
||||
|
Kind
of Brand: |
JOINT |
File: |
M2515196 |
||
|
Request
Date: |
28/11/2002 |
Bulletin
Date: |
Bulletin
Date: |
Current
situation: |
APPROVED
REGISTER |
|
Types:
39 |
|
||||
|
Name |
NAVE PRT PEOPLE RECOGNIZE OUR TASTE |
||||
|
Kind
of Brand: |
JOINT |
File: |
M2515197 |
||
|
Request
Date: |
28/11/2002 |
Bulletin
Date: |
Bulletin
Date: |
Current
situation: |
APPROVED
REGISTER |
|
Types:
38 |
|
||||
|
Name |
PRT |
||||
|
Kind
of Brand: |
JOINT |
File: |
M2512632 |
||
|
Request
Date: |
13/11/2002 |
Bulletin
Date: |
Bulletin
Date: |
Current
situation: |
APPROVED
REGISTER |
|
Types:
26 |
|
||||
Total
Marcas: 63
The information on the last account
contained in this report is extracted from the Mercantile Register file of the
legal address of the Company and dated 20/11/2006
Balance Sheet (ASSETS)
|
(Figures given in
Euros) |
31/12/2003 (12)
|
31/12/2004 (12)
|
31/12/2005 (12)
|
|
|
|
A) DUE FROM
SHAREHOLDERS FOR UNCALLED CAPITAL |
|
|
|
|
|
B) FIXED ASSETS |
12.674.407,82 |
13.290.622,41 |
12.912.414,84 |
|
|
I. Establishment
expenses |
63.710,01 |
34.319,11 |
6.737,66 |
|
|
II. Intangible
assets |
3.517.947,85 |
3.732.954,49 |
2.779.724,20 |
|
|
Concessions,
patents,licences , trademarks |
312.915,50 |
331.996,50 |
347.417,15 |
|
|
Acquired rights
from finance leases |
367.218,39 |
367.218,39 |
367.218,39 |
|
|
Software |
34.084,42 |
34.084,42 |
44.652,42 |
|
|
Leasing |
3.820.167,24 |
4.459.520,08 |
3.389.351,14 |
|
|
Amortization |
-1.016.437,70 |
-1.459.864,90 |
-1.368.914,90 |
|
|
III. Tangible
assets |
8.035.413,50 |
8.215.551,75 |
7.787.724,46 |
|
|
Property, plant
and equipment |
3.844.608,62 |
3.844.608,62 |
3.844.608,62 |
|
|
Machinery,
equipment and other |
6.245.145,12 |
7.089.511,64 |
7.964.575,16 |
|
|
Other property
plant and equipement |
517.321,20 |
763.586,41 |
837.992,20 |
|
|
Other assets |
1.190.130,74 |
1.438.855,02 |
1.717.352,89 |
|
|
Depreciation |
-3.761.792,18 |
-4.921.009,94 |
-6.576.804,41 |
|
|
IV. Financial
assets |
1.057.336,46 |
1.307.797,06 |
2.338.228,52 |
|
|
Shares in
affiliated companies |
928.546,57 |
1.242.958,76 |
1.817.097,26 |
|
|
Loans to
affiliated companies |
60.000,00 |
133.882,00 |
732.958,01 |
|
|
Shares in
associated companies |
|
173.079,02 |
173.079,02 |
|
|
Securities |
6.495,19 |
6.495,19 |
6.495,19 |
|
|
Other loans |
102.345,09 |
22.708,09 |
22.708,09 |
|
|
Long term
deposits and guarantees |
219.238,85 |
232.134,02 |
277.335,17 |
|
|
Provisions |
-259.289,24 |
-503.460,02 |
-691.444,22 |
|
|
V. Owners equity |
|
|
|
|
|
VI. Long term
trade liabilities |
|
|
|
|
|
C) DEFERRED
EXPENSES |
206.758,48 |
180.156,18 |
116.911,01 |
|
|
D) CURRENT ASSETS |
38.617.831,90 |
39.406.793,13 |
47.660.802,79 |
|
|
I. Not paid in
shareholder capital |
|
|
|
|
|
II. Inventory |
22.398.557,23 |
19.936.456,64 |
24.749.740,83 |
|
|
Goods available
for sale |
23.025.907,23 |
20.696.320,64 |
25.557.597,83 |
|
|
Cash advance |
56.378,00 |
|
|
|
|
Provisions |
-683.728,00 |
-759.864,00 |
-807.857,00 |
|
|
III. Debtors |
15.637.356,42 |
17.020.408,29 |
20.024.094,74 |
|
|
Clients |
13.756.367,00 |
13.573.171,59 |
16.345.126,48 |
|
|
Amounts owned by
affiliated companies |
2.767.318,00 |
4.357.031,79 |
4.546.201,18 |
|
|
Other debts |
124.736,99 |
233.831,02 |
349.953,64 |
|
|
Labor costs |
|
35.020,46 |
32.869,55 |
|
|
Taxes refunds |
361.225,29 |
460.555,57 |
529.863,91 |
|
|
Provisions |
-1.372.290,86 |
-1.639.202,14 |
-1.779.920,02 |
|
|
IV. Short term
financial assets |
|
1.424.895,10 |
1.248.648,04 |
|
|
Other loans |
|
1.424.895,10 |
1.248.648,04 |
|
|
V. Short term
owners equity |
|
|
|
|
|
VI. Cash |
410.942,10 |
725.769,35 |
1.145.671,18 |
|
|
VII. Prepaid
expenses and accrued income |
170.976,15 |
299.263,75 |
492.648,00 |
|
|
ASSETS (A + B + C
+ D) |
51.498.998,20 |
52.877.571,72 |
60.690.128,64 |
Balance Sheet (LIABILITIES)
|
(Figures given in
Euros) |
31/12/2003 (12)
|
31/12/2004 (12)
|
31/12/2005 (12)
|
|
|
|
A) SHAREHOLDERS
EQUITY |
11.779.565,68 |
14.243.185,97 |
16.184.575,53 |
|
|
I. Capital |
2.709.000,00 |
2.709.000,00 |
2.709.000,00 |
|
|
II. Premium share
account |
|
|
|
|
|
III. Revaluation
reserve |
|
|
|
|
|
IV. Reserves |
6.395.782,52 |
9.070.558,68 |
11.534.185,90 |
|
|
Retained earnings |
541.800,00 |
541.800,00 |
541.800,00 |
|
|
Other funds |
5.853.982,52 |
8.528.758,68 |
10.992.385,90 |
|
|
V. Prior year earnings |
|
|
|
|
|
VI. Prior year
profit or losses |
2.674.783,16 |
2.463.627,29 |
1.941.389,63 |
|
|
VII. Dividend
paid during the year |
|
|
|
|
|
VIII. Own shares
for change in capital |
|
|
|
|
|
B) DEFERRED
INCOME |
|
|
64.472,00 |
|
|
Rate difference |
|
|
64.472,00 |
|
|
C) PROVISIONS FOR
LIABILITIES AND EXPENSES |
139.398,02 |
139.398,02 |
139.398,02 |
|
|
Other provisions |
139.398,02 |
139.398,02 |
139.398,02 |
|
|
D) LONG TERM
LIABILITIES |
5.918.787,50 |
6.066.302,09 |
4.683.200,84 |
|
|
I. Bonds |
|
|
|
|
|
II. Bank loans |
3.458.787,50 |
3.606.302,09 |
2.373.200,84 |
|
|
Long term bank
loans |
1.573.923,53 |
1.723.619,67 |
1.068.470,25 |
|
|
Leasing |
1.884.863,97 |
1.882.682,42 |
1.304.730,59 |
|
|
III. Debts with
associed and affiliated companies |
2.460.000,00 |
2.460.000,00 |
2.310.000,00 |
|
|
Debt with
affiliated companies |
2.460.000,00 |
2.460.000,00 |
2.310.000,00 |
|
|
IV. Other
creditors |
|
|
|
|
|
V. Deferred debts
on shares |
|
|
|
|
|
VI. Long term
debt with creditor |
|
|
|
|
|
E) SHORT TERM
LIABILITIES |
33.661.247,00 |
32.428.685,64 |
39.618.482,25 |
|
|
I. Negotiable
bonds |
|
|
|
|
|
II. Bank loans |
18.539.139,83 |
16.671.555,70 |
20.764.766,65 |
|
|
Loans and other
debts |
18.539.139,83 |
15.992.297,20 |
20.178.621,70 |
|
|
Leasing |
|
679.258,50 |
586.144,95 |
|
|
III. Short term
debts with associated and affiliated companies |
512.488,00 |
275.469,57 |
191.016,46 |
|
|
With affiliated
companies |
512.488,00 |
275.469,57 |
191.016,46 |
|
|
IV. Trade
creditors |
12.359.623,60 |
12.665.421,91 |
16.498.798,73 |
|
|
Expenses |
5.725.556,38 |
3.473.999,26 |
4.819.149,29 |
|
|
Bills payable |
6.634.067,22 |
9.191.422,65 |
11.679.649,44 |
|
|
V. Other non
trade payables |
2.249.995,57 |
2.816.238,46 |
2.163.900,41 |
|
|
Government |
1.467.127,12 |
1.865.153,54 |
1.121.155,96 |
|
|
Other debts |
34.151,44 |
38.778,63 |
68.649,58 |
|
|
Accounts
receivable |
748.717,01 |
912.306,29 |
974.094,87 |
|
|
VI. Provisions
for current assets |
|
|
|
|
|
VII. Accruals and
deferred incomes |
|
|
|
|
|
F) SHORT TERM
PROVISIONS FOR LIABILITIES AND EXPENSES |
|
|
|
|
|
LIABILITIES (A +
B + C + D + E + F) |
51.498.998,20 |
52.877.571,72 |
60.690.128,64 |
Profit and Loss Account
|
(Figures given in
Euros) |
31/12/2003 (12)
|
31/12/2004 (12)
|
31/12/2005 (12)
|
|
|
|
A) EXPENSES (A.1
a A.16) |
|
|
|
|
|
A.1. Change in
stocks of finished goods and work in progress |
|
|
|
|
|
A.2. Supplies |
41.313.866,00 |
44.072.664,26 |
51.598.537,03 |
|
|
Material consumed |
41.313.866,00 |
44.072.664,26 |
51.598.537,03 |
|
|
A.3. Labor cost |
8.717.362,00 |
9.947.469,24 |
11.138.338,68 |
|
|
Wages |
6.954.073,00 |
7.829.996,41 |
8.637.779,21 |
|
|
Social security
expenses |
1.763.289,00 |
2.117.472,83 |
2.500.559,47 |
|
|
A.4. Assets
depreciation |
1.287.771,00 |
1.632.035,21 |
1.882.375,29 |
|
|
A.5 Variance in
provision for current assets |
442.469,00 |
239.821,51 |
188.710,88 |
|
|
Variance in
provision for inventory |
145.254,00 |
76.136,00 |
47.993,00 |
|
|
Variance in
provision for bad debts |
297.215,00 |
163.685,51 |
140.717,88 |
|
|
A.6. Other
operating costs |
16.991.293,00 |
20.562.893,00 |
26.298.985,05 |
|
|
External costs |
16.924.725,00 |
20.454.087,09 |
26.183.226,60 |
|
|
Taxes |
66.568,00 |
108.805,91 |
115.758,45 |
|
|
A.I. OPERATING
RESULT (B.1+B.2+B.3+B.4-A.1-A.2-A.3-A.4-A.5-A.6) |
4.641.537,00 |
4.980.434,96 |
3.733.252,28 |
|
|
A.7. Financial
expenses |
1.144.453,00 |
1.058.967,25 |
1.185.731,92 |
|
|
Debts with related
companies |
161.016,00 |
134.102,15 |
102.104,69 |
|
|
Other companies
debts |
983.437,00 |
924.865,10 |
1.083.627,23 |
|
|
A.8. Variation in
financial investments provision |
|
244.170,78 |
187.984,20 |
|
|
A.9. Exchange
losses |
807.290,00 |
765.735,20 |
508.056,79 |
|
|
A.II. POSITIVE
FINANCIAL RESULTS (B.5+B.6+B.7+B.8-A.7-A.8-A.9) |
|
|
|
|
|
A.III. PROFIT
FROM ORDINARY ACTIVITIES (A.I+A.II-B.I-B.II) |
3.960.782,00 |
3.390.862,98 |
2.511.346,06 |
|
|
A.10. Variation
in provision in fixed assets |
202.960,00 |
|
|
|
|
A.11. Losses in
fixed assets |
135.170,00 |
|
158.006,40 |
|
|
A.12. Losses from
shares and bonds |
|
|
|
|
|
A.13.
Extraordinary charges |
38.180,00 |
314.480,00 |
167.150,61 |
|
|
A.14. Prior
year’s expenses and losses |
103.319,00 |
1.004,00 |
16.461,42 |
|
|
A.IV. POSITIVE
EXTRAORDINARY RESULT (B.9+B.10+B.11+B.12+B.13-A.10-A.11-A.12-A.13-A.14) |
|
|
8.505,51 |
|
|
A.V. EARNINGS /
LOSS BEFORE TAXES (A.III+A.IV-B.III-B.IV) |
3.517.776,00 |
3.183.799,10 |
2.519.851,57 |
|
|
A.15. Corporate
Taxes |
842.992,84 |
720.171,81 |
578.461,94 |
|
|
A.16. Other taxes |
|
|
|
|
|
A.VI. YEAR END
RESULT (PROFIT) (A.V-A.15-A.16) |
2.674.783,16 |
2.463.627,29 |
1.941.389,63 |
|
|
B) INCOMES (B.1 a
B13) |
|
|
|
|
|
B.1. Turnover |
71.340.804,00 |
79.515.123,54 |
92.472.650,13 |
|
|
Sales |
71.340.804,00 |
79.515.123,54 |
92.709.065,07 |
|
|
Discounts |
|
|
-236.414,94 |
|
|
B.2. Increase in
inventory of finished goods |
|
|
|
|
|
B.3. Expenses
capitalized |
|
|
|
|
|
B.4. Other
operating income |
2.053.494,00 |
1.920.194,64 |
2.367.549,08 |
|
|
Other incomes |
2.053.494,00 |
1.920.194,64 |
2.353.348,85 |
|
|
Grants |
|
|
14.200,23 |
|
|
B.I. OPERATING
LOSSES (A.1+A.2+A.3+A.4+A.5+A.6-B.1-B.2-B.3-B.4) |
|
|
|
|
|
B.5. Incomes from
share |
|
3.021,38 |
1.712,35 |
|
|
From other
companies |
|
3.021,38 |
1.712,35 |
|
|
B.6. Income from
securities |
|
|
|
|
|
B.7. Other income
from interrest |
2.892,00 |
56.443,62 |
74.653,29 |
|
|
From other
companies |
2.892,00 |
56.443,62 |
74.653,29 |
|
|
B.8. Gains on
exchange |
1.268.096,00 |
419.836,25 |
583.501,05 |
|
|
B.II. FINANCIAL
LOSSES (A.7+A.8+A.9-B.5-B.6-B.7-B.8) |
680.755,00 |
1.589.571,98 |
1.221.906,22 |
|
|
B.III. LOSSES
FROM ORDINARY ACTIVITIES (B.I+B.II-A.I-A.II) |
|
|
|
|
|
B.9. Gains from
disposal of fixed assets |
|
|
5.088,68 |
|
|
B.10. Gains from
dealing in own shares |
|
|
|
|
|
B.11. Paid in
surplus |
|
|
|
|
|
B.12.
Extraordinary income |
19.673,00 |
64.008,23 |
306.710,50 |
|
|
B.13. Prior
year’s income and profits |
16.950,00 |
44.411,89 |
38.324,76 |
|
|
B.IV.
EXTRAORDINARY LOSSES (A.10+A.11+A.12+A.13+A.14-B.9-B.10-B.11-B.12-B.13) |
443.006,00 |
207.063,88 |
|
|
|
B.V. LOSS BEFORE
TAXES (B.III+B.IV-A.III-A.IV) |
|
|
|
|
|
B.VI. NET LOSS
(B.V+A.15+A.16) |
|
|
|
Main Ratios
|
(Figures given in
Euros) |
2.003 (12)
|
2.004 (12)
|
2.005 (12)
|
|
|
|
ACTIVITY |
|
|
|
|
|
Increase of the
Sales Figures |
14,21 |
11,46 |
16,30 |
|
|
Assets Turnover |
1,39 |
1,50 |
1,52 |
|
|
Productivity |
1,73 |
1,69 |
1,52 |
|
|
Increase of the
Added Value |
23,22 |
11,34 |
0,85 |
|
|
PROFITABILITY |
|
|
|
|
|
Economic
Profitability |
5,19 |
4,66 |
3,20 |
|
|
Financial
Profitability |
22,71 |
17,30 |
12,00 |
|
|
Financial
Expenses |
1,60 |
1,33 |
1,28 |
|
|
BALANCE (IN DAYS
OF SALES) |
|
|
|
|
|
Customers’ Credit
(In days of sales) |
79,00 |
77,00 |
78,00 |
|
|
Suppliers’ Credit
(In days of sales) |
108,00 |
103,00 |
115,00 |
|
|
Working Capital
(In days of sales) |
25,00 |
32,00 |
31,00 |
|
|
Working Capital
Requirement (In days of sales) |
116,00 |
97,00 |
103,00 |
|
|
Treasury (In days
of sales) |
0,00 |
0,00 |
0,00 |
|
|
BALANCE |
|
|
|
|
|
Working Capital |
4.956.584,90 |
6.978.107,49 |
8.042.320,54 |
|
|
Working Capital
Requirement |
23.084.782,63 |
21.498.998,74 |
26.412.767,97 |
|
|
Treasury |
-18.128.197,73 |
-14.520.891,25 |
-18.370.447,43 |
|
|
Balance Ratio |
1,39 |
1,52 |
1,62 |
|
|
SOLVENCY |
|
|
|
|
|
Borrowing Ratio |
76,86 |
72,80 |
73,00 |
|
|
Own / Permanent
Funds |
66,04 |
69,65 |
76,81 |
|
|
Payback Capacity |
0,54 |
0,47 |
0,47 |
|
|
LIQUIDITY |
|
|
|
|
|
General Liquidity |
1,15 |
1,22 |
1,20 |
|
|
Immediate
Liquidity |
0,01 |
0,07 |
0,06 |
Sectorial Analysis
Summary of Assets, Liability
& Equity
|
(Figures given in
Percentages) |
Company |
Sector |
Company |
|
|
2.005 |
|
|
|
Assets |
|||
|
DUE
FROM SHAREHOLDERS FOR UNCALLED CAPITAL |
0,00 |
0,00 |
0,00 |
|
FIXED
ASSETS |
21,28 |
25,79 |
-4,51 |
|
ACCRUED
EXPENSES |
0,19 |
0,14 |
0,05 |
|
CURRENT
ASSETS |
78,53 |
74,07 |
4,46 |
|
TOTAL
ASSETS |
100,00 |
100,00 |
0,00 |
|
Liabilities |
|||
|
SHAREHOLDERS
EQUITY |
26,67 |
39,36 |
-12,69 |
|
ACCRUED
INCOME |
0,11 |
0,48 |
-0,37 |
|
RISK
AND EXPENDITURE COVER |
0,23 |
1,50 |
-1,27 |
|
LONG-TERM
CREDITORS |
7,72 |
9,08 |
-1,36 |
|
SHORT-TERM
CREDITORS |
65,28 |
49,58 |
15,70 |
|
SHORT-TERM
RISK AND EXPENDITURE COVER |
0,00 |
0,00 |
0,00 |
|
TOTAL
LIABILITIES |
100,00 |
100,00 |
0,00 |
Analytical Account of Results
|
(Figures given in
Percentages) |
Company |
Sector |
Company |
|
|
2.005 |
|
|
|
Net
turnover |
97,50 |
98,89 |
-1,39 |
|
Other
operating income |
2,50 |
1,11 |
1,39 |
|
Production
Value |
100,00 |
100,00 |
0,00 |
|
Operating
expenses |
54,41 |
71,64 |
-17,24 |
|
Other
operation expenses |
27,73 |
10,93 |
16,80 |
|
Added
value |
17,86 |
17,43 |
0,43 |
|
Labor
cost |
11,74 |
9,31 |
2,43 |
|
Gross
Economic Result |
6,12 |
8,12 |
-2,00 |
|
Assets
depreciation |
1,98 |
1,60 |
0,39 |
|
Variation
in provision for current assets |
0,20 |
0,41 |
-0,21 |
|
Net
Economic Result |
3,94 |
6,11 |
-2,17 |
|
Financial
income |
0,70 |
1,32 |
-0,63 |
|
Financial
expenses |
1,98 |
1,55 |
0,44 |
|
Variation
in financial investment provision |
0,20 |
-0,05 |
0,25 |
|
Ordinary
Activities Result |
2,65 |
5,94 |
-3,29 |
|
Extraordinary
income |
0,37 |
1,70 |
-1,33 |
|
Extraordinary
expenses |
0,36 |
1,68 |
-1,32 |
|
Variation
in provision in fixed assets |
0,00 |
0,08 |
-0,08 |
|
Results
before Taxes |
2,66 |
5,87 |
-3,21 |
|
Corporaye
taxes |
0,61 |
1,79 |
-1,18 |
|
Net
Result |
2,05 |
4,08 |
-2,03 |
|
Assets
depreciation |
1,98 |
1,60 |
0,39 |
|
Provisions
fund variation |
0,40 |
0,45 |
-0,05 |
|
Net
Self-Financing |
4,43 |
6,12 |
-1,69 |
Ratios
|
(Figures given in
) |
Company |
Ptile25
|
Medium
|
Ptile75
|
|
|
2.005 |
|
|
|
|
ACTIVITY |
|
|
|
|
|
Increase
of the Sales Figures |
16,30 |
-0,72 |
8,51 |
13,96 |
|
Assets
Turnover |
1,52 |
1,09 |
1,67 |
2,17 |
|
Fixed
Assets Turnover |
7,10 |
5,54 |
9,05 |
14,33 |
|
Increase
of the Added Value |
0,85 |
-6,80 |
7,95 |
15,08 |
|
PRODUCTIVITY |
|
|
|
|
|
Productivity |
1,52 |
1,53 |
1,92 |
2,34 |
|
Change
of Personnel Costs |
11,97 |
0,22 |
5,46 |
14,59 |
|
Average
Personnel Costs |
20.588,43 |
27.213,95 |
37.704,74 |
52.977,44 |
|
Value
Added by Employees |
31.317,33 |
42.779,25 |
74.001,37 |
109.184,55 |
|
CASH FLOW |
|
|
|
|
|
Cash
Flow |
4.200.460,00 |
1.762.807,55 |
3.151.887,94 |
6.752.000,00 |
|
Operating
Cash Flow |
5.804.338,45 |
2.228.942,00 |
3.959.366,72 |
9.945.000,00 |
|
Change
in Cash Flow |
-8,28 |
-7,19 |
8,67 |
25,03 |
|
PROFITABILITY |
|
|
|
|
|
Economic
Profitability |
3,20 |
1,60 |
4,24 |
7,77 |
|
Financial
Profitability |
12,00 |
6,83 |
10,93 |
19,02 |
|
Financial
Expenses |
1,28 |
0,38 |
0,60 |
1,12 |
|
Gross
Economic Profitability |
9,56 |
6,15 |
10,19 |
13,32 |
|
Gross
Financial Profitability |
35,86 |
18,98 |
26,75 |
39,95 |
|
BALANCE (IN DAYS
OF SALES) |
|
|
|
|
|
Customers’
Credit (In days of sales) |
77,00 |
70,52 |
109,50 |
155,28 |
|
Suppliers’
Credit (In days of sales) |
115,00 |
25,55 |
70,57 |
101,20 |
|
Working
Capital (In days of sales) |
31,00 |
11,87 |
29,78 |
95,96 |
|
Working
Capital Requirement (In days of sales) |
102,00 |
28,10 |
72,40 |
108,57 |
|
Treasury
(In days of sales) |
0,00 |
-39,61 |
-3,93 |
18,10 |
|
Operating
Current Assets |
185,00 |
132,86 |
172,48 |
252,43 |
|
BALANCE |
|
|
|
|
|
Working
Capital |
8.042.320,54 |
2.383.473,79 |
7.501.000,00 |
16.204.899,55 |
|
Working
Capital Requirement |
26.412.767,97 |
3.728.353,42 |
13.206.000,00 |
20.670.084,58 |
|
Treasury |
-18.370.447,43 |
-9.983.749,00 |
-504.889,00 |
6.140.125,00 |
|
Balance
Ratio |
1,62 |
1,30 |
1,96 |
3,42 |
|
SOLVENCY |
|
|
|
|
|
Borrowing
Ratio |
73,00 |
45,88 |
65,41 |
79,23 |
|
Own
/ Permanent Funds |
76,81 |
79,74 |
92,62 |
99,87 |
|
Payback
Capacity |
0,47 |
0,24 |
0,37 |
0,51 |
|
Long
term Indebtedness |
7,72 |
0,01 |
1,01 |
3,96 |
|
Gearing |
374,99 |
184,79 |
289,12 |
481,47 |
|
Financing
Basic Ratio |
1,00 |
1,00 |
1,00 |
1,00 |
|
Assets
Guarantee |
1,37 |
1,21 |
1,38 |
2,13 |
|
LIQUIDITY |
|
|
|
|
|
General
Liquidity |
1,20 |
1,11 |
1,22 |
2,12 |
|
Immediate
Liquidity |
0,06 |
0,03 |
0,09 |
0,35 |
The date when this report was last updated
is 23/11/2006.
This company was last displayed
on 22/11/2006,
it has been viewed 64 times
in the last quarter and 851 times in total .
RATING EXPLANATIONS
|
RATING |
STATUS |
PROPOSED CREDIT LINE |
|
|
>86 |
Aaa |
Possesses an extremely sound financial
base with the strongest capability for timely payment of interest and
principal sums |
Unlimited |
|
71-85 |
Aa |
Possesses adequate working capital. No
caution needed for credit transaction. It has above average (strong)
capability for payment of interest and principal sums |
Large |
|
56-70 |
A |
Financial & operational base are
regarded healthy. General unfavourable factors will not cause fatal effect.
Satisfactory capability for payment of interest and principal sums |
Fairly Large |
|
41-55 |
Ba |
Overall operation is considered normal.
Capable to meet normal commitments. |
Satisfactory |
|
26-40 |
B |
Unfavourable & favourable factors carry
similar weight in credit consideration. Capability to overcome financial
difficulties seems comparatively below average/normal. |
Small |
|
11-25 |
Ca |
Adverse factors are apparent. Repayment of
interest and principal sums in default or expected to be in default upon
maturity |
Limited with full security |
|
<10 |
C |
Absolute credit risk exists. Caution
needed to be exercised |
Credit not recommended |
|
NR |
In view of the lack of information, we
have no basis upon which to recommend credit dealings |
No Rating |
|