
MIRA
INFORM REPORT
|
Report Date : |
29th
November, 2006 |
IDENTIFICATION
DETAILS
|
Name : |
CALZADOZ
ANATOMICOS CALANA SL |
|
|
|
|
Formerly Known As : |
CALZADOS ANATOMICOS SL |
|
|
|
|
Registered Office : |
Avenida Hispanoamerica, S/N 03638
Salinas (Alicante) |
|
|
|
|
Country : |
Spain |
|
|
|
|
Financials (as on) : |
31.12.2005 |
|
|
|
|
Date of Incorporation : |
10.02.1987 |
|
|
|
|
Legal Form : |
Limited Liability Company |
|
|
|
|
Line of Business : |
Manufacturer of footwear |
RATING & COMMENTS
|
MIRA’s Rating : |
Ba |
|
RATING |
STATUS |
PROPOSED CREDIT LINE |
|
|
41-55 |
Ba |
Overall operation is considered normal.
Capable to meet normal commitments. |
Satisfactory |
|
Status : |
Satisfactory
|
|
|
|
|
Payment Behaviour : |
Regular
|
|
|
|
|
Litigation : |
Clear |
Company name
CALZADOS
ANATOMICOS CALANA SL
TAX NUMBER
B03265527
Identification and
Characteristics
Tax Number B03265527
NAME CALZADOS
ANATOMICOS CALANA SL
ANAGRAM CALANA
SL
FORMER NAME CALZADOS
ANATOMICOS SL
BUSINESS ADDRESS AVENIDA
HISPANOAMERICA, S/N
Postcode 03638
SALINAS (ALICANTE)
FORMER ADDRESS CALLE
LOPE DE VEGA
Postcode 03630
SAX (ALICANTE)
URL http://www.romus.es
TELEPHONE 966973002
FAX 965479292
LEGAL FORM LIMITED
LIABILITY COMPANY
DATE FOUNDED 10/02/1987
CAPITAL 30.050,00 Euros
NUMBER OF EMPLOYEES 93
BANKS BBVA OF
5950; CAM.SALINAS;
ACTIVITY 1451000 - Mfg.
of footwear (mass production)
CNAE 1930 - Manufacture
of footwear
EXPORT COMPANY YES
Synthesis
FINANCIAL SITUATION (Year ending: 31/12/2005)
![]()
PROFITABILITY ![]() 3/9 Negative
3/9 Negative
TREASURY ![]() 7/9 Good
7/9 Good
BALANCE SHEET ![]() 8/9 Very
good
8/9 Very
good
DEBT ![]() 7/9 Low
7/9 Low
INCIDENTS
![]()
COMMITMENTS ![]() 9/9 Respected
9/9 Respected
INCIDENTS ![]() 9/9 None
or Negligible
9/9 None
or Negligible
PREVIOUS EXPERIENCE
![]()
PREVIOUS EXPERIENCE ![]() 8/9 Favourable
8/9 Favourable
Credit Appraisal
CREDIT ACCORDING TO OBJECTIVE DATA (From 0 to 500.000,00 Euros):
FAVOURABLE TOWARDS 319.137,43 Max. Euros
SOLVENCY RATING:
13/20 (BASED ON HOMOGENEOUS FORMULATION)
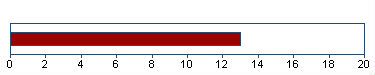
Analysis made on 24/11/2006
Financial Elements
Figures given in
Euros
|
|
Balance
sheet 2.003 (12) |
Balance
sheet 2.004
(12) |
Balance
sheet 2.005
(12) |
%
Sales |
|
SALES |
13.213.007,37 |
10.406.028,44 |
8.525.300,66 |
|
|
ADDED VALUE |
1.893.385,87 |
1.975.725,72 |
1.624.260,07 |
19,05 |
|
BUSINESS RESULT |
517.420,58 |
277.440,97 |
-173.205,96 |
-2,03 |
|
OWN FUNDS |
2.453.481,31 |
2.513.501,09 |
2.162.854,16 |
|
|
DEBT |
2.717.951,36 |
2.003.919,34 |
2.384.070,47 |
|
|
TOTAL ASSET |
5.171.432,67 |
4.517.420,43 |
4.546.924,63 |
|
The sales of 8.525.300,66 Euros show a change of
-18,07% compared with 2.004 . Between 2.003
and 2.004 , this change was -21,24% .
Added value grew by -17,79% compared with the previous year.
Shareholders equity are 2.162.854,16 Euros for an
indebtedness of 2.384.070,47 Euros .
The result -173.205,96 Euros means financial
profitability of -8,01% and economic profitability of
-3,81% . This result means growth of -162,43% compared
with the 2.004 .
THE FIGURES FOR THE LAST BALANCE SHEET ARE RELEVANT:
SOURCE: FROM THE MERCANTILE REGISTER
DATE: 07/11/2006
Auditors’ opinion:
FAVOURABLE (2.004)
Auditors:
MARTINEZ AMOROS JULIO LUIS
Comparative Sector Analysis
|
|
Company |
Sector |
Difference |
|
|
(2.005) |
|
|
|
%
of PRODUCTION VALUE |
|
|
|
|
SALES |
99,12 |
99,32 |
-0,20 |
|
ADDED
VALUE |
18,89 |
15,17 |
3,72 |
|
BUSINESS
RESULT |
-2,01 |
2,40 |
-4,41 |
|
%
OF TOTAL ASSETS |
|
|
|
|
OWN
FUNDS |
47,57 |
37,22 |
10,35 |
|
DEBT |
52,43 |
62,78 |
-10,35 |
Compared sector
(CNAE): 193 - Fabricación de calzado
Number of
companies: 36
Size (Sales
Figure): > 7.000.000,00 Euros
The turnover of the
company is 0,20% below the mean for the sector.
The company’s added
value was 18,89% s/ the production value, and 3,72% above the mean
for the sector.
The company’s
business result was -2,01% of the PV, 4,41% below the mean for the
sector.
The company’s own
resources are 47,57% , 10,35% above the mean for the sector.
The company’s
outside resources are 52,43% , 10,35% below the mean for the
sector.
Legal Actions
No legal incidences registered for this company in
the official source
No claims registered for this company in the
official sources
AFFECTED BY: No significant elemento
Main Board members, Directors and
Auditor
|
Position |
Surname and name |
Date
of appointment |
|
SOLE
ADMINISTRATOR |
ROMERO SANCHEZ
JUAN CARLOS |
29/10/1997 |
|
AUDITOR |
MARTINEZ AMOROS
JULIO LUIS |
30/05/2006 |
Financial Links
|
Shareholders |
||||
|
Company Name |
|
|
Source |
Information Date |
|
NAVARRO AMOROS
ANASTASIO |
|
Indet.
|
OWN SOURCES |
27/03/2006 |
|
PEREZ PEINADO
MARIA JESUS |
|
Indet.
|
OWN SOURCES |
27/03/2006 |
|
ROMERO SANCHEZ
JUAN CARLOS |
|
Indet.
|
OWN SOURCES |
27/03/2006 |
|
Shareholdings |
|||||
|
Company Name |
CIF/Country |
Percent. |
Source |
Information Date |
|
|
|
A82783424 |
1,41%
|
M.REGISTER |
31/12/2002 |
|
|
|
Company
with solvency rating below 7 |
||||
Proceedings published in the
B.O.R.M.E. (Official Mercantile Register Gazette)
|
Proceedings |
Date |
Notice
Num. |
Mercantile
Reg. |
|
Registration of
accounts (2005) |
06/11/2006 |
845400 |
ALICANTE |
|
Re-elections |
30/05/2006 |
276229 |
ALICANTE |
|
Registration of
accounts (2004) |
06/09/2005 |
329858 |
ALICANTE |
|
Re-elections |
12/08/2005 |
357341 |
ALICANTE |
|
Registration of
accounts (2003) |
26/11/2004 |
906357 |
ALICANTE |
Press articles
24/07/2005 LA VERDAD DE
ALICANTE BRANCHES
INFORMATION
LA
EMPRESA CALANA (ROMU S) INAUGURO EL 22/07/05 SU PRIMER ESTABLECIMIENTO EN LA
CIUDAD DE ALICANTE, UBICADA EN LA C/ GERONA N.25. LA CADENA CUENTA CON 8
TIENDAS EN ESPAÑA, EN CAMBRILS, MURCIA, BADAJOZ, VIGO, LA CORUÑA, GIJON, ZA
RAGOZA Y ALICANTE.
01/06/2004 ECONOMIA 3 BRANCHES
INFORMATION
LA
EMPRESA ALICANTINA DE CALZADO CALANA HA EMPRENDIDO LA APERTURA DE TIENDAS
PROPIAS Y FRANQUICIADAS, CON EL OBJETIVO DE LLEGAR A 20 EN 3 AÑOS. DE MOMEN TO,
LA CIA. DISPONE DE 5 TIENDAS ROMU S PROPIAS EN MURCIA, CAMBRILS, VIGO, GIJON Y
BADAJOZ Y EL 01/05/04 ABRIO LA PRIMERA TIENDA FRANQUICIADA EN SEVI LLA. LA
CIA., QUE DEDICA 600.000 EUROS A I+D, PRETENDE DUPLICAR LA FACTURA CION DE 2003
(13,2 MM DE EUROS) Y LLEGAR A FACTURAR 25 MM DE EUROS. PARA HA CER FRENTE A
ESTE CRECIMIENTO, LA CIA. ADQUIRIRA UNA PLANTA DE PRODUCCION DE UNOS 800 MTS.
CUADRADOS DENTRO DE 3 AÑOS, QUE SE SUMARA A LAS 2 ACTUALES DE 2.000 Y 500 MTS.
CUADRADOS RESPECTIVAMENTE.
Complementary Information
En el Deposito de Cuentas del ejercicio 1994, se ha detectado un
descuadre en las siguientes partidas: El Resultado del Pasivo del
ejercicio 1993, no coincide con el que figura en la Cuenta de Perdidas
y Ganancias.
31/10/2002 BLOQUE DE INVESTIGACION:
- Local atribuido en propiedad, sin verificacion.
- Actividad: Fabricacion y comercio al mayor de calzado.
- Realizan transacciones intracomunitarias de venta con Francia y Ale-
mania y exportaciones a EEUU.
----------------------------------------------------------------------
El Bloque de Investigacion no esta sujeto a actualizaciones sistemati
cas.Los datos mostrados fueron aportados por las fuentes consultadas
en la fecha del encabezamiento.
The information on the last account
contained in this report is extracted from the Mercantile Register file of the
legal address of the Company and dated 07/11/2006
Balance Sheet (ASSETS)
|
(Figures given in
Euros) |
31/12/2003 (12)
|
31/12/2004 (12)
|
31/12/2005 (12)
|
|
|
|
A) DUE FROM
SHAREHOLDERS FOR UNCALLED CAPITAL |
|
|
|
|
|
B) FIXED ASSETS |
840.101,64 |
1.755.302,80 |
1.815.389,22 |
|
|
I. Establishment
expenses |
|
|
|
|
|
II. Intangible
assets |
532.966,57 |
476.207,03 |
456.930,87 |
|
|
Software |
2.813,97 |
2.813,97 |
2.813,97 |
|
|
Leasing |
583.259,16 |
604.128,39 |
625.815,44 |
|
|
Amortization |
-53.106,56 |
-130.735,33 |
-171.698,54 |
|
|
III. Tangible
assets |
117.692,26 |
220.308,55 |
273.706,44 |
|
|
Property, plant
and equipment |
|
157.555,32 |
157.555,32 |
|
|
Machinery,
equipment and other |
463.616,87 |
473.894,18 |
589.931,66 |
|
|
Other property
plant and equipement |
51.413,66 |
51.413,66 |
51.413,66 |
|
|
Other assets |
127.843,56 |
125.803,19 |
156.916,62 |
|
|
Depreciation |
-525.181,83 |
-588.357,80 |
-682.110,82 |
|
|
IV. Financial
assets |
189.442,81 |
1.058.787,22 |
1.084.751,91 |
|
|
Securities |
189.442,81 |
1.041.942,18 |
1.062.296,87 |
|
|
Long term
deposits and guarantees |
|
16.845,04 |
22.455,04 |
|
|
V. Owners equity |
|
|
|
|
|
VI. Long term
trade liabilities |
|
|
|
|
|
C) DEFERRED
EXPENSES |
18.496,35 |
8.019,94 |
5.992,02 |
|
|
D) CURRENT ASSETS |
4.312.834,68 |
2.754.097,69 |
2.725.543,39 |
|
|
I. Not paid in
shareholder capital |
|
|
|
|
|
II. Inventory |
626.171,33 |
869.357,17 |
1.230.855,35 |
|
|
Raw material
inventory |
294.062,28 |
413.612,55 |
677.253,84 |
|
|
Work in Progress |
44.318,19 |
47.812,32 |
91.122,65 |
|
|
Finished goods |
287.790,86 |
407.932,30 |
462.478,86 |
|
|
III. Debtors |
1.993.817,10 |
1.215.589,10 |
1.321.652,80 |
|
|
Clients |
1.732.907,03 |
1.184.330,28 |
1.024.129,14 |
|
|
Other debts |
18.001,80 |
4.318,26 |
289.980,95 |
|
|
Taxes refunds |
275.710,74 |
127.938,11 |
109.702,08 |
|
|
Provisions |
-32.802,47 |
-100.997,55 |
-102.159,37 |
|
|
IV. Short term
financial assets |
600.000,00 |
|
|
|
|
Short term
investment |
600.000,00 |
|
|
|
|
V. Short term
owners equity |
|
|
|
|
|
VI. Cash |
1.092.846,25 |
669.151,42 |
173.035,24 |
|
|
VII. Prepaid expenses
and accrued income |
|
|
|
|
|
ASSETS (A + B + C
+ D) |
5.171.432,67 |
4.517.420,43 |
4.546.924,63 |
Balance Sheet (LIABILITIES)
|
(Figures given in
Euros) |
31/12/2003 (12)
|
31/12/2004 (12)
|
31/12/2005 (12)
|
|
|
|
A) SHAREHOLDERS
EQUITY |
2.453.481,31 |
2.513.501,09 |
2.162.854,16 |
|
|
I. Capital |
30.050,00 |
30.050,00 |
30.050,00 |
|
|
II. Premium share
account |
|
|
|
|
|
III. Revaluation
reserve |
|
|
|
|
|
IV. Reserves |
1.906.010,73 |
2.206.010,12 |
2.306.010,12 |
|
|
Retained earnings |
6.010,12 |
6.010,12 |
6.010,12 |
|
|
Other funds |
1.900.000,61 |
2.200.000,00 |
2.300.000,00 |
|
|
V. Prior year
earnings |
|
|
|
|
|
VI. Prior year
profit or losses |
517.420,58 |
277.440,97 |
-173.205,96 |
|
|
VII. Dividend
paid during the year |
|
|
|
|
|
VIII. Own shares
for change in capital |
|
|
|
|
|
B) DEFERRED
INCOME |
|
|
|
|
|
C) PROVISIONS FOR
LIABILITIES AND EXPENSES |
|
|
|
|
|
D) LONG TERM
LIABILITIES |
418.811,96 |
129.948,98 |
80.252,31 |
|
|
I. Bonds |
|
|
|
|
|
II. Bank loans |
|
|
|
|
|
III. Debts with
associed and affiliated companies |
|
|
|
|
|
IV. Other
creditors |
418.811,96 |
129.948,98 |
80.252,31 |
|
|
Other debts |
418.811,96 |
129.948,98 |
80.252,31 |
|
|
V. Deferred debts
on shares |
|
|
|
|
|
VI. Long term
debt with creditor |
|
|
|
|
|
E) SHORT TERM
LIABILITIES |
2.299.139,40 |
1.873.970,36 |
2.303.818,16 |
|
|
I. Negotiable
bonds |
|
|
|
|
|
II. Bank loans |
670.719,99 |
199.909,42 |
775.931,98 |
|
|
Loans and other
debts |
670.719,99 |
199.909,42 |
775.931,98 |
|
|
III. Short term
debts with associated and affiliated companies |
|
|
|
|
|
IV. Trade
creditors |
1.405.730,22 |
1.516.095,20 |
1.338.683,12 |
|
|
Accounts payable |
|
580.000,00 |
431.822,93 |
|
|
Expenses |
1.405.730,22 |
936.095,20 |
906.860,19 |
|
|
V. Other non
trade payables |
222.689,19 |
157.965,74 |
189.203,06 |
|
|
Government |
222.689,19 |
157.965,74 |
189.203,06 |
|
|
VI. Provisions
for current assets |
|
|
|
|
|
VII. Accruals and
deferred incomes |
|
|
|
|
|
F) SHORT TERM
PROVISIONS FOR LIABILITIES AND EXPENSES |
|
|
|
|
|
LIABILITIES (A +
B + C + D + E + F) |
5.171.432,67 |
4.517.420,43 |
4.546.924,63 |
Profit and Loss Account
|
(Figures given in
Euros) |
31/12/2003 (12)
|
31/12/2004 (12)
|
31/12/2005 (12)
|
|
|
|
A) EXPENSES (A.1
a A.16) |
|
|
|
|
|
A.1. Change in
stocks of finished goods and work in progress |
226.171,09 |
|
|
|
|
A.2. Supplies |
9.093.251,43 |
6.457.060,19 |
5.405.075,49 |
|
|
Material consumed |
|
|
36.053,62 |
|
|
Raw materials
consumed |
6.197.281,93 |
4.226.760,31 |
3.477.090,02 |
|
|
Other expenses |
2.895.969,50 |
2.230.299,88 |
1.891.931,85 |
|
|
A.3. Labor cost |
1.052.673,55 |
1.333.322,64 |
1.796.067,24 |
|
|
Wages |
803.246,78 |
1.033.982,17 |
1.406.266,46 |
|
|
Social security
expenses |
249.426,77 |
299.340,47 |
389.800,78 |
|
|
A.4. Assets
depreciation |
76.017,46 |
120.886,13 |
135.032,03 |
|
|
A.5 Variance in
provision for current assets |
|
80.799,92 |
2.102,52 |
|
|
Variance in
provision for bad debts |
|
80.799,92 |
940,70 |
|
|
Variance in
provision for other current assets |
|
|
1.161,82 |
|
|
A.6. Other
operating costs |
2.038.040,30 |
2.121.976,26 |
1.932.930,42 |
|
|
External costs |
2.035.528,74 |
2.114.126,15 |
1.893.251,30 |
|
|
Taxes |
2.511,56 |
7.850,11 |
39.679,12 |
|
|
A.I. OPERATING
RESULT (B.1+B.2+B.3+B.4-A.1-A.2-A.3-A.4-A.5-A.6) |
764.694,86 |
440.717,03 |
|
|
|
A.7. Financial
expenses |
105.030,24 |
102.724,87 |
61.082,31 |
|
|
Other companies
debts |
105.030,24 |
102.724,87 |
61.082,31 |
|
|
A.8. Variation in
financial investments provision |
|
|
|
|
|
A.9. Exchange
losses |
|
3.756,74 |
|
|
|
A.II. POSITIVE
FINANCIAL RESULTS (B.5+B.6+B.7+B.8-A.7-A.8-A.9) |
|
|
56.997,91 |
|
|
A.III. PROFIT
FROM ORDINARY ACTIVITIES (A.I+A.II-B.I-B.II) |
669.152,51 |
400.984,51 |
|
|
|
A.10. Variation
in provision in fixed assets |
|
|
|
|
|
A.11. Losses in
fixed assets |
|
|
|
|
|
A.12. Losses from
shares and bonds |
|
|
|
|
|
A.13.
Extraordinary charges |
4.261,90 |
394,41 |
9.922,03 |
|
|
A.14. Prior
year’s expenses and losses |
|
53.843,93 |
14.790,77 |
|
|
A.IV. POSITIVE
EXTRAORDINARY RESULT (B.9+B.10+B.11+B.12+B.13-A.10-A.11-A.12-A.13-A.14) |
3.665,95 |
|
78.737,85 |
|
|
A.V. EARNINGS /
LOSS BEFORE TAXES (A.III+A.IV-B.III-B.IV) |
672.818,46 |
380.778,39 |
|
|
|
A.15. Corporate
Taxes |
155.397,88 |
103.337,42 |
|
|
|
A.16. Other taxes |
|
|
|
|
|
A.VI. YEAR END
RESULT (PROFIT) (A.V-A.15-A.16) |
517.420,58 |
277.440,97 |
|
|
|
B) INCOMES (B.1 a
B13) |
|
|
|
|
|
B.1. Turnover |
13.213.007,37 |
10.406.028,44 |
8.525.300,66 |
|
|
Sales |
13.213.007,37 |
10.406.028,44 |
8.525.300,66 |
|
|
B.2. Increase in
inventory of finished goods |
|
123.635,57 |
361.498,18 |
|
|
B.3. Expenses
capitalized |
|
|
|
|
|
B.4. Other
operating income |
37.841,32 |
25.098,16 |
75.467,14 |
|
|
Other incomes |
2.936,00 |
|
|
|
|
Grants |
34.905,32 |
25.098,16 |
75.467,14 |
|
|
B.I. OPERATING
LOSSES (A.1+A.2+A.3+A.4+A.5+A.6-B.1-B.2-B.3-B.4) |
|
|
308.941,72 |
|
|
B.5. Incomes from
share |
1.334,01 |
1.907,48 |
12.578,93 |
|
|
From other
companies |
1.334,01 |
1.907,48 |
12.578,93 |
|
|
B.6. Income from
securities |
|
993,70 |
245,90 |
|
|
Other companies |
|
993,70 |
245,90 |
|
|
B.7. Other income
from interrest |
8.153,88 |
63.847,91 |
101.586,30 |
|
|
From other
companies |
8.153,88 |
63.847,91 |
|
|
|
Gains from
investments |
|
|
101.586,30 |
|
|
B.8. Gains on
exchange |
|
|
3.669,09 |
|
|
B.II. FINANCIAL
LOSSES (A.7+A.8+A.9-B.5-B.6-B.7-B.8) |
95.542,35 |
39.732,52 |
|
|
|
B.III. LOSSES
FROM ORDINARY ACTIVITIES (B.I+B.II-A.I-A.II) |
|
|
251.943,81 |
|
|
B.9. Gains from
disposal of fixed assets |
350,52 |
5.252,60 |
|
|
|
B.10. Gains from
dealing in own shares |
|
|
|
|
|
B.11. Paid in
surplus |
|
|
|
|
|
B.12.
Extraordinary income |
7.576,09 |
4.979,60 |
29.734,64 |
|
|
B.13. Prior
year’s income and profits |
1,24 |
23.800,02 |
73.716,01 |
|
|
B.IV.
EXTRAORDINARY LOSSES (A.10+A.11+A.12+A.13+A.14-B.9-B.10-B.11-B.12-B.13) |
|
20.206,12 |
|
|
|
B.V. LOSS BEFORE
TAXES (B.III+B.IV-A.III-A.IV) |
|
|
173.205,96 |
|
|
B.VI. NET LOSS
(B.V+A.15+A.16) |
|
|
173.205,96 |
Main Ratios
|
(Figures given in
Euros) |
2.003 (12)
|
2.004 (12)
|
2.005 (12)
|
|
|
|
ACTIVITY |
|
|
|
|
|
Increase of the
Sales Figures |
16,65 |
-21,24 |
-18,07 |
|
|
Assets Turnover |
2,56 |
2,30 |
1,88 |
|
|
Productivity |
1,80 |
1,48 |
0,90 |
|
|
Increase of the
Added Value |
-2,29 |
4,35 |
-17,79 |
|
|
PROFITABILITY |
|
|
|
|
|
Economic
Profitability |
10,01 |
6,14 |
-3,81 |
|
|
Financial
Profitability |
21,09 |
11,04 |
-8,01 |
|
|
Financial
Expenses |
0,80 |
0,99 |
0,72 |
|
|
BALANCE (IN DAYS
OF SALES) |
|
|
|
|
|
Customers’ Credit
(In days of sales) |
54,00 |
42,00 |
56,00 |
|
|
Suppliers’ Credit
(In days of sales) |
54,00 |
86,00 |
96,00 |
|
|
Working Capital
(In days of sales) |
55,00 |
30,00 |
18,00 |
|
|
Working Capital
Requirement (In days of sales) |
27,00 |
14,00 |
43,00 |
|
|
Treasury (In days
of sales) |
28,00 |
16,00 |
0,00 |
|
|
BALANCE |
|
|
|
|
|
Working Capital |
2.013.695,28 |
880.127,33 |
421.725,23 |
|
|
Working Capital
Requirement |
991.569,02 |
410.885,33 |
1.024.621,97 |
|
|
Treasury |
1.022.126,26 |
469.242,00 |
-602.896,74 |
|
|
Balance Ratio |
3,35 |
1,50 |
1,23 |
|
|
SOLVENCY |
|
|
|
|
|
Borrowing Ratio |
52,56 |
44,36 |
52,43 |
|
|
Own / Permanent
Funds |
85,42 |
95,08 |
96,42 |
|
|
Payback Capacity |
0,21 |
0,19 |
0,28 |
|
|
LIQUIDITY |
|
|
|
|
|
General Liquidity |
1,88 |
1,47 |
1,18 |
|
|
Immediate
Liquidity |
0,74 |
0,36 |
0,08 |
Sectorial Analysis
Summary of Assets, Liability
& Equity
|
(Figures given in
Percentages) |
Company |
Sector |
Company |
|
|
2.005 |
|
|
|
Assets |
|||
|
DUE
FROM SHAREHOLDERS FOR UNCALLED CAPITAL |
0,00 |
0,00 |
0,00 |
|
FIXED
ASSETS |
39,93 |
27,00 |
12,93 |
|
ACCRUED
EXPENSES |
0,13 |
0,19 |
-0,06 |
|
CURRENT
ASSETS |
59,94 |
72,81 |
-12,87 |
|
TOTAL
ASSETS |
100,00 |
100,00 |
0,00 |
|
Liabilities |
|||
|
SHAREHOLDERS
EQUITY |
47,57 |
37,22 |
10,35 |
|
ACCRUED
INCOME |
0,00 |
0,45 |
-0,45 |
|
RISK
AND EXPENDITURE COVER |
0,00 |
0,01 |
-0,01 |
|
LONG-TERM
CREDITORS |
1,76 |
5,52 |
-3,76 |
|
SHORT-TERM
CREDITORS |
50,67 |
56,80 |
-6,13 |
|
SHORT-TERM
RISK AND EXPENDITURE COVER |
0,00 |
0,00 |
0,00 |
|
TOTAL
LIABILITIES |
100,00 |
100,00 |
0,00 |
Analytical Account of Results
|
(Figures given in
Percentages) |
Company |
Sector |
Company |
|
|
2.005 |
|
|
|
Net
turnover |
99,12 |
99,32 |
-0,20 |
|
Other
operating income |
0,88 |
0,68 |
0,20 |
|
Production
Value |
100,00 |
100,00 |
0,00 |
|
Operating
expenses |
58,64 |
71,61 |
-12,97 |
|
Other
operation expenses |
22,47 |
13,22 |
9,26 |
|
Added
value |
18,89 |
15,17 |
3,71 |
|
Labor
cost |
20,88 |
8,20 |
12,68 |
|
Gross
Economic Result |
-2,00 |
6,97 |
-8,97 |
|
Assets
depreciation |
1,57 |
1,84 |
-0,27 |
|
Variation
in provision for current assets |
0,02 |
0,29 |
-0,27 |
|
Net
Economic Result |
-3,59 |
4,84 |
-8,44 |
|
Financial
income |
1,37 |
0,64 |
0,73 |
|
Financial
expenses |
0,71 |
1,99 |
-1,28 |
|
Variation
in financial investment provision |
0,00 |
0,00 |
-0,00 |
|
Ordinary
Activities Result |
-2,93 |
3,50 |
-6,42 |
|
Extraordinary
income |
1,20 |
0,22 |
0,99 |
|
Extraordinary
expenses |
0,29 |
0,19 |
0,09 |
|
Variation
in provision in fixed assets |
0,00 |
-0,00 |
0,00 |
|
Results
before Taxes |
-2,01 |
3,52 |
-5,53 |
|
Corporaye
taxes |
0,00 |
1,12 |
-1,12 |
|
Net
Result |
-2,01 |
2,40 |
-4,41 |
|
Assets
depreciation |
1,57 |
1,84 |
-0,27 |
|
Provisions
fund variation |
0,02 |
0,29 |
-0,27 |
|
Net
Self-Financing |
-0,42 |
4,53 |
-4,95 |
Ratios
|
(Figures given in
) |
Company |
Ptile25
|
Medium
|
Ptile75
|
|
|
2.005 |
|
|
|
|
ACTIVITY |
|
|
|
|
|
Increase
of the Sales Figures |
-18,07 |
-12,19 |
-3,11 |
11,51 |
|
Assets
Turnover |
1,88 |
1,44 |
1,92 |
2,51 |
|
Fixed
Assets Turnover |
4,68 |
6,06 |
7,91 |
14,19 |
|
Increase
of the Added Value |
-17,79 |
-10,46 |
2,12 |
17,78 |
|
PRODUCTIVITY |
|
|
|
|
|
Productivity |
0,90 |
1,51 |
1,96 |
2,61 |
|
Change
of Personnel Costs |
34,71 |
-1,04 |
5,55 |
12,40 |
|
Average
Personnel Costs |
20.409,86 |
14.665,04 |
16.628,81 |
22.452,09 |
|
Value
Added by Employees |
18.457,50 |
24.788,04 |
33.804,20 |
47.495,35 |
|
CASH FLOW |
|
|
|
|
|
Cash
Flow |
-36.071,41 |
252.235,75 |
389.139,91 |
901.698,39 |
|
Operating
Cash Flow |
-171.807,17 |
443.811,49 |
677.887,19 |
1.206.125,86 |
|
Change
in Cash Flow |
-107,53 |
-29,86 |
-5,48 |
22,97 |
|
PROFITABILITY |
|
|
|
|
|
Economic
Profitability |
-3,81 |
1,83 |
3,59 |
5,45 |
|
Financial
Profitability |
-8,01 |
5,71 |
12,18 |
18,72 |
|
Financial
Expenses |
0,72 |
0,69 |
1,40 |
2,40 |
|
Gross
Economic Profitability |
-3,78 |
9,59 |
12,12 |
13,98 |
|
Gross
Financial Profitability |
-7,94 |
26,80 |
42,81 |
64,33 |
|
BALANCE (IN DAYS
OF SALES) |
|
|
|
|
|
Customers’
Credit (In days of sales) |
55,00 |
51,51 |
65,24 |
89,77 |
|
Suppliers’
Credit (In days of sales) |
95,00 |
56,62 |
92,37 |
134,16 |
|
Working
Capital (In days of sales) |
17,00 |
-1,58 |
20,34 |
50,54 |
|
Working
Capital Requirement (In days of sales) |
43,00 |
7,44 |
37,65 |
81,37 |
|
Treasury
(In days of sales) |
0,00 |
-43,99 |
-16,80 |
2,17 |
|
Operating
Current Assets |
115,00 |
105,73 |
139,51 |
182,18 |
|
BALANCE |
|
|
|
|
|
Working
Capital |
421.725,23 |
-40.154,98 |
772.190,30 |
1.936.825,22 |
|
Working
Capital Requirement |
1.024.621,97 |
193.754,38 |
1.298.228,16 |
2.535.308,11 |
|
Treasury |
-602.896,74 |
-1.275.001,64 |
-643.631,52 |
103.848,98 |
|
Balance
Ratio |
1,23 |
0,99 |
1,55 |
2,20 |
|
SOLVENCY |
|
|
|
|
|
Borrowing
Ratio |
52,43 |
54,32 |
68,98 |
79,49 |
|
Own
/ Permanent Funds |
96,42 |
81,14 |
96,23 |
99,92 |
|
Payback
Capacity |
0,28 |
0,25 |
0,31 |
0,45 |
|
Long
term Indebtedness |
1,76 |
0,01 |
1,39 |
5,65 |
|
Gearing |
210,23 |
219,98 |
323,11 |
487,49 |
|
Financing
Basic Ratio |
1,00 |
1,00 |
1,00 |
1,02 |
|
Assets
Guarantee |
1,90 |
1,20 |
1,41 |
1,80 |
|
LIQUIDITY |
|
|
|
|
|
General
Liquidity |
1,18 |
0,99 |
1,18 |
1,53 |
|
Immediate
Liquidity |
0,08 |
0,04 |
0,09 |
0,25 |
The date when this report was last updated
is 24/11/2006.
This company was last displayed
on 29/11/2006,
it has been viewed 8 times
in the last quarter and 179 times in total .
RATING EXPLANATIONS
|
RATING |
STATUS |
PROPOSED CREDIT LINE |
|
|
>86 |
Aaa |
Possesses an extremely sound financial
base with the strongest capability for timely payment of interest and
principal sums |
Unlimited |
|
71-85 |
Aa |
Possesses adequate working capital. No
caution needed for credit transaction. It has above average (strong)
capability for payment of interest and principal sums |
Large |
|
56-70 |
A |
Financial & operational base are
regarded healthy. General unfavourable factors will not cause fatal effect.
Satisfactory capability for payment of interest and principal sums |
Fairly Large |
|
41-55 |
Ba |
Overall operation is considered normal.
Capable to meet normal commitments. |
Satisfactory |
|
26-40 |
B |
Unfavourable & favourable factors
carry similar weight in credit consideration. Capability to overcome
financial difficulties seems comparatively below average/normal. |
Small |
|
11-25 |
Ca |
Adverse factors are apparent. Repayment of
interest and principal sums in default or expected to be in default upon
maturity |
Limited with full security |
|
<10 |
C |
Absolute credit risk exists. Caution
needed to be exercised |
Credit not recommended |
|
NR |
In view of the lack of information, we
have no basis upon which to recommend credit dealings |
No Rating |
|