
MIRA
INFORM REPORT
|
Report Date : |
29th
November, 2006 |
IDENTIFICATION
DETAILS
|
Name : |
TEXET
HARVEST ESPANA SL |
|
|
|
|
Formerly Known As : |
SWEDISH MATCH ADVERTISING PRODUCTS S.L |
|
|
|
|
Registered Office : |
Calle Montevideo, 10 28806
Alcala De Henares (Madrid) |
|
|
|
|
Country : |
Spain |
|
|
|
|
Financials (as on) : |
31.12.2005 |
|
|
|
|
Date of Incorporation : |
20.11.1991 |
|
|
|
|
Legal Form : |
Limited Liability Company |
|
|
|
|
Line of Business : |
Wholesaler of Textiles |
RATING & COMMENTS
|
MIRA’s Rating : |
Ba |
|
RATING |
STATUS |
PROPOSED CREDIT LINE |
|
|
41-55 |
Ba |
Overall operation is considered normal.
Capable to meet normal commitments. |
Satisfactory |
|
Status : |
Good |
|
|
|
|
Payment Behaviour : |
Usually
Correct |
|
|
|
|
Litigation : |
Clear |
Company name
TEXET
HARVEST ESPANA SL.
TAX NUMBER
B80171523
Identification and
Characteristics
Tax Number B80171523
NAME TEXET
HARVEST ESPANA SL.
FORMER NAME SWEDISH
MATCH ADVERTISING PRODUCTS S.L.
BUSINESS ADDRESS CALLE
MONTEVIDEO, 10
Postcode 28806
ALCALA DE HENARES (MADRID)
FORMER ADDRESS CALLE
AREQUIPA, 1
Postcode 28043
MADRID (MADRID)
TELEPHONE 918300279
FAX 918300264
LEGAL FORM LIMITED
LIABILITY COMPANY
DATE FOUNDED 20/11/1991
CAPITAL 865.175,56 Euros
NUMBER OF EMPLOYEES 13
ACTIVITY 1617100 - Wholesale
of textiles
CNAE 5141 - Wholesale
of textiles
EXPORT COMPANY YES
IMPORT COMPANY YES
Synthesis
FINANCIAL SITUATION (Year ending: 31/12/2005)
![]()
PROFITABILITY ![]() 1/9 Negative
1/9 Negative
TREASURY ![]() 9/9 Excellent
9/9 Excellent
BALANCE SHEET ![]() 9/9 Excellent
9/9 Excellent
DEBT ![]() 7/9 Low
7/9 Low
INCIDENTS
![]()
COMMITMENTS ![]() 9/9 Respected
9/9 Respected
INCIDENTS ![]() 9/9 None
or Negligible
9/9 None
or Negligible
PREVIOUS EXPERIENCE
![]()
PREVIOUS EXPERIENCE ![]() 8/9 Favourable
8/9 Favourable
Credit Appraisal
CREDIT ACCORDING TO OBJECTIVE DATA (From 0 to 500.000,00 Euros):
FAVOURABLE TOWARDS 74.525,50 Max. Euros
SOLVENCY RATING:
14/20 (BASED ON HOMOGENEOUS FORMULATION)
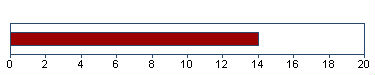
Analysis made on 28/11/2006
Financial Elements
Figures
given in Euros
|
|
Balance
sheet 2.003 (12) |
Balance
sheet 2.004
(12) |
Balance
sheet 2.005
(12) |
%
Sales |
|
SALES |
7.153.198,60 |
2.222.197,42 |
2.989.902,01 |
|
|
ADDED VALUE |
1.087.878,70 |
196.179,30 |
146.801,18 |
4,91 |
|
BUSINESS RESULT |
-101.613,55 |
-232.473,09 |
-425.672,54 |
-14,23 |
|
OWN FUNDS |
2.028.389,54 |
1.795.916,45 |
1.370.243,91 |
|
|
DEBT |
397.487,34 |
1.653.240,73 |
1.859.315,86 |
|
|
TOTAL ASSET |
2.425.876,88 |
3.449.157,18 |
3.229.559,77 |
|
The sales of 2.989.902,01 Euros show a change of 34,55% compared with 2.004 . Between 2.003 and 2.004 , this change was -68,93% .
Added value grew by -25,17% compared with the previous year.
Shareholders equity are 1.370.243,91 Euros for an
indebtedness of 1.859.315,86 Euros .
The result -425.672,54 Euros means financial
profitability of -31,07% and economic profitability of
-13,18% . This result means growth of -83,11% compared
with the 2.004 .
THE FIGURES FOR THE LAST BALANCE SHEET ARE RELEVANT:
SOURCE: FROM THE MERCANTILE REGISTER
DATE: 24/11/2006
Auditors’ opinion:
FAVOURABLE (2.005)
Auditors:
DE JUAN CARREÑO LUIS
Comparative Sector Analysis
|
|
Company |
Sector |
Difference |
|
|
(2.005) |
|
|
|
%
of PRODUCTION VALUE |
|
|
|
|
SALES |
100,00 |
98,86 |
1,14 |
|
ADDED
VALUE |
4,91 |
16,37 |
-11,46 |
|
BUSINESS
RESULT |
-14,24 |
2,69 |
-16,93 |
|
%
OF TOTAL ASSETS |
|
|
|
|
OWN
FUNDS |
42,43 |
36,34 |
6,09 |
|
DEBT |
57,57 |
63,66 |
-6,09 |
Compared sector
(CNAE): 514 - Comercio al por mayor de productos de
consumo, distinto de los alimenticios
Number of
companies: 873
Size (Sales
Figure): 2.800.000,00 - 7.000.000,00 Euros
The turnover of the
company is 1,14% above the mean for the sector.
The company’s added
value was 4,91% s/ the production value, and 11,46% below the mean
for the sector.
The company’s
business result was -14,24% of the PV, 16,93% below the mean for
the sector.
The company’s own
resources are 42,43% , 6,09% above the mean for the sector.
The company’s
outside resources are 57,57% , 6,09% below the mean for the sector.
Legal Actions
No legal incidences registered for this company in
the official source
No claims registered for this company in the
official sources
AFFECTED BY: No significant elemento
Main Board members, Directors and
Auditor
|
Position |
Surname and name |
Date
of appointment |
|
CHAIRMAN |
HARSTEDT CARL
GORAN |
23/02/2004 |
|
BOARD MEMBER |
JANSSON ULF
TORSTEN |
23/02/2004 |
|
BOARD MEMBER |
GARCES ESTEBAN
JAVIER |
29/09/2006 |
|
SECRETARY |
RUIZ PEREZ JOSE
ANGEL |
23/02/2004 |
|
AUDITOR |
DE JUAN CARRENO
LUIS |
01/02/2005 |
Financial Links
|
Shareholders |
||||
|
Company Name |
CIF/Country |
|
Source |
Information Date |
|
EBAS GROUP BV |
PAÍSES BAJOS |
100,00%
|
M.REGISTER |
31/12/2005 |
Proceedings published in the
B.O.R.M.E. (Official Mercantile Register Gazette)
|
Proceedings |
Date |
Notice
Num. |
Mercantile
Reg. |
|
Registration of
accounts (2005) |
14/11/2006 |
880026 |
MADRID |
|
Resignations |
29/09/2006 |
473850 |
MADRID |
|
Appointments |
29/09/2006 |
473850 |
MADRID |
|
Resignations |
26/01/2006 |
041755 |
MADRID |
|
Appointments |
26/01/2006 |
041755 |
MADRID |
Press articles
10/08/2001 CINCO
DIAS LEGAL ANNOUNCE
LAS SDADES. SWEDISH MATCH IBERIA, S.A. (SDAD.
PARCIALMENTE ESCINDIDA) Y SWEDISH MATCH ADVERTISING PRODUCTS, S.L. (SDAD.
BENEFICIARIA), HAN ACORDADO, CON FECHA 29/6/2001, APROBAR LA ESCISION PARCIAL
DE LA SDAD., EN VIRTUD DE LO CUAL, SEGREGA PARTE DE SU PATRIMONIO SOCIAL
FORMADO POR UNA UNIDAD ECONO MICA CONSISTENTE EN LA RAMA DE ACTIVIDAD DE
PUBLICIDAD A LA SDAD. BENEFICIA RIA.
23/02/1995 GACETA
NEG LEGAL ANNOUNCE
LA SDAD. HA CAMBIADO SU DOMICILIO SOCIAL POR
ACUERDO DE LA JUNTA GENERAL EX TRAORDINARIA CON CARACTER UNIVERSAL DE 14-11-94,
DE LA C/CARDENAL MARCO SPI NOLA, N.12, CUARTA PLANTA, DE MADRID, A LAS OFICINAS
DEL CENTRO COMERICAL GRAN VIA HORTALEZA, SITAS EN LA C/AREQUIPA, N.1, TERCERA
PLANTA, TAMBIEN DE MADRID.
Complementary Information
Segun BORME de 02/04/02 esta sdad. ha sido beneficiaria de la esci-
sion parcial de SWEDISH MATCH IBERIA SA NIF:A78480696.
The information on the last account
contained in this report is extracted from the Mercantile Register file of the
legal address of the Company and dated 24/11/2006
Balance Sheet (ASSETS)
|
(Figures given in
Euros) |
31/12/2003 (12)
|
31/12/2004 (12)
|
31/12/2005 (12)
|
|
|
|
A) DUE FROM
SHAREHOLDERS FOR UNCALLED CAPITAL |
|
|
|
|
|
B) FIXED ASSETS |
10.613,37 |
224.099,53 |
218.548,22 |
|
|
I. Establishment
expenses |
|
|
|
|
|
II. Intangible
assets |
|
|
|
|
|
III. Tangible
assets |
10.613,37 |
200.061,53 |
191.388,06 |
|
|
IV. Financial
assets |
|
24.038,00 |
27.160,16 |
|
|
V. Owners equity |
|
|
|
|
|
VI. Long term
trade liabilities |
|
|
|
|
|
C) DEFERRED
EXPENSES |
|
|
|
|
|
D) CURRENT ASSETS |
2.415.263,51 |
3.225.057,65 |
3.011.011,55 |
|
|
I. Not paid in
shareholder capital |
|
|
|
|
|
II. Inventory |
36.554,09 |
1.005.826,51 |
1.432.432,58 |
|
|
III. Debtors |
977.316,92 |
908.670,03 |
1.170.887,61 |
|
|
IV. Short term
financial assets |
1.125.085,42 |
|
22.838,00 |
|
|
V. Short term
owners equity |
|
|
|
|
|
VI. Cash |
270.710,08 |
1.295.908,18 |
364.429,92 |
|
|
VII. Prepaid
expenses and accrued income |
5.597,00 |
14.652,93 |
20.423,44 |
|
|
ASSETS (A + B + C
+ D) |
2.425.876,88 |
3.449.157,18 |
3.229.559,77 |
Balance Sheet (LIABILITIES)
|
(Figures given in
Euros) |
31/12/2003 (12)
|
31/12/2004 (12)
|
31/12/2005 (12)
|
|
|
|
A) SHAREHOLDERS
EQUITY |
2.028.389,54 |
1.795.916,45 |
1.370.243,91 |
|
|
I. Capital |
865.175,56 |
865.175,56 |
865.175,56 |
|
|
II. Premium share
account |
865.211,73 |
865.211,73 |
865.211,73 |
|
|
III. Revaluation
reserve |
|
|
|
|
|
IV. Reserves |
399.615,80 |
298.002,25 |
298.002,25 |
|
|
Capital
adjustments in Euros |
1,33 |
1,33 |
|
|
|
Sundry reserves |
399.614,47 |
298.000,92 |
298.002,25 |
|
|
V. Prior year
earnings |
|
|
-232.473,09 |
|
|
VI. Prior year
profit or losses |
-101.613,55 |
-232.473,09 |
-425.672,54 |
|
|
VII. Dividend
paid during the year |
|
|
|
|
|
VIII. Own shares
for change in capital |
|
|
|
|
|
B) DEFERRED INCOME |
|
|
|
|
|
C) PROVISIONS FOR
LIABILITIES AND EXPENSES |
|
|
|
|
|
D) LONG TERM
LIABILITIES |
|
|
|
|
|
E) SHORT TERM
LIABILITIES |
397.487,34 |
1.653.240,73 |
1.859.315,86 |
|
|
F) SHORT TERM
PROVISIONS FOR LIABILITIES AND EXPENSES |
|
|
|
|
|
LIABILITIES (A +
B + C + D + E + F) |
2.425.876,88 |
3.449.157,18 |
3.229.559,77 |
Profit and Loss Account
|
(Figures given in
Euros) |
31/12/2003 (12)
|
31/12/2004 (12)
|
31/12/2005 (12)
|
|
|
|
A) EXPENSES (A.1
a A.15) |
|
|
|
|
|
A.1 Operating
Expenses |
5.118.068,70 |
1.405.836,34 |
1.759.917,91 |
|
|
A.3. Labor cost |
1.080.767,22 |
346.177,58 |
463.005,93 |
|
|
Wages |
839.069,12 |
244.809,23 |
340.147,69 |
|
|
Social security
expenses |
241.698,10 |
101.368,35 |
122.858,24 |
|
|
A.3. Assets
depreciation |
14.572,02 |
36.210,38 |
54.902,77 |
|
|
A.4. Variance in
provision for current assets |
44.936,61 |
28.619,16 |
16.653,29 |
|
|
A.5. Other
operating costs |
947.251,20 |
621.257,13 |
1.083.182,92 |
|
|
A.I. OPERATING
RESULT (B.1-A.1-A.2-A.3-A.4-A.5) |
|
|
|
|
|
A.6. Financial
expenses |
41.368,78 |
38.216,86 |
39.681,19 |
|
|
Debts with
related companies |
23.106,85 |
32.622,00 |
34.032,25 |
|
|
Other companies
debts |
18.261,93 |
5.594,86 |
5.648,94 |
|
|
A.7. Variation in
financial investments provision |
|
|
|
|
|
A.8. Exchange
losses |
26.255,14 |
|
496,93 |
|
|
A.II. POSITIVE
FINANCIAL RESULTS (B.2+B.3-A.6-A.7-A.8) |
|
|
|
|
|
A.III. PROFIT
FROM ORDINARY ACTIVITIES (A.I+A.II-B.I-B.II) |
|
|
|
|
|
A.9. Variation in
provision in fixed assets |
|
|
|
|
|
A.10. Losses in
fixed assets |
|
|
|
|
|
A.11. Losses from
shares and bonds |
|
|
|
|
|
A.12.
Extraordinary charges |
1.048,51 |
6.503,33 |
885,45 |
|
|
A.13. Prior
year’s expenses and losses |
|
|
|
|
|
A.IV. POSITIVE
EXTRAORDINARY RESULT (B.4+B.5+B.6+B.7+B.8-A.9-A.10-A.11-A.12-A.13) |
35,27 |
|
|
|
|
A.V. EARNINGS /
LOSS BEFORE TAXES (A.III+A.IV-B.III-B.IV) |
|
|
|
|
|
A.14. Corporate
Taxes |
5.109,00 |
|
|
|
|
A.15. Other taxes |
|
|
|
|
|
A.VI. YEAR END
RESULT (PROFIT) (A.V-A.14-A.15) |
|
|
|
|
|
B) INCOMES (B.1 a
B.8) |
|
|
|
|
|
B.1. Operating
income |
7.153.198,60 |
2.223.272,77 |
2.989.902,01 |
|
|
Turnover |
7.153.198,60 |
2.222.197,42 |
2.989.902,01 |
|
|
Other operating
income |
|
1.075,35 |
|
|
|
B.I. OPERATING
LOSSES (A.1+A.2+A.3+A.4+A.5-B.1) |
52.397,15 |
214.827,82 |
387.760,81 |
|
|
B.2. Financial
Income |
406,75 |
21.724,09 |
2.287,22 |
|
|
In affiliated
companies |
171,27 |
5.308,11 |
|
|
|
Other |
235,48 |
16.415,98 |
2.287,22 |
|
|
B.3. Gains on
exchange |
23.074,50 |
|
19,89 |
|
|
B.II. FINANCIAL
LOSSES (A.6+A.7+A.8-B.2-B.3) |
44.142,67 |
16.492,77 |
37.871,01 |
|
|
B.III. LOSSES
FROM ORDINARY ACTIVITIES (B.I+B.II-A.I-A.II) |
96.539,82 |
231.320,59 |
425.631,82 |
|
|
B.4. Gains from
disposal of fixed assets |
|
|
|
|
|
B.5. Gains from
dealing in own shares |
|
|
|
|
|
B.6. Paid in
surplus |
|
|
|
|
|
B.7.
Extraordinary income |
1.083,78 |
5.350,83 |
844,73 |
|
|
B.8. Prior year’s
income and profits |
|
|
|
|
|
B.IV.
EXTRAORDINARY LOSSES (A.9+A.10+A.11+A.12+A.13-B.4-B.5-B.6-B.7-B.8) |
|
1.152,50 |
40,72 |
|
|
B.V. LOSS BEFORE
TAXES (B.III+B.IV-A.III-A.IV) |
96.504,55 |
232.473,09 |
425.672,54 |
|
|
B.VI. NET LOSS
(B.V+A.14+A.15) |
101.613,55 |
232.473,09 |
425.672,54 |
Main Ratios
|
(Figures given in
Euros) |
2.003 (12)
|
2.004 (12)
|
2.005 (12)
|
|
|
|
ACTIVITY |
|
|
|
|
|
Increase of the
Sales Figures |
-0,17 |
-68,93 |
34,55 |
|
|
Assets Turnover |
2,95 |
0,64 |
0,93 |
|
|
Productivity |
1,01 |
0,57 |
0,32 |
|
|
Increase of the
Added Value |
-24,64 |
-81,97 |
-25,17 |
|
|
PROFITABILITY |
|
|
|
|
|
Economic
Profitability |
-4,19 |
-6,74 |
-13,18 |
|
|
Financial
Profitability |
-5,01 |
-12,94 |
-31,06 |
|
|
Financial
Expenses |
0,58 |
1,72 |
1,33 |
|
|
BALANCE (IN DAYS
OF SALES) |
|
|
|
|
|
Customers’ Credit
(In days of sales) |
49,00 |
147,00 |
141,00 |
|
|
Suppliers’ Credit
(In days of sales) |
10,00 |
23,00 |
|
|
|
Working Capital
(In days of sales) |
102,00 |
255,00 |
139,00 |
|
|
Working Capital
Requirement (In days of sales) |
31,00 |
45,00 |
92,00 |
|
|
Treasury (In days
of sales) |
70,00 |
210,00 |
47,00 |
|
|
BALANCE |
|
|
|
|
|
Working Capital |
2.017.776,17 |
1.571.816,92 |
1.151.695,69 |
|
|
Working Capital
Requirement |
621.980,67 |
275.908,74 |
764.427,77 |
|
|
Treasury |
1.395.795,50 |
1.295.908,18 |
387.267,92 |
|
|
Balance Ratio |
191,12 |
8,01 |
6,27 |
|
|
SOLVENCY |
|
|
|
|
|
Borrowing Ratio |
16,39 |
47,93 |
57,57 |
|
|
Own / Permanent
Funds |
100,00 |
100,00 |
100,00 |
|
|
Payback Capacity |
0,06 |
0,72 |
0,61 |
|
|
LIQUIDITY |
|
|
|
|
|
General Liquidity |
6,08 |
1,95 |
1,62 |
|
|
Immediate
Liquidity |
3,51 |
0,78 |
0,21 |
Sectorial Analysis
Summary of Assets, Liability
& Equity
|
(Figures given in
Percentages) |
Company |
Sector |
Company |
|
|
2.005 |
|
|
|
Assets |
|||
|
DUE
FROM SHAREHOLDERS FOR UNCALLED CAPITAL |
0,00 |
0,02 |
-0,02 |
|
FIXED
ASSETS |
6,77 |
21,76 |
-14,99 |
|
ACCRUED
EXPENSES |
0,00 |
0,39 |
-0,39 |
|
CURRENT
ASSETS |
93,23 |
77,82 |
15,41 |
|
TOTAL
ASSETS |
100,00 |
100,00 |
0,00 |
|
Liabilities |
|||
|
SHAREHOLDERS
EQUITY |
42,43 |
36,34 |
6,09 |
|
ACCRUED
INCOME |
0,00 |
0,11 |
-0,11 |
|
RISK
AND EXPENDITURE COVER |
0,00 |
0,14 |
-0,14 |
|
LONG-TERM
CREDITORS |
0,00 |
8,05 |
-8,05 |
|
SHORT-TERM
CREDITORS |
57,57 |
55,30 |
2,27 |
|
SHORT-TERM
RISK AND EXPENDITURE COVER |
0,00 |
0,05 |
-0,05 |
|
TOTAL
LIABILITIES |
100,00 |
100,00 |
0,00 |
Analytical Account of Results
|
(Figures given in
Percentages) |
Company |
Sector |
Company |
|
|
2.005 |
|
|
|
Net
turnover |
100,00 |
98,86 |
1,14 |
|
Other
operating income |
0,00 |
1,14 |
-1,14 |
|
Production
Value |
100,00 |
100,00 |
0,00 |
|
Operating
expenses |
58,86 |
72,58 |
-13,72 |
|
Other
operation expenses |
36,23 |
11,05 |
25,18 |
|
Added
value |
4,91 |
16,37 |
-11,46 |
|
Labor
cost |
15,49 |
10,26 |
5,22 |
|
Gross
Economic Result |
-10,58 |
6,11 |
-16,68 |
|
Assets
depreciation |
1,84 |
1,20 |
0,63 |
|
Variation
in provision for current assets |
0,56 |
0,27 |
0,28 |
|
Net
Economic Result |
-12,97 |
4,63 |
-17,60 |
|
Financial
income |
0,08 |
0,55 |
-0,47 |
|
Financial
expenses |
1,34 |
1,44 |
-0,10 |
|
Variation
in financial investment provision |
0,00 |
0,00 |
-0,00 |
|
Ordinary
Activities Result |
-14,24 |
3,73 |
-17,97 |
|
Extraordinary
income |
0,03 |
0,32 |
-0,29 |
|
Extraordinary
expenses |
0,03 |
0,19 |
-0,16 |
|
Variation
in provision in fixed assets |
0,00 |
-0,00 |
0,00 |
|
Results
before Taxes |
-14,24 |
3,87 |
-18,10 |
|
Corporaye
taxes |
0,00 |
1,17 |
-1,17 |
|
Net
Result |
-14,24 |
2,69 |
-16,93 |
|
Assets
depreciation |
1,84 |
1,20 |
0,63 |
|
Provisions
fund variation |
0,56 |
0,28 |
0,28 |
|
Net
Self-Financing |
-11,84 |
4,17 |
-16,02 |
Ratios
|
(Figures given in
) |
Company |
Ptile25
|
Medium
|
Ptile75
|
|
|
2.005 |
|
|
|
|
ACTIVITY |
|
|
|
|
|
Increase
of the Sales Figures |
34,55 |
-6,12 |
3,81 |
13,57 |
|
Assets
Turnover |
0,93 |
1,31 |
1,78 |
2,37 |
|
Fixed
Assets Turnover |
13,68 |
5,70 |
12,54 |
32,35 |
|
Increase
of the Added Value |
-25,17 |
-6,19 |
4,59 |
16,21 |
|
PRODUCTIVITY |
|
|
|
|
|
Productivity |
0,32 |
1,32 |
1,56 |
2,05 |
|
Change
of Personnel Costs |
33,75 |
1,58 |
9,18 |
18,86 |
|
Average
Personnel Costs |
35.615,84 |
18.053,72 |
23.520,82 |
31.450,00 |
|
Value
Added by Employees |
11.292,40 |
28.000,10 |
38.672,06 |
58.371,37 |
|
CASH FLOW |
|
|
|
|
|
Cash
Flow |
-354.116,48 |
66.552,81 |
123.964,12 |
216.216,45 |
|
Operating
Cash Flow |
-316.204,75 |
105.033,88 |
193.014,24 |
322.733,08 |
|
Change
in Cash Flow |
-111,23 |
-23,99 |
0,12 |
24,28 |
|
PROFITABILITY |
|
|
|
|
|
Economic
Profitability |
-13,18 |
1,42 |
3,12 |
6,27 |
|
Financial
Profitability |
-31,06 |
5,66 |
11,27 |
19,12 |
|
Financial
Expenses |
1,33 |
0,37 |
0,93 |
1,78 |
|
Gross
Economic Profitability |
-9,79 |
5,32 |
8,97 |
13,68 |
|
Gross
Financial Profitability |
-23,08 |
17,79 |
30,41 |
48,63 |
|
BALANCE (IN DAYS
OF SALES) |
|
|
|
|
|
Customers’
Credit (In days of sales) |
140,00 |
44,99 |
80,54 |
114,48 |
|
Suppliers’
Credit (In days of sales) |
|
0,00 |
0,00 |
0,00 |
|
Working
Capital (In days of sales) |
138,00 |
16,02 |
36,70 |
75,15 |
|
Working
Capital Requirement (In days of sales) |
92,00 |
-4,48 |
18,23 |
50,38 |
|
Treasury
(In days of sales) |
46,00 |
4,79 |
15,84 |
34,84 |
|
Operating
Current Assets |
362,00 |
121,50 |
163,60 |
215,88 |
|
BALANCE |
|
|
|
|
|
Working
Capital |
1.151.695,69 |
162.491,10 |
403.449,51 |
804.100,16 |
|
Working
Capital Requirement |
764.427,77 |
-46.803,27 |
184.589,29 |
543.741,63 |
|
Treasury |
387.267,92 |
50.250,00 |
163.715,65 |
379.357,16 |
|
Balance
Ratio |
6,27 |
1,38 |
2,44 |
5,29 |
|
SOLVENCY |
|
|
|
|
|
Borrowing
Ratio |
57,57 |
52,99 |
69,15 |
80,92 |
|
Own
/ Permanent Funds |
100,00 |
72,44 |
92,64 |
100,00 |
|
Payback
Capacity |
0,61 |
0,24 |
0,35 |
0,49 |
|
Long
term Indebtedness |
|
0,00 |
2,26 |
10,69 |
|
Gearing |
235,69 |
212,72 |
324,18 |
524,08 |
|
Financing
Basic Ratio |
1,00 |
1,00 |
1,00 |
1,00 |
|
Assets
Guarantee |
1,74 |
1,20 |
1,40 |
1,86 |
|
LIQUIDITY |
|
|
|
|
|
General
Liquidity |
1,62 |
1,12 |
1,31 |
1,72 |
|
Immediate
Liquidity |
0,21 |
0,06 |
0,15 |
0,39 |
The date when this report was last updated
is 28/11/2006.
This company was last displayed
on 29/11/2006,
it has been viewed 11 times
in the last quarter and 140 times in total .
RATING EXPLANATIONS
|
RATING |
STATUS |
PROPOSED CREDIT LINE |
|
|
>86 |
Aaa |
Possesses an extremely sound financial
base with the strongest capability for timely payment of interest and
principal sums |
Unlimited |
|
71-85 |
Aa |
Possesses adequate working capital. No
caution needed for credit transaction. It has above average (strong)
capability for payment of interest and principal sums |
Large |
|
56-70 |
A |
Financial & operational base are
regarded healthy. General unfavourable factors will not cause fatal effect.
Satisfactory capability for payment of interest and principal sums |
Fairly Large |
|
41-55 |
Ba |
Overall operation is considered normal.
Capable to meet normal commitments. |
Satisfactory |
|
26-40 |
B |
Unfavourable & favourable factors
carry similar weight in credit consideration. Capability to overcome
financial difficulties seems comparatively below average/normal. |
Small |
|
11-25 |
Ca |
Adverse factors are apparent. Repayment of
interest and principal sums in default or expected to be in default upon
maturity |
Limited with full security |
|
<10 |
C |
Absolute credit risk exists. Caution
needed to be exercised |
Credit not recommended |
|
NR |
In view of the lack of information, we
have no basis upon which to recommend credit dealings |
No Rating |
|