MIRA
INFORM REPORT
|
Report Date : |
10.04.2007 |
IDENTIFICATION
DETAILS
|
Name : |
FIGUERAS CONTRACTOR SL |
|
|
|
|
Registered Office : |
Calle Industria - Pg Ind Can Castell, 103, 08420
Canovelles (Barcelona) |
|
|
|
|
Country : |
Spain |
|
|
|
|
Financials (as on) : |
31.12.2005 |
|
|
|
|
Date of Incorporation : |
01/04/1993 |
|
|
|
|
Legal Form : |
Limited Liability Company |
|
|
|
|
Line of Business : |
Manufacture of chairs and seats |
RATING &
COMMENTS
|
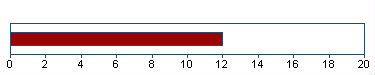
MIRA’s Rating : |
Ba |
|
RATING |
STATUS |
PROPOSED CREDIT LINE |
|
|
41-55 |
Ba |
Overall operation is considered normal. Capable to meet normal
commitments. |
Satisfactory |
|
Status : |
Satisfactory |
|
|
|
|
Payment Behaviour : |
Regular |
|
|
|
|
Litigation : |
Clear |
Identification and
Characteristics
|
Tax Number |
B60345170 |
|
NAME |
FIGUERAS CONTRACTOR SL |
|
TRADE NAME |
FIGUERAS CONTRACTOR |
|
BUSINESS
ADDRESS |
CALLE INDUSTRIA - PG IND CAN
CASTELL, 103 |
|
Postcode |
08420 CANOVELLES (BARCELONA) |
|
FORMER
ADDRESS |
CALLE PARETS A BIGUES, 7 |
|
Postcode |
08186 LLICA D AMUNT
(BARCELONA) |
|
URL |
http://www.figueras.com |
|
TELEPHONE |
938402529 |
|
FAX |
938443397 |
|
LEGAL FORM |
LIMITED LIABILITY COMPANY |
|
DATE FOUNDED |
01/04/1993 |
|
CAPITAL |
3.010,00 Euros |
|
NUMBER OF
EMPLOYEES |
17 |
|
ACTIVITY |
1496100 - Mfg. of chairs |
|
CNAE |
3611 - Manufacture of chairs and
seats |
|
EXPORT COMPANY |
YES |
|
IMPORT COMPANY |
YES |
Synthesis
|
FINANCIAL SITUATION (Year
ending: 31/12/2005) |
||
|
|
|
|
|
PROFITABILITY |
|
Nil |
|
TREASURY |
|
Average |
|
BALANCE SHEET |
|
Excellent |
|
DEBT |
|
Heavy |
|
INCIDENTS |
||
|
|
|
|
|
COMMITMENTS |
|
Respected |
|
INCIDENTS |
|
None or Negligible |
|
PREVIOUS EXPERIENCE |
||
|
|
|
|
|
PREVIOUS
EXPERIENCE |
|
Normal |
Credit Appraisal
|
CREDIT ACCORDING TO OBJECTIVE DATA (From 0
to 6.000.000,00 Euros): |
|
FAVOURABLE TOWARDS 100.369,02
Max. Euros |
|
SOLVENCY RATING: |
|
(BASED ON HOMOGENEOUS FORMULATION) |
|
|
|
Analysis made on 30/03/2007 |
Financial Elements
Figures given in
Euros
|
|
Balance
sheet 2.003 (12) |
Balance
sheet 2.004 (12) |
Balance
sheet 2.005 (12) |
%
Sales |
|
SALES |
11.049.470,00 |
9.966.724,00 |
9.155.698,00 |
|
|
ADDED VALUE |
900.030,00 |
694.896,00 |
674.943,00 |
7,37 |
|
BUSINESS RESULT |
16.517,00 |
10.818,00 |
18.975,00 |
0,21 |
|
OWN FUNDS |
99.556,00 |
110.374,00 |
129.349,00 |
|
|
DEBT |
7.984.756,00 |
9.901.997,00 |
8.950.395,00 |
|
|
TOTAL ASSET |
8.084.716,00 |
10.015.382,00 |
9.094.292,00 |
|
|
The sales of 9.155.698,00
Euros show a change of -8,14% compared with
2.004 . Between 2.003 and 2.004 , this
change was -9,80% . |
||||
|
Added value grew by -2,87%
compared with the previous year. Shareholders equity are 129.349,00
Euros for an indebtedness of 8.950.395,00 Euros
. |
||||
|
The result 18.975,00
Euros means financial profitability of 14,67% and
economic profitability of 0,21% . This result means growth of
75,40% compared with the 2.004 . |
||||
|
|
||||
|
THE FIGURES FOR THE LAST BALANCE SHEET ARE
RELEVANT: |
||||
|
SOURCE: FROM THE MERCANTILE REGISTER |
||||
|
DATE: 13/10/2006 |
||||
|
|
||||
|
Auditors’ opinion: |
||||
|
FAVOURABLE (2.005) |
||||
|
|
||||
|
Auditors: |
||||
|
DELOITTE SL |
||||
Comparative Sector
Analysis
|
|
Company |
Sector |
Difference |
|
|
(2.005)
|
|
|
|
% of PRODUCTION VALUE |
|
|
|
|
SALES |
100,00 |
99,16 |
0,84 |
|
ADDED
VALUE |
7,37 |
29,70 |
-22,33 |
|
BUSINESS
RESULT |
0,21 |
4,38 |
-4,17 |
|
% OF TOTAL ASSETS |
|
|
|
|
OWN
FUNDS |
1,42 |
51,78 |
-50,36 |
|
DEBT |
98,42 |
48,22 |
50,20 |
Compared sector (CNAE): 361 - Fabricación
de muebles
Number of companies: 112
Size (Sales Figure): 7.000.000,00 -
40.000.000,00 Euros
The turnover of the company is 0,84%
above the mean for the sector.
The company’s added value was 7,37% s/
the production value, and 22,33% below the mean for the sector.
The company’s business result was
0,21% of the PV, 4,17% below the mean for the sector.
The company’s own resources are 1,42%
, 50,36% below the mean for the sector.
The company’s outside resources are
98,42% , 50,20% above the mean for the sector.
Legal Actions
No legal
incidences registered for this company in the official source
No claims
registered for this company in the official sources
AFFECTED BY:
No significant elemento
Main Board members,
Directors and
Auditor
|
Position |
Surname and name |
Date of
appointment |
|
SOLE ADMINISTRATOR |
ALCOBE OLLE LUIS |
28/09/2006 |
|
AUDITOR |
DELOITIE TOUCHE ESPANA SL |
11/02/2005 |
Financial Links
|
Shareholders |
||||
|
Company Name |
CIF/Country |
|
Source |
Information Date |
|
FIGUERAS INTERNATIONAL SEATING SA |
A08178238 |
100,00% |
OWN SOURCES |
05/07/2006 |
Proceedings published
in the B.O.R.M.E.
(Official Mercantile Register
Gazette)
|
Proceedings |
Date |
Notice Num. |
Mercantile Reg. |
|
Appointments |
22/01/2007 |
035251 |
BARCELONA |
|
Registration of accounts
(2005) |
28/09/2006 |
583555 |
BARCELONA |
|
Appointments |
28/09/2006 |
470451 |
BARCELONA |
|
Resignations |
04/05/2006 |
229994 |
BARCELONA |
|
Appointments |
24/02/2006 |
103360 |
BARCELONA |
Brands, Signs and
Commercial Names
|
Prevailing Commercial
Names |
|||||
|
Name: |
FIGUERAS CONTRACTOR |
||||
|
Kind of Brand: |
DENOMINATIVE |
File: |
N211172 |
||
|
Request Date: |
26/12/1996 |
Bulletin Date: |
Bulletin Date: |
Current situation: |
APPROVED REGISTER |
|
|
|
||||
Total Marcas: 1
The information on the last account contained
in this report is extracted from the Mercantile Register file of the legal
address of the Company and dated 13/10/2006
Balance Sheet
(ASSETS)
|
(Figures given in Euros) |
31/12/2003 (12)
|
31/12/2004 (12)
|
31/12/2005 (12)
|
|
|
|
A) DUE FROM SHAREHOLDERS FOR UNCALLED
CAPITAL |
|
|
|
|
|
B) FIXED ASSETS |
25.937,00 |
33.627,00 |
34.213,00 |
|
|
I. Establishment expenses |
|
|
|
|
|
II. Intangible assets |
|
|
|
|
|
Software |
4.339,00 |
|
|
|
|
Amortization |
-4.339,00 |
|
|
|
|
III. Tangible assets |
22.331,00 |
30.021,00 |
30.607,00 |
|
|
Other property plant and equipement |
157.093,00 |
172.058,00 |
177.791,00 |
|
|
Other assets |
17.979,00 |
17.979,00 |
20.523,00 |
|
|
Depreciation |
-152.741,00 |
-160.016,00 |
-167.707,00 |
|
|
IV. Financial assets |
3.606,00 |
3.606,00 |
3.606,00 |
|
|
Long term deposits and guarantees |
3.606,00 |
3.606,00 |
3.606,00 |
|
|
V. Owners equity |
|
|
|
|
|
VI. Long term trade liabilities |
|
|
|
|
|
C) DEFERRED EXPENSES |
|
|
|
|
|
D) CURRENT ASSETS |
8.058.779,00 |
9.981.755,00 |
9.060.079,00 |
|
|
I. Not paid in shareholder capital |
|
|
|
|
|
II. Inventory |
1.139.911,00 |
1.333.777,00 |
1.060.469,00 |
|
|
Work in Progress |
1.021.039,00 |
1.267.426,00 |
1.044.682,00 |
|
|
Finished goods |
118.872,00 |
66.351,00 |
15.787,00 |
|
|
III. Debtors |
6.109.820,00 |
8.162.034,00 |
7.717.720,00 |
|
|
Clients |
704.286,00 |
715.547,00 |
659.784,00 |
|
|
Amounts owned by affiliated companies |
5.072.497,00 |
7.110.608,00 |
7.038.868,00 |
|
|
Taxes refunds |
366.641,00 |
369.483,00 |
52.672,00 |
|
|
Provisions |
-33.604,00 |
-33.604,00 |
-33.604,00 |
|
|
IV. Short term financial assets |
454,00 |
454,00 |
|
|
|
Short Term Deposit and guarantees |
454,00 |
454,00 |
|
|
|
V. Short term owners equity |
808.594,00 |
|
|
|
|
VI. Cash |
|
485.490,00 |
281.890,00 |
|
|
VII. Prepaid expenses and accrued income |
|
|
|
|
|
ASSETS (A + B + C + D) |
8.084.716,00 |
10.015.382,00 |
9.094.292,00 |
Balance Sheet
(LIABILITIES)
|
(Figures given in Euros) |
31/12/2003 (12)
|
31/12/2004 (12)
|
31/12/2005 (12)
|
|
|
|
A) SHAREHOLDERS EQUITY |
99.556,00 |
110.374,00 |
129.349,00 |
|
|
I. Capital |
3.010,00 |
3.010,00 |
3.010,00 |
|
|
II. Premium share account |
|
|
|
|
|
III. Revaluation reserve |
|
|
|
|
|
IV. Reserves |
80.029,00 |
96.546,00 |
107.364,00 |
|
|
Retained earnings |
601,00 |
601,00 |
601,00 |
|
|
Other funds |
79.428,00 |
95.945,00 |
106.763,00 |
|
|
V. Prior year earnings |
|
|
|
|
|
VI. Prior year profit or losses |
16.517,00 |
10.818,00 |
18.975,00 |
|
|
VII. Dividend paid during the year |
|
|
|
|
|
VIII. Own shares for change in capital |
|
|
|
|
|
B) DEFERRED INCOME |
404,00 |
3.011,00 |
14.548,00 |
|
|
Rate difference |
404,00 |
3.011,00 |
14.548,00 |
|
|
C) PROVISIONS FOR LIABILITIES AND EXPENSES |
|
|
|
|
|
D) LONG TERM LIABILITIES |
|
|
|
|
|
I. Bonds |
|
|
|
|
|
II. Bank loans |
|
|
|
|
|
III. Debts with associed and affiliated
companies |
|
|
|
|
|
IV. Other creditors |
|
|
|
|
|
V. Deferred debts on shares |
|
|
|
|
|
VI. Long term debt with creditor |
|
|
|
|
|
E) SHORT TERM LIABILITIES |
7.984.756,00 |
9.901.997,00 |
8.950.395,00 |
|
|
I. Negotiable bonds |
|
|
|
|
|
II. Bank loans |
|
|
|
|
|
III. Short term debts with associated and
affiliated companies |
6.593.977,00 |
8.677.008,00 |
7.370.178,00 |
|
|
With affiliated companies |
6.593.977,00 |
8.677.008,00 |
7.370.178,00 |
|
|
IV. Trade creditors |
1.313.136,00 |
1.149.817,00 |
1.506.452,00 |
|
|
Expenses |
1.313.136,00 |
1.149.817,00 |
1.506.452,00 |
|
|
V. Other non trade payables |
77.643,00 |
75.172,00 |
73.765,00 |
|
|
Government |
30.101,00 |
33.584,00 |
32.533,00 |
|
|
Accounts receivable |
47.542,00 |
41.588,00 |
41.232,00 |
|
|
VI. Provisions for current assets |
|
|
|
|
|
VII. Accruals and deferred incomes |
|
|
|
|
|
F) SHORT TERM PROVISIONS FOR LIABILITIES
AND EXPENSES |
|
|
|
|
|
LIABILITIES (A + B + C + D + E + F) |
8.084.716,00 |
10.015.382,00 |
9.094.292,00 |
Profit and Loss
Account
|
(Figures given in Euros) |
31/12/2003 (12)
|
31/12/2004 (12)
|
31/12/2005 (12)
|
|
|
|
A) EXPENSES (A.1 a A.16) |
|
|
|
|
|
A.1. Change in stocks of finished goods
and work in progress |
|
|
273.308,00 |
|
|
A.2. Supplies |
4.867.542,00 |
4.769.275,00 |
4.161.664,00 |
|
|
Raw materials consumed |
4.637.870,00 |
4.473.291,00 |
3.858.220,00 |
|
|
Other expenses |
229.672,00 |
295.984,00 |
303.444,00 |
|
|
A.3. Labor cost |
726.308,00 |
685.418,00 |
680.870,00 |
|
|
Wages |
584.594,00 |
559.827,00 |
546.365,00 |
|
|
Social security expenses |
141.714,00 |
125.591,00 |
134.505,00 |
|
|
A.4. Assets depreciation |
5.746,00 |
7.275,00 |
7.691,00 |
|
|
A.5 Variance in provision for current
assets |
2.733,00 |
|
|
|
|
Variance in provision for bad debts |
2.733,00 |
|
|
|
|
A.6. Other operating costs |
5.368.057,00 |
4.696.420,00 |
4.045.783,00 |
|
|
External costs |
5.366.165,00 |
4.692.070,00 |
4.044.503,00 |
|
|
Taxes |
1.892,00 |
4.350,00 |
1.280,00 |
|
|
A.I. OPERATING RESULT (B.1+B.2+B.3+B.4-A.1-A.2-A.3-A.4-A.5-A.6) |
165.243,00 |
2.203,00 |
|
|
|
A.7. Financial expenses |
22.703,00 |
2.320,00 |
79,00 |
|
|
Other companies debts |
22.703,00 |
2.320,00 |
79,00 |
|
|
A.8. Variation in financial investments
provision |
|
|
|
|
|
A.9. Exchange losses |
199.411,00 |
43.474,00 |
384,00 |
|
|
A.II. POSITIVE FINANCIAL RESULTS
(B.5+B.6+B.7+B.8-A.7-A.8-A.9) |
|
14.413,00 |
42.811,00 |
|
|
A.III. PROFIT FROM ORDINARY ACTIVITIES
(A.I+A.II-B.I-B.II) |
25.410,00 |
16.616,00 |
29.193,00 |
|
|
A.10. Variation in provision in fixed
assets |
|
|
|
|
|
A.11. Losses in fixed assets |
|
|
|
|
|
A.12. Losses from shares and bonds |
|
|
|
|
|
A.13. Extraordinary charges |
|
|
|
|
|
A.14. Prior year’s expenses and losses |
|
|
|
|
|
A.IV. POSITIVE EXTRAORDINARY RESULT
(B.9+B.10+B.11+B.12+B.13-A.10-A.11-A.12-A.13-A.14) |
|
6,00 |
|
|
|
A.V. EARNINGS / LOSS BEFORE TAXES
(A.III+A.IV-B.III-B.IV) |
25.410,00 |
16.622,00 |
29.193,00 |
|
|
A.15. Corporate Taxes |
8.893,00 |
5.804,00 |
10.218,00 |
|
|
A.16. Other taxes |
|
|
|
|
|
A.VI. YEAR END RESULT (PROFIT)
(A.V-A.15-A.16) |
16.517,00 |
10.818,00 |
18.975,00 |
|
|
B) INCOMES (B.1 a B13) |
|
|
|
|
|
B.1. Turnover |
11.049.470,00 |
9.966.724,00 |
9.155.698,00 |
|
|
Sales |
10.939.692,00 |
9.857.255,00 |
9.095.193,00 |
|
|
Services provided |
109.778,00 |
109.469,00 |
60.505,00 |
|
|
B.2. Increase in inventory of finished
goods |
86.159,00 |
193.867,00 |
|
|
|
B.3. Expenses capitalized |
|
|
|
|
|
B.4. Other operating income |
|
|
|
|
|
B.I. OPERATING LOSSES
(A.1+A.2+A.3+A.4+A.5+A.6-B.1-B.2-B.3-B.4) |
|
|
13.618,00 |
|
|
B.5. Incomes from share |
|
|
|
|
|
B.6. Income from securities |
|
|
|
|
|
B.7. Other income from interrest |
20.050,00 |
19.844,00 |
9.366,00 |
|
|
From other companies |
20.050,00 |
19.844,00 |
9.366,00 |
|
|
B.8. Gains on exchange |
62.231,00 |
40.363,00 |
33.908,00 |
|
|
B.II. FINANCIAL LOSSES (A.7+A.8+A.9-B.5-B.6-B.7-B.8) |
139.833,00 |
|
|
|
|
B.III. LOSSES FROM ORDINARY ACTIVITIES
(B.I+B.II-A.I-A.II) |
|
|
|
|
|
B.9. Gains from disposal of fixed assets |
|
|
|
|
|
B.10. Gains from dealing in own shares |
|
|
|
|
|
B.11. Paid in surplus |
|
|
|
|
|
B.12. Extraordinary income |
|
6,00 |
|
|
|
B.13. Prior year’s income and profits |
|
|
|
|
|
B.IV. EXTRAORDINARY LOSSES
(A.10+A.11+A.12+A.13+A.14-B.9-B.10-B.11-B.12-B.13) |
|
|
|
|
|
B.V. LOSS BEFORE TAXES (B.III+B.IV-A.III-A.IV) |
|
|
|
|
|
B.VI. NET LOSS (B.V+A.15+A.16) |
|
|
|
Main Ratios
|
(Figures given in Euros) |
2.003 (12) |
2.004 (12) |
2.005 (12) |
|
|
|
ACTIVITY |
|
|
|
|
|
Increase of the Sales Figures |
-7,07 |
-9,80 |
-8,14 |
|
|
Assets Turnover |
1,37 |
1,00 |
1,01 |
|
|
Productivity |
1,24 |
1,01 |
0,99 |
|
|
Increase of the Added Value |
390,31 |
-22,79 |
-2,87 |
|
|
PROFITABILITY |
|
|
|
|
|
Economic Profitability |
0,20 |
0,11 |
0,21 |
|
|
Financial Profitability |
16,59 |
9,80 |
14,67 |
|
|
Financial Expenses |
0,21 |
0,02 |
0,00 |
|
|
BALANCE (IN DAYS OF SALES) |
|
|
|
|
|
Customers’ Credit (In days of sales) |
199,00 |
295,00 |
303,00 |
|
|
Suppliers’ Credit (In days of sales) |
99,00 |
90,00 |
122,00 |
|
|
Working Capital (In days of sales) |
2,00 |
3,00 |
4,00 |
|
|
Working Capital Requirement (In days of
sales) |
2,00 |
0,00 |
0,00 |
|
|
Treasury (In days of sales) |
0,00 |
18,00 |
11,00 |
|
|
BALANCE |
|
|
|
|
|
Working Capital |
74.023,00 |
79.758,00 |
109.684,00 |
|
|
Working Capital Requirement |
73.569,00 |
-406.186,00 |
-172.206,00 |
|
|
Treasury |
454,00 |
485.944,00 |
281.890,00 |
|
|
Balance Ratio |
3,85 |
3,37 |
4,21 |
|
|
SOLVENCY |
|
|
|
|
|
Borrowing Ratio |
98,76 |
98,87 |
98,42 |
|
|
Own / Permanent Funds |
99,60 |
97,34 |
89,89 |
|
|
Payback Capacity |
0,72 |
0,99 |
0,98 |
|
|
LIQUIDITY |
|
|
|
|
|
General Liquidity |
1,01 |
1,01 |
1,01 |
|
|
Immediate Liquidity |
0,00 |
0,05 |
0,03 |
Sectorial Analysis
Summary of Assets, Liability & Equity
|
(Figures given in Percentages) |
Company |
Sector |
Company |
|
|
2.005 |
|
|
|
Assets |
|||
|
DUE FROM SHAREHOLDERS
FOR UNCALLED CAPITAL |
0,00 |
0,00 |
0,00 |
|
FIXED ASSETS |
0,38 |
35,03 |
-34,65 |
|
ACCRUED EXPENSES |
0,00 |
0,16 |
-0,16 |
|
CURRENT ASSETS |
99,62 |
64,81 |
34,81 |
|
TOTAL ASSETS |
100,00 |
100,00 |
0,00 |
|
Liabilities |
|||
|
SHAREHOLDERS EQUITY |
1,42 |
51,78 |
-50,36 |
|
ACCRUED INCOME |
0,16 |
1,07 |
-0,91 |
|
RISK AND EXPENDITURE
COVER |
0,00 |
0,12 |
-0,12 |
|
LONG-TERM CREDITORS |
0,00 |
8,34 |
-8,34 |
|
SHORT-TERM CREDITORS |
98,42 |
38,69 |
59,73 |
|
SHORT-TERM RISK AND
EXPENDITURE COVER |
0,00 |
0,01 |
-0,01 |
|
TOTAL LIABILITIES |
100,00 |
100,00 |
0,00 |
Analytical Account of
Results
|
(Figures given in Percentages) |
Company |
Sector |
Company |
|
|
2.005 |
|
|
|
Net turnover |
100,00 |
99,16 |
0,84 |
|
Other operating income |
0,00 |
0,84 |
-0,84 |
|
Production Value |
100,00 |
100,00 |
0,00 |
|
Operating expenses |
48,44 |
52,61 |
-4,17 |
|
Other operation expenses |
44,19 |
17,69 |
26,50 |
|
Added value |
7,37 |
29,70 |
-22,33 |
|
Labor cost |
7,44 |
19,49 |
-12,06 |
|
Gross Economic Result |
-0,06 |
10,21 |
-10,27 |
|
Assets depreciation |
0,08 |
3,26 |
-3,17 |
|
Variation in provision
for current assets |
0,00 |
0,27 |
-0,27 |
|
Net Economic Result |
-0,15 |
6,68 |
-6,83 |
|
Financial income |
0,47 |
0,75 |
-0,27 |
|
Financial expenses |
0,01 |
1,60 |
-1,59 |
|
Variation in financial investment
provision |
0,00 |
-0,19 |
0,19 |
|
Ordinary Activities
Result |
0,32 |
6,01 |
-5,69 |
|
Extraordinary income |
0,00 |
0,63 |
-0,63 |
|
Extraordinary expenses |
0,00 |
0,19 |
-0,19 |
|
Variation in provision
in fixed assets |
0,00 |
0,17 |
-0,17 |
|
Results before Taxes |
0,32 |
6,28 |
-5,96 |
|
Corporaye taxes |
0,11 |
1,90 |
-1,78 |
|
Net Result |
0,21 |
4,38 |
-4,18 |
|
Assets depreciation |
0,08 |
3,26 |
-3,17 |
|
Provisions fund
variation |
0,00 |
0,26 |
-0,26 |
|
Net Self-Financing |
0,29 |
7,90 |
-7,61 |
Ratios
|
(Figures given in ) |
Company |
Ptile25 |
Medium |
Ptile75 |
|
|
2.005 |
|
|
|
|
ACTIVITY |
|
|
|
|
|
Increase of the Sales
Figures |
-8,14 |
-2,32 |
4,17 |
13,39 |
|
Assets Turnover |
1,01 |
1,15 |
1,42 |
1,73 |
|
Fixed Assets Turnover |
267,61 |
2,81 |
4,56 |
6,74 |
|
Increase of the Added
Value |
-2,87 |
-2,79 |
6,43 |
15,47 |
|
PRODUCTIVITY |
|
|
|
|
|
Productivity |
0,99 |
1,32 |
1,50 |
1,89 |
|
Change of Personnel
Costs |
-0,66 |
2,89 |
8,38 |
16,11 |
|
Average Personnel Costs |
40.051,18 |
18.863,72 |
24.221,17 |
30.254,59 |
|
Value Added by Employees |
39.702,53 |
30.047,47 |
36.491,09 |
46.550,05 |
|
CASH FLOW |
|
|
|
|
|
Cash Flow |
26.666,00 |
486.310,67 |
755.179,26 |
1.385.207,41 |
|
Operating Cash Flow |
-5.927,00 |
658.542,15 |
1.019.400,36 |
1.687.627,31 |
|
Change in Cash Flow |
47,38 |
-27,06 |
2,73 |
22,52 |
|
PROFITABILITY |
|
|
|
|
|
Economic Profitability |
0,21 |
2,44 |
4,75 |
10,01 |
|
Financial Profitability |
14,67 |
5,00 |
11,83 |
19,79 |
|
Financial Expenses |
0,00 |
0,66 |
1,19 |
1,92 |
|
Gross Economic
Profitability |
-0,06 |
8,51 |
13,91 |
19,27 |
|
Gross Financial
Profitability |
-4,58 |
19,87 |
28,45 |
43,96 |
|
BALANCE (IN DAYS OF SALES) |
|
|
|
|
|
Customers’ Credit (In
days of sales) |
303,00 |
65,84 |
89,04 |
110,65 |
|
Suppliers’ Credit (In days
of sales) |
122,00 |
77,22 |
99,94 |
127,84 |
|
Working Capital (In days
of sales) |
4,00 |
18,29 |
50,35 |
92,32 |
|
Working Capital
Requirement (In days of sales) |
0,00 |
25,47 |
51,25 |
91,16 |
|
Treasury (In days of
sales) |
11,00 |
-37,79 |
3,24 |
30,56 |
|
Operating Current Assets |
356,00 |
131,31 |
169,16 |
210,63 |
|
BALANCE |
|
|
|
|
|
Working Capital |
109.684,00 |
480.088,43 |
1.338.542,41 |
3.718.966,34 |
|
Working Capital
Requirement |
-172.206,00 |
774.547,87 |
1.765.849,37 |
2.895.805,22 |
|
Treasury |
281.890,00 |
-1.098.440,61 |
69.626,38 |
1.015.090,95 |
|
Balance Ratio |
4,21 |
1,18 |
1,57 |
2,44 |
|
SOLVENCY |
|
|
|
|
|
Borrowing Ratio |
98,42 |
39,41 |
51,04 |
64,78 |
|
Own / Permanent Funds |
89,89 |
77,40 |
90,43 |
98,04 |
|
Payback Capacity |
0,98 |
0,23 |
0,34 |
0,43 |
|
Long term Indebtedness |
|
0,95 |
5,69 |
11,59 |
|
Gearing |
7.030,82 |
165,06 |
204,30 |
283,93 |
|
Financing Basic Ratio |
1,00 |
1,00 |
1,00 |
1,02 |
|
Assets Guarantee |
1,02 |
1,50 |
1,90 |
2,53 |
|
LIQUIDITY |
|
|
|
|
|
General Liquidity |
1,01 |
1,15 |
1,45 |
2,12 |
|
Immediate Liquidity |
0,03 |
0,07 |
0,20 |
0,55 |
RATING
EXPLANATIONS
|
RATING |
STATUS |
PROPOSED CREDIT LINE |
|
|
>86 |
Aaa |
Possesses an extremely sound financial base with the strongest
capability for timely payment of interest and principal sums |
Unlimited |
|
71-85 |
Aa |
Possesses adequate working capital. No caution needed for credit
transaction. It has above average (strong) capability for payment of interest
and principal sums |
Large |
|
56-70 |
A |
Financial & operational base are regarded healthy. General
unfavourable factors will not cause fatal effect. Satisfactory capability for
payment of interest and principal sums |
Fairly Large |
|
41-55 |
Ba |
Overall operation is considered normal. Capable to meet normal
commitments. |
Satisfactory |
|
26-40 |
B |
Unfavourable & favourable factors carry similar weight in credit
consideration. Capability to overcome financial difficulties seems
comparatively below average/normal. |
Small |
|
11-25 |
Ca |
Adverse factors are apparent. Repayment of interest and principal sums
in default or expected to be in default upon maturity |
Limited with
full security |
|
<10 |
C |
Absolute credit risk exists. Caution needed to be exercised |
Credit not
recommended |
|
NR |
In view of the lack of information, we have no basis upon which to
recommend credit dealings |
No Rating |
|
This score serves as a reference to assess SC’s credit risk
and to set the amount of credit to be extended. It is calculated from a
composite of weighted scores obtained from each of the major sections of this
report. The assessed factors and their relative weights (as indicated through
%) are as follows:
Financial
condition (40%) Ownership
background (20%) Payment
record (10%)
Credit history
(10%) Market trend
(10%) Operational
size (10%)