
MIRA
INFORM REPORT
|
Report Date : |
10.04.2007 |
IDENTIFICATION
DETAILS
|
Name : |
NAVIMA CALZADOS SOCIEDAD LIMITADA |
|
|
|
|
Registered Office : |
Calle San Fernando, 11, 46960 Aldaia (Valencia) |
|
|
|
|
Country : |
Spain |
|
|
|
|
Financials (as on) : |
31.12.2003 |
|
|
|
|
Date of Incorporation : |
25/06/1998 |
|
|
|
|
Legal Form : |
Limited Liability Company |
|
|
|
|
Line of Business : |
Manufacture of footwear |
RATING &
COMMENTS
|
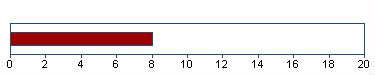
MIRA’s Rating : |
Ba |
|
RATING |
STATUS |
PROPOSED CREDIT LINE |
|
|
41-55 |
Ba |
Overall operation is considered normal. Capable to meet normal
commitments. |
Satisfactory |
|
Status : |
Satisfactory |
|
|
|
|
Payment Behaviour : |
Regular |
|
|
|
|
Litigation : |
Clear |
Identification and
Characteristics
|
Tax Number |
B96779012 |
|
NAME |
NAVIMA CALZADOS SOCIEDAD LIMITADA. |
|
BUSINESS
ADDRESS |
CALLE SAN FERNANDO, 11 |
|
Postcode |
46960 ALDAIA (VALENCIA) |
|
TELEPHONE |
961509662 |
|
FAX |
961503182 |
|
LEGAL FORM |
LIMITED LIABILITY COMPANY |
|
DATE FOUNDED |
25/06/1998 |
|
CAPITAL |
6.010,00 Euros |
|
NUMBER OF
EMPLOYEES |
25 |
|
ACTIVITY |
1451000 - Mfg. of footwear (mass
production) |
|
CNAE |
1930 - Manufacture of footwear |
|
EXPORT COMPANY |
YES |
|
IMPORT COMPANY |
YES |
Synthesis
|
INCIDENTS |
||
|
|
|
|
|
COMMITMENTS |
|
Respected |
|
INCIDENTS |
|
None or Negligible |
|
PREVIOUS EXPERIENCE |
||
|
|
|
|
|
PREVIOUS
EXPERIENCE |
|
Unfavourable |
Credit Appraisal
|
CREDIT ACCORDING TO OBJECTIVE DATA (From 0
to 6.000.000,00 Euros): |
|
FAVOURABLE TOWARDS 1.202,02
Max. Euros |
|
SOLVENCY RATING: |
|
(BASED ON HOMOGENEOUS FORMULATION) |
|
|
|
Analysis made on 17/03/2007 |
Financial Elements
Figures given in
Euros
|
|
Balance
sheet 2.001 (12) |
Balance
sheet 2.002 (12) |
Balance
sheet 2.003 (12) |
%
Sales |
|
SALES |
4.439.152,26 |
5.102.901,91 |
6.281.142,97 |
|
|
ADDED VALUE |
698.127,41 |
828.666,72 |
1.326.653,22 |
21,12 |
|
BUSINESS RESULT |
138.541,37 |
233.144,20 |
208.580,43 |
3,32 |
|
OWN FUNDS |
237.838,72 |
470.983,14 |
679.563,57 |
|
|
DEBT |
2.565.056,74 |
2.515.364,16 |
2.857.898,33 |
|
|
TOTAL ASSET |
2.802.895,46 |
2.986.347,30 |
3.537.461,90 |
|
|
The sales of 6.281.142,97
Euros show a change of 23,09% compared with
2.002 . Between 2.001 and 2.002 , this
change was 14,95% . |
||||
|
Added value grew by 60,09% compared
with the previous year. Shareholders equity are 679.563,57
Euros for an indebtedness of 2.857.898,33 Euros
. |
||||
|
The result 208.580,43
Euros means financial profitability of 30,69% and
economic profitability of 5,90% . This result means growth of
-10,54% compared with the 2.002 . |
||||
|
|
||||
|
THE FIGURES FOR THE LAST BALANCE SHEET ARE
RELEVANT: |
||||
|
SOURCE: FROM THE MERCANTILE REGISTER |
||||
|
DATE: 16/11/2004 |
||||
Comparative Sector
Analysis
|
|
Company |
Sector |
Difference |
|
|
(2.003)
|
|
|
|
% of PRODUCTION VALUE |
|
|
|
|
SALES |
100,00 |
99,61 |
0,39 |
|
ADDED
VALUE |
21,12 |
18,42 |
2,70 |
|
BUSINESS
RESULT |
3,32 |
1,42 |
1,90 |
|
% OF TOTAL ASSETS |
|
|
|
|
OWN
FUNDS |
19,21 |
32,09 |
-12,88 |
|
DEBT |
80,79 |
67,91 |
12,88 |
Compared sector (CNAE): 193 - Fabricación
de calzado
Number of companies: 164
Size (Sales Figure): 2.800.000,00 -
7.000.000,00 Euros
The turnover of the company is 0,39%
above the mean for the sector.
The company’s added value was 21,12%
s/ the production value, and 2,70% above the mean for the sector.
The company’s business result was
3,32% of the PV, 1,90% above the mean for the sector.
The company’s own resources are 19,21%
, 12,88% below the mean for the sector.
The company’s outside resources are
80,79% , 12,88% above the mean for the sector.
Legal Actions
No legal incidences registered for this company
in the official source
No claims registered for this company in the
official sources
AFFECTED BY: No significant elemento
Main Board members,
Directors and
Auditor
|
Position |
Surname and name |
Date of
appointment |
|
SOLE ADMINISTRATOR |
FLOR BETANZOS FRANCISCO |
16/09/1998 |
Financial Links
|
Shareholders |
||||
|
Company Name |
|
|
Source |
Information Date |
|
FLOR BETANZOS FRANCISCO |
|
Indet. |
OWN SOURCES |
31/07/2006 |
Proceedings published
in the B.O.R.M.E.
(Official Mercantile
Register Gazette)
|
Proceedings |
Date |
Notice Num. |
Mercantile Reg. |
|
Registration of accounts
(2003) |
28/10/2004 |
745595 |
VALENCIA |
|
Registration of accounts
(2002) |
25/09/2003 |
469032 |
VALENCIA |
|
Registration of accounts
(2001) |
01/10/2002 |
502718 |
VALENCIA |
|
Registration of accounts
(2000) |
13/09/2001 |
285805 |
VALENCIA |
|
Registration of accounts
(1999) |
20/09/2000 |
383972 |
VALENCIA |
Complementary
Information
|
07/03/07 BLOQUE DE INVESTIGACION: |
|
- Su actividad concreta es la fabricacion
y comercializacion de cal- |
|
zado. |
|
---------------------------------------------------------------------- |
|
El bloque de investigacion o esta sujeto a
actualizaciones sistemati- |
|
cas.Los datos mostrados fueron aportados
por las fuentes consultadas |
|
en la fecha del encabezamiento. |
Brands, Signs and
Commercial Names
|
Prevailing Brands |
|||||
|
Name: |
JORGE ALEX |
||||
|
Kind of Brand: |
JOINT |
File: |
M2578281 |
||
|
Request Date: |
30/01/2004 |
Bulletin Date: |
Bulletin Date: |
Current situation: |
APPROVED REGISTER |
|
Types: 35
|
|
||||
|
Name: |
XC XACARET |
||||
|
Kind of Brand: |
JOINT |
File: |
M2183981 |
||
|
Request Date: |
16/09/1998 |
Bulletin Date: |
Bulletin Date: |
Current situation: |
APPROVED REGISTER |
|
Types: 25
|
|
||||
Total Marcas: 2
The information on the last account
contained in this report is extracted from the Mercantile Register file of the legal
address of the Company and dated 16/11/2004
Balance Sheet
(ASSETS)
|
(Figures given in Euros) |
31/12/2001 (12)
|
31/12/2002 (12)
|
31/12/2003 (12)
|
|
|
|
A) DUE FROM SHAREHOLDERS FOR UNCALLED
CAPITAL |
|
|
|
|
|
B) FIXED ASSETS |
194.836,49 |
311.325,07 |
314.687,93 |
|
|
I. Establishment expenses |
|
|
|
|
|
II. Intangible assets |
39.405,18 |
165.617,32 |
163.236,21 |
|
|
III. Tangible assets |
155.192,98 |
145.469,42 |
151.213,39 |
|
|
IV. Financial assets |
238,33 |
238,33 |
238,33 |
|
|
V. Owners equity |
|
|
|
|
|
VI. Long term trade liabilities |
|
|
|
|
|
C) DEFERRED EXPENSES |
2.484,24 |
7.441,44 |
3.851,94 |
|
|
D) CURRENT ASSETS |
2.605.574,73 |
2.667.580,79 |
3.218.922,03 |
|
|
I. Not paid in shareholder capital |
|
|
|
|
|
II. Inventory |
1.028.813,09 |
454.088,13 |
156.228,57 |
|
|
III. Debtors |
1.542.374,34 |
1.831.219,21 |
2.495.459,64 |
|
|
IV. Short term financial assets |
|
48.000,00 |
534.752,07 |
|
|
V. Short term owners equity |
|
|
|
|
|
VI. Cash |
34.387,30 |
334.273,45 |
32.481,75 |
|
|
VII. Prepaid expenses and accrued income |
|
|
|
|
|
ASSETS (A + B + C + D) |
2.802.895,46 |
2.986.347,30 |
3.537.461,90 |
Balance Sheet (LIABILITIES)
|
(Figures given in Euros) |
31/12/2001 (12)
|
31/12/2002 (12)
|
31/12/2003 (12)
|
|
|
|
A) SHAREHOLDERS EQUITY |
237.838,72 |
470.983,14 |
679.563,57 |
|
|
I. Capital |
6.010,00 |
6.010,00 |
6.010,00 |
|
|
II. Premium share account |
|
|
|
|
|
III. Revaluation reserve |
|
|
|
|
|
IV. Reserves |
93.287,34 |
231.828,94 |
464.973,14 |
|
|
Capital adjustments in Euros |
|
0,25 |
0,25 |
|
|
Sundry reserves |
93.287,34 |
231.828,69 |
464.972,89 |
|
|
V. Prior year earnings |
|
|
|
|
|
VI. Prior year profit or losses |
138.541,37 |
233.144,20 |
208.580,43 |
|
|
VII. Dividend paid during the year |
|
|
|
|
|
VIII. Own shares for change in capital |
|
|
|
|
|
B) DEFERRED INCOME |
|
|
|
|
|
C) PROVISIONS FOR LIABILITIES AND EXPENSES |
|
|
|
|
|
D) LONG TERM LIABILITIES |
17.874,91 |
65.460,91 |
31.425,44 |
|
|
E) SHORT TERM LIABILITIES |
2.547.181,83 |
2.449.903,25 |
2.826.472,89 |
|
|
F) SHORT TERM PROVISIONS FOR LIABILITIES AND
EXPENSES |
|
|
|
|
|
LIABILITIES (A + B + C + D + E + F) |
2.802.895,46 |
2.986.347,30 |
3.537.461,90 |
Profit and Loss
Account
|
(Figures given in Euros) |
31/12/2001 (12)
|
31/12/2002 (12)
|
31/12/2003 (12)
|
|
|
|
A) EXPENSES (A.1 a A.15) |
|
|
|
|
|
A.1 Operating Expenses |
3.023.943,86 |
3.448.275,62 |
3.769.883,55 |
|
|
A.3. Labor cost |
341.573,38 |
340.187,75 |
346.940,19 |
|
|
Wages |
263.407,68 |
268.550,85 |
284.381,97 |
|
|
Social security expenses |
78.165,70 |
71.636,90 |
62.558,22 |
|
|
A.3. Assets depreciation |
34.477,74 |
50.744,52 |
61.370,59 |
|
|
A.4. Variance in provision for current
assets |
4.213,94 |
|
8.499,36 |
|
|
A.5. Other operating costs |
719.661,74 |
827.082,53 |
1.184.606,20 |
|
|
A.I. OPERATING RESULT
(B.1-A.1-A.2-A.3-A.4-A.5) |
317.862,34 |
437.734,45 |
909.843,08 |
|
|
A.6. Financial expenses |
94.529,37 |
76.742,26 |
586.108,86 |
|
|
Debts with related companies |
94.078,10 |
76.701,27 |
585.212,36 |
|
|
Other companies debts |
451,27 |
40,99 |
896,50 |
|
|
A.7. Variation in financial investments
provision |
|
|
|
|
|
A.8. Exchange losses |
16.869,79 |
8.108,91 |
|
|
|
A.II. POSITIVE FINANCIAL RESULTS
(B.2+B.3-A.6-A.7-A.8) |
|
|
|
|
|
A.III. PROFIT FROM ORDINARY ACTIVITIES
(A.I+A.II-B.I-B.II) |
215.217,05 |
358.123,23 |
324.428,20 |
|
|
A.9. Variation in provision in fixed
assets |
|
|
|
|
|
A.10. Losses in fixed assets |
|
|
|
|
|
A.11. Losses from shares and bonds |
|
|
|
|
|
A.12. Extraordinary charges |
8.465,35 |
793,27 |
273,52 |
|
|
A.13. Prior year’s expenses and losses |
|
1.337,40 |
|
|
|
A.IV. POSITIVE EXTRAORDINARY RESULT (B.4+B.5+B.6+B.7+B.8-A.9-A.10-A.11-A.12-A.13) |
|
2.812,34 |
|
|
|
A.V. EARNINGS / LOSS BEFORE TAXES
(A.III+A.IV-B.III-B.IV) |
215.116,49 |
360.935,57 |
324.302,97 |
|
|
A.14. Corporate Taxes |
74.599,20 |
119.031,44 |
112.459,82 |
|
|
A.15. Other taxes |
1.975,92 |
8.759,93 |
3.262,72 |
|
|
A.VI. YEAR END RESULT (PROFIT)
(A.V-A.14-A.15) |
138.541,37 |
233.144,20 |
208.580,43 |
|
|
B) INCOMES (B.1 a B.8) |
|
|
|
|
|
B.1. Operating income |
4.441.733,01 |
5.104.024,87 |
6.281.142,97 |
|
|
Turnover |
4.439.152,26 |
5.102.901,91 |
6.281.142,97 |
|
|
Other operating income |
2.580,75 |
1.122,96 |
|
|
|
B.I. OPERATING LOSSES
(A.1+A.2+A.3+A.4+A.5-B.1) |
|
|
|
|
|
B.2. Financial Income |
111,16 |
279,45 |
|
|
|
In affiliated companies |
111,16 |
279,45 |
|
|
|
B.3. Gains on exchange |
8.642,71 |
4.960,50 |
693,98 |
|
|
B.II. FINANCIAL LOSSES
(A.6+A.7+A.8-B.2-B.3) |
102.645,29 |
79.611,22 |
585.414,88 |
|
|
B.III. LOSSES FROM ORDINARY ACTIVITIES
(B.I+B.II-A.I-A.II) |
|
|
|
|
|
B.4. Gains from disposal of fixed assets |
|
|
|
|
|
B.5. Gains from dealing in own shares |
996,48 |
|
|
|
|
B.6. Paid in surplus |
|
|
|
|
|
B.7. Extraordinary income |
7.368,30 |
4.476,18 |
148,29 |
|
|
B.8. Prior year’s income and profits |
|
466,83 |
|
|
|
B.IV. EXTRAORDINARY LOSSES (A.9+A.10+A.11+A.12+A.13-B.4-B.5-B.6-B.7-B.8) |
100,56 |
|
125,23 |
|
|
B.V. LOSS BEFORE TAXES
(B.III+B.IV-A.III-A.IV) |
|
|
|
|
|
B.VI. NET LOSS (B.V+A.14+A.15) |
|
|
|
Main Ratios
|
(Figures given in Euros) |
2.001 (12) |
2.002 (12) |
2.003 (12) |
|
|
|
ACTIVITY |
|
|
|
|
|
Increase of the Sales Figures |
-1,56 |
14,95 |
23,09 |
|
|
Assets Turnover |
1,58 |
1,71 |
1,78 |
|
|
Productivity |
2,04 |
2,44 |
3,82 |
|
|
Increase of the Added Value |
27,73 |
18,70 |
60,10 |
|
|
PROFITABILITY |
|
|
|
|
|
Economic Profitability |
4,94 |
7,81 |
5,90 |
|
|
Financial Profitability |
58,25 |
49,50 |
30,69 |
|
|
Financial Expenses |
2,13 |
1,50 |
9,33 |
|
|
BALANCE (IN DAYS OF SALES) |
|
|
|
|
|
Customers’ Credit (In days of sales) |
125,00 |
129,00 |
143,00 |
|
|
Suppliers’ Credit (In days of sales) |
|
|
|
|
|
Working Capital (In days of sales) |
5,00 |
15,00 |
22,00 |
|
|
Working Capital Requirement (In days of
sales) |
2,00 |
0,00 |
0,00 |
|
|
Treasury (In days of sales) |
3,00 |
27,00 |
33,00 |
|
|
BALANCE |
|
|
|
|
|
Working Capital |
58.392,90 |
217.677,54 |
392.449,14 |
|
|
Working Capital Requirement |
24.005,60 |
-164.595,91 |
-174.784,68 |
|
|
Treasury |
34.387,30 |
382.273,45 |
567.233,82 |
|
|
Balance Ratio |
1,30 |
1,68 |
2,23 |
|
|
SOLVENCY |
|
|
|
|
|
Borrowing Ratio |
91,52 |
84,23 |
80,79 |
|
|
Own / Permanent Funds |
93,01 |
87,80 |
95,58 |
|
|
Payback Capacity |
0,57 |
0,49 |
0,45 |
|
|
LIQUIDITY |
|
|
|
|
|
General Liquidity |
1,02 |
1,09 |
1,14 |
|
|
Immediate Liquidity |
0,01 |
0,16 |
0,20 |
Sectorial Analysis
Summary of Assets, Liability & Equity
|
(Figures given in Percentages) |
Company |
Sector |
Company |
|
|
2.003 |
|
|
|
Assets |
|||
|
DUE FROM SHAREHOLDERS
FOR UNCALLED CAPITAL |
0,00 |
0,00 |
0,00 |
|
FIXED ASSETS |
8,90 |
19,41 |
-10,51 |
|
ACCRUED EXPENSES |
0,11 |
0,30 |
-0,19 |
|
CURRENT ASSETS |
91,00 |
80,29 |
10,71 |
|
TOTAL ASSETS |
100,00 |
100,00 |
0,00 |
|
Liabilities |
|||
|
SHAREHOLDERS EQUITY |
19,21 |
32,09 |
-12,88 |
|
ACCRUED INCOME |
0,00 |
0,48 |
-0,48 |
|
RISK AND EXPENDITURE COVER
|
0,00 |
0,04 |
-0,04 |
|
LONG-TERM CREDITORS |
0,89 |
5,42 |
-4,53 |
|
SHORT-TERM CREDITORS |
79,90 |
61,96 |
17,94 |
|
SHORT-TERM RISK AND
EXPENDITURE COVER |
0,00 |
0,00 |
0,00 |
|
TOTAL LIABILITIES |
100,00 |
100,00 |
0,00 |
Analytical Account of
Results
|
(Figures given in Percentages) |
Company |
Sector |
Company |
|
|
2.003 |
|
|
|
Net turnover |
100,00 |
99,61 |
0,39 |
|
Other operating income |
0,00 |
0,39 |
-0,39 |
|
Production Value |
100,00 |
100,00 |
0,00 |
|
Operating expenses |
60,02 |
69,72 |
-9,70 |
|
Other operation expenses |
18,86 |
11,86 |
7,00 |
|
Added value |
21,12 |
18,42 |
2,70 |
|
Labor cost |
5,52 |
13,45 |
-7,92 |
|
Gross Economic Result |
15,60 |
4,97 |
10,62 |
|
Assets depreciation |
0,98 |
1,43 |
-0,46 |
|
Variation in provision
for current assets |
0,14 |
0,31 |
-0,17 |
|
Net Economic Result |
14,49 |
3,23 |
11,25 |
|
Financial income |
0,01 |
0,28 |
-0,27 |
|
Financial expenses |
9,33 |
1,60 |
7,73 |
|
Variation in financial
investment provision |
0,00 |
-0,00 |
0,00 |
|
Ordinary Activities
Result |
5,17 |
1,92 |
3,25 |
|
Extraordinary income |
0,00 |
0,22 |
-0,22 |
|
Extraordinary expenses |
0,00 |
0,14 |
-0,13 |
|
Variation in provision
in fixed assets |
0,00 |
-0,00 |
0,00 |
|
Results before Taxes |
5,16 |
2,00 |
3,16 |
|
Corporaye taxes |
1,84 |
0,59 |
1,26 |
|
Net Result |
3,32 |
1,42 |
1,90 |
|
Assets depreciation |
0,98 |
1,43 |
-0,46 |
|
Provisions fund
variation |
0,14 |
0,30 |
-0,16 |
|
Net Self-Financing |
4,43 |
3,15 |
1,28 |
Ratios
|
(Figures given in ) |
Company |
Ptile25 |
Medium |
Ptile75 |
|
|
2.003 |
|
|
|
|
ACTIVITY |
|
|
|
|
|
Increase of the Sales
Figures |
23,09 |
-14,95 |
-5,26 |
11,51 |
|
Assets Turnover |
1,78 |
1,71 |
2,27 |
3,22 |
|
Fixed Assets Turnover |
19,72 |
8,58 |
14,74 |
25,45 |
|
Increase of the Added
Value |
60,10 |
-9,78 |
-0,86 |
8,87 |
|
PRODUCTIVITY |
|
|
|
|
|
Productivity |
3,82 |
1,22 |
1,36 |
1,68 |
|
Change of Personnel
Costs |
1,98 |
-4,64 |
2,54 |
11,09 |
|
Average Personnel Costs |
|
14.196,09 |
16.073,71 |
17.593,68 |
|
Value Added by Employees |
|
18.838,44 |
21.600,85 |
27.459,07 |
|
CASH FLOW |
|
|
|
|
|
Cash Flow |
278.450,38 |
53.519,19 |
87.368,92 |
153.473,70 |
|
Operating Cash Flow |
979.713,03 |
90.950,24 |
150.535,23 |
238.702,66 |
|
Change in Cash Flow |
-1,92 |
-33,12 |
-8,64 |
10,02 |
|
PROFITABILITY |
|
|
|
|
|
Economic Profitability |
5,90 |
1,39 |
2,37 |
4,30 |
|
Financial Profitability |
30,69 |
5,42 |
10,73 |
16,66 |
|
Financial Expenses |
9,33 |
0,47 |
1,26 |
2,03 |
|
Gross Economic
Profitability |
27,70 |
6,96 |
10,76 |
14,76 |
|
Gross Financial
Profitability |
144,17 |
25,45 |
39,80 |
60,66 |
|
BALANCE (IN DAYS OF SALES) |
|
|
|
|
|
Customers’ Credit (In
days of sales) |
143,00 |
31,23 |
58,75 |
80,85 |
|
Suppliers’ Credit (In
days of sales) |
|
0,00 |
0,00 |
0,00 |
|
Working Capital (In days
of sales) |
22,00 |
4,66 |
20,67 |
45,65 |
|
Working Capital Requirement
(In days of sales) |
0,00 |
-14,72 |
5,79 |
30,10 |
|
Treasury (In days of
sales) |
32,00 |
5,38 |
13,05 |
30,67 |
|
Operating Current Assets |
184,00 |
91,37 |
125,77 |
165,26 |
|
BALANCE |
|
|
|
|
|
Working Capital |
392.449,14 |
32.152,42 |
209.496,78 |
471.053,87 |
|
Working Capital
Requirement |
-174.784,68 |
-155.395,96 |
40.702,89 |
306.898,41 |
|
Treasury |
567.233,82 |
47.001,50 |
143.998,87 |
292.890,76 |
|
Balance Ratio |
2,23 |
1,17 |
1,91 |
3,13 |
|
SOLVENCY |
|
|
|
|
|
Borrowing Ratio |
80,79 |
56,56 |
73,33 |
83,83 |
|
Own / Permanent Funds |
95,58 |
83,87 |
97,90 |
100,00 |
|
Payback Capacity |
0,45 |
0,19 |
0,28 |
0,40 |
|
Long term Indebtedness |
0,89 |
0,00 |
0,79 |
5,53 |
|
Gearing |
520,55 |
230,19 |
374,93 |
618,50 |
|
Financing Basic Ratio |
1,00 |
1,00 |
1,00 |
1,00 |
|
Assets Guarantee |
1,24 |
1,18 |
1,34 |
1,75 |
|
LIQUIDITY |
|
|
|
|
|
General Liquidity |
1,14 |
1,05 |
1,23 |
1,48 |
|
Immediate Liquidity |
0,20 |
0,06 |
0,16 |
0,35 |
RATING
EXPLANATIONS
|
RATING |
STATUS |
PROPOSED CREDIT LINE |
|
|
>86 |
Aaa |
Possesses an extremely sound financial base with the strongest
capability for timely payment of interest and principal sums |
Unlimited |
|
71-85 |
Aa |
Possesses adequate working capital. No caution needed for credit transaction.
It has above average (strong) capability for payment of interest and
principal sums |
Large |
|
56-70 |
A |
Financial & operational base are regarded healthy. General
unfavourable factors will not cause fatal effect. Satisfactory capability for
payment of interest and principal sums |
Fairly Large |
|
41-55 |
Ba |
Overall operation is considered normal. Capable to meet normal
commitments. |
Satisfactory |
|
26-40 |
B |
Unfavourable & favourable factors carry similar weight in credit consideration.
Capability to overcome financial difficulties seems comparatively below
average/normal. |
Small |
|
11-25 |
Ca |
Adverse factors are apparent. Repayment of interest and principal sums
in default or expected to be in default upon maturity |
Limited with
full security |
|
<10 |
C |
Absolute credit risk exists. Caution needed to be exercised |
Credit not
recommended |
|
NR |
In view of the lack of information, we have no basis upon which to
recommend credit dealings |
No Rating |
|
This score serves as a reference to assess SC’s credit risk
and to set the amount of credit to be extended. It is calculated from a
composite of weighted scores obtained from each of the major sections of this
report. The assessed factors and their relative weights (as indicated through
%) are as follows:
Financial
condition (40%) Ownership
background (20%) Payment
record (10%)
Credit history
(10%) Market trend
(10%) Operational
size (10%)