
MIRA
INFORM REPORT
|
Report Date : |
4th
January, 2007 |
IDENTIFICATION
DETAILS
|
Name : |
CANALES
COMERCIALES MAS MASIA SL. |
|
|
|
|
Registered Office : |
Plaza
Merced, 3, 46001 Valencia (Valencia) |
|
|
|
|
Country : |
Spain |
|
|
|
|
Financials (as on) : |
31.12.2005 |
|
|
|
|
Date of Incorporation : |
25/01/1999 |
|
|
|
|
Legal Form : |
Limited
Liability Company |
|
|
|
|
Line of Business : |
Wholesale
on a fee or contract basis. |
RATING & COMMENTS
|
MIRA’s Rating : |
Ba |
|
RATING |
STATUS |
PROPOSED CREDIT LINE |
|
|
41-55 |
Ba |
Overall operation is considered normal.
Capable to meet normal commitments. |
Satisfactory |
|
Status : |
Satisfactory |
|
|
|
|
Payment Behaviour : |
Slow
but Correct |
|
|
|
|
Litigation : |
Clear |
Company Name
CANALES COMERCIALES MAS MASIA SL.
TAX NUMBER
B96833843
Identification and
Characteristics
Tax
Number B96833843
NAME CANALES
COMERCIALES MAS MASIA SL.
TRADE
NAME MAS-MASIA
FORMER NAME CANALES
COMERCIALES DISTRIBUCIONES PARA EL HOGAR SOCIEDAD LIMITADA.
BUSINESS
ADDRESS PLAZA
MERCED, 3
Postcode 46001
VALENCIA (VALENCIA)
FORMER
ADDRESS CALLE HONORATO
JUAN, 4
Postcode 46007
VALENCIA (VALENCIA)
URL http://www.mas-masia.com
TELEPHONE 963941100
FAX 963520633
LEGAL
FORM LIMITED
LIABILITY COMPANY
DATE
FOUNDED 25/01/1999
CAPITAL 18.030,00 Euros
NUMBER
OF EMPLOYEES 5
BANKS B
DE SABADELL.VALENCIA;
ACTIVITY 1630000 - Traders
CNAE 5110 - Wholesale
on a fee or contract basis
EXPORT
COMPANY YES
IMPORT
COMPANY YES
Synthesis
FINANCIAL SITUATION (Year
ending: 31/12/2005)
![]()
PROFITABILITY ![]() 4/9 Nil
4/9 Nil
TREASURY ![]() 6/9 Average
6/9 Average
BALANCE
SHEET ![]() 8/9 Very
good
8/9 Very
good
DEBT ![]() 4/9 Heavy
4/9 Heavy
INCIDENTS
![]()
COMMITMENTS ![]() 9/9 Respected
9/9 Respected
INCIDENTS ![]() 9/9 None
or Negligible
9/9 None
or Negligible
PREVIOUS EXPERIENCE
![]()
PREVIOUS
EXPERIENCE ![]() 7/9 Normal
7/9 Normal
Credit Appraisal
CREDIT ACCORDING TO OBJECTIVE
DATA (From 0 to 500.000,00 Euros):
FAVOURABLE
TOWARDS 5.000,42 Max.
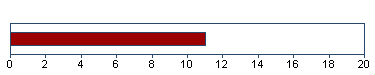
SOLVENCY RATING:
11/20 (BASED ON HOMOGENEOUS
FORMULATION)
Financial Elements
Figures given in Euros
|
|
Balance sheet 2.003 (12) |
Balance sheet 2.004 (12) |
Balance sheet 2.005 (12) |
% Sales |
|
SALES |
485.056,09 |
615.722,93 |
536.351,12 |
|
|
ADDED VALUE |
44.945,45 |
74.553,16 |
61.290,43 |
11,43 |
|
BUSINESS RESULT |
6.023,21 |
3.658,58 |
-1.597,71 |
-0,29 |
|
OWN FUNDS |
14.625,32 |
18.283,90 |
16.686,19 |
|
|
DEBT |
249.978,06 |
215.049,24 |
204.295,84 |
|
|
TOTAL ASSET |
264.603,38 |
233.333,14 |
220.982,03 |
|
The sales of 536.351,12
Euros show a change of -12,89% compared with
2.004 . Between 2.003 and 2.004 , this change
was 26,94% .
Added value grew by -17,79%
compared with the previous year. Shareholders equity are 16.686,19
Euros for an indebtedness of 204.295,84 Euros .
The result -1.597,71 Euros
means financial profitability of -9,58% and economic profitability
of -0,72% . This result means growth of -143,67%
compared with the 2.004 .
THE FIGURES FOR THE LAST BALANCE SHEET ARE
RELEVANT:
SOURCE: FROM THE MERCANTILE REGISTER
DATE: 27/12/2006
Comparative Sector Analysis
|
|
Company |
Sector |
Difference |
|
|
(2.005) |
|
|
|
% of PRODUCTION VALUE |
|
|
|
|
SALES |
99,86 |
97,18 |
2,68 |
|
ADDED
VALUE |
11,41 |
26,05 |
-14,64 |
|
BUSINESS
RESULT |
-0,30 |
3,79 |
-4,09 |
|
% OF TOTAL ASSETS |
|
|
|
|
OWN
FUNDS |
7,55 |
45,02 |
-37,47 |
|
DEBT |
92,45 |
54,98 |
37,47 |
Compared sector (CNAE): 511 - Intermediarios del comercio
Number of companies: 1.997
Size (Sales Figure): 0 - 2.800.000,00 Euros
The turnover of the company is 2,68%
above the mean for the sector.
The company’s added value was 11,41%
s/ the production value, and 14,64% below the mean for the sector.
The company’s business result was
-0,30% of the PV, 4,09% below the mean for the sector.
The company’s own resources are 7,55%
, 37,47% below the mean for the sector.
The company’s outside resources are
92,45% , 37,47% above the mean for the sector.
Legal Actions
No legal incidences registered
for this company in the official source
No claims registered for this
company in the official sources
AFFECTED BY: No significant
elemento
Main Board members, Directors and
Auditor
|
Position |
Surname and name |
Date of appointment |
|
SOLE ADMINISTRATOR |
MAS MASIA ESCUDERO FRANCISCO DAVID |
17/01/2002 |
Financial Links
|
Shareholders |
||||
|
Company Name |
|
|
Source |
Information Date |
|
MAS MASIA ESCUDERO FRANCISCO DAVID |
|
100,00% |
OWN SOURCES |
03/01/2007 |
Proceedings published in the
B.O.R.M.E. (Official Mercantile Register Gazette)
|
Proceedings |
Date |
Notice Num. |
Mercantile Reg. |
|
Registration of accounts
(2005) |
16/10/2006 |
749986 |
VALENCIA |
|
Registration of accounts
(2004) |
28/09/2005 |
576762 |
VALENCIA |
|
Registration of accounts
(2003) |
01/03/2005 |
078006 |
VALENCIA |
|
Statement of unipersonality |
11/01/2005 |
013442 |
VALENCIA |
|
Change of name |
11/01/2005 |
013442 |
VALENCIA |
Complementary Information
03/01/07 BLOQUE DE INVESTIGACION:
- Direccion social: En PZ.
Merced, 3 situado en zona urbana en Valen-
cia, ocupa establecimiento
destinado a oficina.
- Realiza operaciones
intracomunitarias de venta con Francia y Portu-
gal.
- Realiza operaciones
intracomunitarias de compra con Alemania, Fran-
cia, India y Suiza.
- Cuenta con una cartera
aproximada de 600 clientes y 10 proveedores.
- Actividad: Venta de articulos
de regalo y decoracion.
----------------------------------------------------------------------
El Bloque de Investigacion no
esta sujeto a actualizaciones sistemati-
cas. Los datos mostrados fueron
aportados por las fuentes consultadas
en la fecha del encabezamiento.
The information on the last account
contained in this report is extracted from the Mercantile Register file of the
legal address of the Company and dated 27/12/2006
Balance Sheet (ASSETS)
|
(Figures given in Euros) |
31/12/2003 (12) |
31/12/2004 (12) |
31/12/2005 (12) |
|
|
|
A) DUE FROM SHAREHOLDERS FOR UNCALLED
CAPITAL |
|
|
|
|
|
B) FIXED ASSETS |
16.335,12 |
13.574,90 |
12.899,94 |
|
|
I. Establishment expenses |
1.229,93 |
|
|
|
|
II. Intangible assets |
|
|
|
|
|
III. Tangible assets |
15.105,19 |
13.574,90 |
12.899,94 |
|
|
IV. Financial assets |
|
|
|
|
|
V. Owners equity |
|
|
|
|
|
VI. Long term trade liabilities |
|
|
|
|
|
C) DEFERRED EXPENSES |
|
|
|
|
|
D) CURRENT ASSETS |
248.268,26 |
219.758,24 |
208.082,09 |
|
|
I. Not paid in shareholder capital |
|
|
|
|
|
II. Inventory |
89.456,65 |
53.018,08 |
65.136,91 |
|
|
III. Debtors |
147.551,83 |
148.110,27 |
138.270,16 |
|
|
IV. Short term financial assets |
702,74 |
|
|
|
|
V. Short term owners equity |
|
|
|
|
|
VI. Cash |
10.557,04 |
18.629,89 |
4.675,02 |
|
|
VII. Prepaid expenses and accrued income |
|
|
|
|
|
ASSETS (A + B + C + D) |
264.603,38 |
233.333,14 |
220.982,03 |
Balance Sheet (LIABILITIES)
|
(Figures given in Euros) |
31/12/2003 (12) |
31/12/2004 (12) |
31/12/2005 (12) |
|
|
|
A) SHAREHOLDERS EQUITY |
14.625,32 |
18.283,90 |
16.686,19 |
|
|
I. Capital |
18.030,00 |
18.030,00 |
18.030,00 |
|
|
II. Premium share account |
|
|
|
|
|
III. Revaluation reserve |
|
|
|
|
|
IV. Reserves |
|
|
|
|
|
V. Prior year earnings |
-9.427,89 |
-3.404,68 |
253,90 |
|
|
VI. Prior year profit or losses |
6.023,21 |
3.658,58 |
-1.597,71 |
|
|
VII. Dividend paid during the year |
|
|
|
|
|
VIII. Own shares for change in capital |
|
|
|
|
|
B) DEFERRED INCOME |
|
|
|
|
|
C) PROVISIONS FOR LIABILITIES AND EXPENSES |
|
|
|
|
|
D) LONG TERM LIABILITIES |
|
|
|
|
|
E) SHORT TERM LIABILITIES |
249.978,06 |
215.049,24 |
204.295,84 |
|
|
F) SHORT TERM PROVISIONS FOR LIABILITIES
AND EXPENSES |
|
|
|
|
|
LIABILITIES (A + B + C + D + E + F) |
264.603,38 |
233.333,14 |
220.982,03 |
Profit and Loss Account
|
(Figures given in Euros) |
31/12/2003 (12) |
31/12/2004 (12) |
31/12/2005 (12) |
|
|
|
A) EXPENSES (A.1 a A.15) |
|
|
|
|
|
A.1 Operating Expenses |
354.507,03 |
402.508,95 |
353.388,94 |
|
|
A.3. Labor cost |
37.649,60 |
66.538,31 |
57.310,20 |
|
|
Wages |
32.092,38 |
41.264,09 |
47.427,72 |
|
|
Social security expenses |
5.557,22 |
25.274,22 |
9.882,48 |
|
|
A.3. Assets depreciation |
3.631,07 |
3.343,70 |
2.306,45 |
|
|
A.4. Variance in provision for current
assets |
131,68 |
|
|
|
|
A.5. Other operating costs |
85.603,61 |
138.660,82 |
122.423,83 |
|
|
A.I. OPERATING RESULT
(B.1-A.1-A.2-A.3-A.4-A.5) |
3.533,10 |
4.671,15 |
1.673,78 |
|
|
A.6. Financial expenses |
2.369,57 |
3.281,11 |
2.676,58 |
|
|
Debts with related companies |
2.241,88 |
2.793,85 |
|
|
|
Other companies debts |
127,69 |
487,26 |
2.676,58 |
|
|
A.7. Variation in financial investments
provision |
|
|
|
|
|
A.8. Exchange losses |
|
|
|
|
|
A.II. POSITIVE FINANCIAL RESULTS
(B.2+B.3-A.6-A.7-A.8) |
|
|
|
|
|
A.III. PROFIT FROM ORDINARY ACTIVITIES
(A.I+A.II-B.I-B.II) |
1.169,76 |
1.518,68 |
|
|
|
A.9. Variation in provision in fixed
assets |
|
|
|
|
|
A.10. Losses in fixed assets |
|
|
|
|
|
A.11. Losses from shares and bonds |
|
|
|
|
|
A.12. Extraordinary charges |
|
|
1.490,73 |
|
|
A.13. Prior year’s expenses and losses |
266,47 |
|
141,72 |
|
|
A.IV. POSITIVE EXTRAORDINARY RESULT
(B.4+B.5+B.6+B.7+B.8-A.9-A.10-A.11-A.12-A.13) |
4.853,45 |
2.139,90 |
|
|
|
A.V. EARNINGS / LOSS BEFORE TAXES
(A.III+A.IV-B.III-B.IV) |
6.023,21 |
3.658,58 |
|
|
|
A.14. Corporate Taxes |
|
|
76,17 |
|
|
A.15. Other taxes |
|
|
|
|
|
A.VI. YEAR END RESULT (PROFIT)
(A.V-A.14-A.15) |
6.023,21 |
3.658,58 |
|
|
|
B) INCOMES (B.1 a B.8) |
|
|
|
|
|
B.1. Operating income |
485.056,09 |
615.722,93 |
537.103,20 |
|
|
Turnover |
485.056,09 |
615.722,93 |
536.351,12 |
|
|
Other operating income |
|
|
752,08 |
|
|
B.I. OPERATING LOSSES
(A.1+A.2+A.3+A.4+A.5-B.1) |
|
|
|
|
|
B.2. Financial Income |
6,21 |
128,64 |
1,03 |
|
|
Other |
6,21 |
|
1,03 |
|
|
Gains from investments |
|
128,64 |
|
|
|
B.3. Gains on exchange |
0,02 |
|
|
|
|
B.II. FINANCIAL LOSSES
(A.6+A.7+A.8-B.2-B.3) |
2.363,34 |
3.152,47 |
2.675,55 |
|
|
B.III. LOSSES FROM ORDINARY ACTIVITIES
(B.I+B.II-A.I-A.II) |
|
|
1.001,77 |
|
|
B.4. Gains from disposal of fixed assets |
|
|
|
|
|
B.5. Gains from dealing in own shares |
|
|
|
|
|
B.6. Paid in surplus |
|
|
|
|
|
B.7. Extraordinary income |
5.119,92 |
2.139,90 |
1.112,68 |
|
|
B.8. Prior year’s income and profits |
|
|
|
|
|
B.IV. EXTRAORDINARY LOSSES
(A.9+A.10+A.11+A.12+A.13-B.4-B.5-B.6-B.7-B.8) |
|
|
519,77 |
|
|
B.V. LOSS BEFORE TAXES
(B.III+B.IV-A.III-A.IV) |
|
|
1.521,54 |
|
|
B.VI. NET LOSS (B.V+A.14+A.15) |
|
|
1.597,71 |
Main Ratios
|
(Figures given in Euros) |
2.003 (12) |
2.004 (12) |
2.005 (12) |
|
|
|
ACTIVITY |
|
|
|
|
|
Increase of the Sales Figures |
220,91 |
26,94 |
-12,89 |
|
|
Assets Turnover |
1,83 |
2,64 |
2,43 |
|
|
Productivity |
1,19 |
1,12 |
1,07 |
|
|
Increase of the Added Value |
259,53 |
65,88 |
-17,79 |
|
|
PROFITABILITY |
|
|
|
|
|
Economic Profitability |
2,28 |
1,57 |
-0,72 |
|
|
Financial Profitability |
41,18 |
20,01 |
-9,57 |
|
|
Financial Expenses |
0,49 |
0,53 |
0,50 |
|
|
BALANCE (IN DAYS OF SALES) |
|
|
|
|
|
Customers’ Credit (In days of sales) |
110,00 |
87,00 |
93,00 |
|
|
Suppliers’ Credit (In days of sales) |
|
|
|
|
|
Working Capital (In days of sales) |
0,00 |
3,00 |
3,00 |
|
|
Working Capital Requirement (In days of
sales) |
0,00 |
0,00 |
0,00 |
|
|
Treasury (In days of sales) |
8,00 |
11,00 |
3,00 |
|
|
BALANCE |
|
|
|
|
|
Working Capital |
-1.709,80 |
4.709,00 |
3.786,25 |
|
|
Working Capital Requirement |
-12.969,58 |
-13.920,89 |
-888,77 |
|
|
Treasury |
11.259,78 |
18.629,89 |
4.675,02 |
|
|
Balance Ratio |
0,90 |
1,35 |
1,29 |
|
|
SOLVENCY |
|
|
|
|
|
Borrowing Ratio |
94,47 |
92,16 |
92,45 |
|
|
Own / Permanent Funds |
100,00 |
100,00 |
100,00 |
|
|
Payback Capacity |
0,51 |
0,35 |
0,38 |
|
|
LIQUIDITY |
|
|
|
|
|
General Liquidity |
0,99 |
1,02 |
1,02 |
|
|
Immediate Liquidity |
0,05 |
0,09 |
0,02 |
Sectorial Analysis
Summary of Assets, Liability
& Equity
|
(Figures given in Percentages) |
Company |
Sector |
Company |
|
|
2.005 |
|
|
|
Assets |
|||
|
DUE FROM SHAREHOLDERS
FOR UNCALLED CAPITAL |
0,00 |
0,13 |
-0,13 |
|
FIXED ASSETS |
5,84 |
43,38 |
-37,54 |
|
ACCRUED EXPENSES |
0,00 |
0,47 |
-0,47 |
|
CURRENT ASSETS |
94,16 |
56,02 |
38,14 |
|
TOTAL ASSETS |
100,00 |
100,00 |
0,00 |
|
Liabilities |
|||
|
SHAREHOLDERS EQUITY |
7,55 |
45,02 |
-37,47 |
|
ACCRUED INCOME |
0,00 |
0,20 |
-0,20 |
|
RISK AND EXPENDITURE
COVER |
0,00 |
0,13 |
-0,13 |
|
LONG-TERM CREDITORS |
0,00 |
14,69 |
-14,69 |
|
SHORT-TERM CREDITORS |
92,45 |
39,85 |
52,60 |
|
SHORT-TERM RISK AND
EXPENDITURE COVER |
0,00 |
0,11 |
-0,11 |
|
TOTAL LIABILITIES |
100,00 |
100,00 |
0,00 |
Analytical Account of Results
|
(Figures given in Percentages) |
Company |
Sector |
Company |
|
|
2.005 |
|
|
|
Net turnover |
99,86 |
97,18 |
2,68 |
|
Other operating income |
0,14 |
2,82 |
-2,68 |
|
Production Value |
100,00 |
100,00 |
0,00 |
|
Operating expenses |
65,80 |
56,93 |
8,87 |
|
Other operation expenses |
22,79 |
17,02 |
5,77 |
|
Added value |
11,41 |
26,05 |
-14,64 |
|
Labor cost |
10,67 |
17,56 |
-6,89 |
|
Gross Economic Result |
0,74 |
8,49 |
-7,75 |
|
Assets depreciation |
0,43 |
2,27 |
-1,84 |
|
Variation in provision
for current assets |
0,00 |
0,19 |
-0,19 |
|
Net Economic Result |
0,31 |
6,03 |
-5,71 |
|
Financial income |
0,00 |
0,43 |
-0,42 |
|
Financial expenses |
0,50 |
1,16 |
-0,66 |
|
Variation in financial
investment provision |
0,00 |
-0,02 |
0,02 |
|
Ordinary Activities
Result |
-0,19 |
5,32 |
-5,50 |
|
Extraordinary income |
0,21 |
0,46 |
-0,25 |
|
Extraordinary expenses |
0,30 |
0,28 |
0,03 |
|
Variation in provision
in fixed assets |
0,00 |
0,00 |
-0,00 |
|
Results before Taxes |
-0,28 |
5,49 |
-5,78 |
|
Corporaye taxes |
0,01 |
1,70 |
-1,69 |
|
Net Result |
-0,30 |
3,79 |
-4,09 |
|
Assets depreciation |
0,43 |
2,27 |
-1,84 |
|
Provisions fund
variation |
0,00 |
0,17 |
-0,17 |
|
Net Self-Financing |
0,13 |
6,23 |
-6,10 |
Ratios
|
(Figures given in ) |
Company |
Ptile25 |
Medium |
Ptile75 |
|
|
2.005 |
|
|
|
|
ACTIVITY |
|
|
|
|
|
Increase of the Sales
Figures |
-12,89 |
-11,20 |
2,56 |
16,14 |
|
Assets Turnover |
2,43 |
0,79 |
1,40 |
2,24 |
|
Fixed Assets Turnover |
41,58 |
1,97 |
5,76 |
16,52 |
|
Increase of the Added
Value |
-17,79 |
-11,56 |
2,49 |
16,15 |
|
PRODUCTIVITY |
|
|
|
|
|
Productivity |
1,07 |
1,19 |
1,41 |
1,84 |
|
Change of Personnel
Costs |
-13,87 |
-1,36 |
6,57 |
20,52 |
|
Average Personnel Costs |
11.462,04 |
15.433,74 |
21.154,72 |
31.402,92 |
|
Value Added by Employees |
12.258,09 |
21.805,34 |
32.586,91 |
49.945,54 |
|
CASH FLOW |
|
|
|
|
|
Cash Flow |
708,74 |
7.587,76 |
19.022,95 |
41.750,09 |
|
Operating Cash Flow |
3.980,23 |
9.951,66 |
25.992,83 |
59.705,01 |
|
Change in Cash Flow |
-89,88 |
-34,83 |
-6,15 |
20,67 |
|
PROFITABILITY |
|
|
|
|
|
Economic Profitability |
-0,72 |
1,20 |
3,67 |
8,88 |
|
Financial Profitability |
-9,58 |
4,49 |
12,56 |
25,72 |
|
Financial Expenses |
0,50 |
0,06 |
0,54 |
1,67 |
|
Gross Economic
Profitability |
1,80 |
5,77 |
10,51 |
19,10 |
|
Gross Financial
Profitability |
23,85 |
16,63 |
36,09 |
66,96 |
|
BALANCE (IN DAYS OF SALES) |
|
|
|
|
|
Customers’ Credit (In
days of sales) |
92,00 |
31,09 |
72,37 |
126,81 |
|
Suppliers’ Credit (In
days of sales) |
|
0,00 |
0,00 |
0,00 |
|
Working Capital (In days
of sales) |
2,00 |
2,82 |
38,91 |
106,44 |
|
Working Capital
Requirement (In days of sales) |
0,00 |
-42,35 |
-0,57 |
39,76 |
|
Treasury (In days of
sales) |
3,00 |
9,11 |
33,04 |
88,17 |
|
Operating Current Assets |
139,00 |
103,55 |
163,13 |
263,65 |
|
BALANCE |
|
|
|
|
|
Working Capital |
3.786,25 |
2.184,73 |
31.334,52 |
104.692,43 |
|
Working Capital
Requirement |
-888,77 |
-30.374,29 |
-301,20 |
37.890,70 |
|
Treasury |
4.675,02 |
6.922,09 |
24.969,52 |
70.531,13 |
|
Balance Ratio |
1,29 |
1,04 |
1,65 |
3,94 |
|
SOLVENCY |
|
|
|
|
|
Borrowing Ratio |
92,45 |
40,98 |
65,20 |
82,02 |
|
Own / Permanent Funds |
100,00 |
58,63 |
92,55 |
100,00 |
|
Payback Capacity |
0,38 |
0,22 |
0,38 |
0,68 |
|
Long term Indebtedness |
|
0,00 |
2,71 |
20,43 |
|
Gearing |
1.324,34 |
169,44 |
287,33 |
556,24 |
|
Financing Basic Ratio |
1,00 |
1,00 |
1,00 |
1,00 |
|
Assets Guarantee |
1,08 |
1,16 |
1,45 |
2,32 |
|
LIQUIDITY |
|
|
|
|
|
General Liquidity |
1,02 |
1,02 |
1,33 |
2,28 |
|
Immediate Liquidity |
0,02 |
0,08 |
0,32 |
0,92 |
RATING EXPLANATIONS
|
RATING |
STATUS |
PROPOSED CREDIT LINE |
|
|
>86 |
Aaa |
Possesses an extremely sound financial
base with the strongest capability for timely payment of interest and
principal sums |
Unlimited |
|
71-85 |
Aa |
Possesses adequate working capital. No
caution needed for credit transaction. It has above average (strong)
capability for payment of interest and principal sums |
Large |
|
56-70 |
A |
Financial & operational base are
regarded healthy. General unfavourable factors will not cause fatal effect.
Satisfactory capability for payment of interest and principal sums |
Fairly Large |
|
41-55 |
Ba |
Overall operation is considered normal.
Capable to meet normal commitments. |
Satisfactory |
|
26-40 |
B |
Unfavourable & favourable factors
carry similar weight in credit consideration. Capability to overcome
financial difficulties seems comparatively below average/normal. |
Small |
|
11-25 |
Ca |
Adverse factors are apparent. Repayment of
interest and principal sums in default or expected to be in default upon
maturity |
Limited with full security |
|
<10 |
C |
Absolute credit risk exists. Caution
needed to be exercised |
Credit not recommended |
|
NR |
In view of the lack of information, we
have no basis upon which to recommend credit dealings |
No Rating |
|