
MIRA
INFORM REPORT
|
Report Date : |
5th
January, 2007 |
IDENTIFICATION
DETAILS
|
Name : |
CREACIONES
TOYPES S.L. |
|
|
|
|
Registered Office : |
Calle
Da Corredoira, 33, 36500 Lalin (Pontevedra) |
|
|
|
|
Country : |
Spain |
|
|
|
|
Financials (as on) : |
31.12.2004 |
|
|
|
|
Date of Incorporation : |
02/05/1983 |
|
|
|
|
Legal Form : |
Limited
Liability Company |
|
|
|
|
Line of Business : |
Manufacture
of other wearing apparel and accessories |
RATING & COMMENTS
|
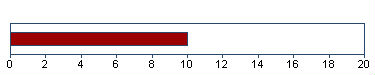
MIRA’s Rating : |
B |
|
RATING |
STATUS |
PROPOSED CREDIT LINE |
|
|
26-40 |
B |
Unfavourable & favourable factors
carry similar weight in credit consideration. Capability to overcome
financial difficulties seems comparatively below average/normal. |
Small |
|
Status : |
Moderate |
|
|
|
|
Payment Behaviour : |
Usually
Correct |
|
|
|
|
Litigation : |
Clear |
Identification and Characteristics
COMPANY
SITUATION: REAPERTURA DE HOJA
REGISTRAL ART. 3781 RRMM
Tax
Number B36021723
NAME CREACIONES
TOYPES S.L.
ANAGRAM TOYPES
TRADE
NAME NOVO Y
GONZALEZ
FORMER
NAME CREACIONES
TOYPEZ SL
BUSINESS
ADDRESS CALLE DA
CORREDOIRA, 33
Postcode 36500
LALIN (PONTEVEDRA)
URL http://www.toypes.com
TELEPHONE 986780338
FAX 986781411
LEGAL
FORM LIMITED
LIABILITY COMPANY
DATE
FOUNDED 02/05/1983
CAPITAL 1.920.000,00 Euros
NUMBER
OF EMPLOYEES 150
BANKS BSCH
OF 4989; B PASTOR; B POPULAR OF 1241; CAJAMADRID OF
4012;
ACTIVITY 1453000 - Textile
confection: mass production
CNAE 1820 - Manufacture
of other wearing apparel and accessories
EXPORT
COMPANY YES
IMPORT
COMPANY YES
Synthesis
FINANCIAL SITUATION (Year
ending: 31/12/2004)
![]()
PROFITABILITY ![]() 4/9 Nil
4/9 Nil
TREASURY ![]() 4/9 Tense
4/9 Tense
BALANCE
SHEET ![]() 3/9 Degraded
3/9 Degraded
DEBT ![]() 6/9 Medium
6/9 Medium
INCIDENTS
![]()
COMMITMENTS ![]() 9/9 Respected
9/9 Respected
INCIDENTS ![]() 9/9 None
or Negligible
9/9 None
or Negligible
PREVIOUS EXPERIENCE
![]()
PREVIOUS
EXPERIENCE ![]() 6/9 Average
6/9 Average
Credit Appraisal
CREDIT ACCORDING TO OBJECTIVE
DATA (From 0 to 500.000,00 Euros):
FAVOURABLE
TOWARDS 39.997,36 Max.
SOLVENCY RATING:
10/20 (BASED ON HOMOGENEOUS
FORMULATION)
Financial Elements
Figures given in Euros
|
|
Balance sheet 2.002 (12) |
Balance sheet 2.003 (12) |
Balance sheet 2.004 (12) |
% Sales |
|
SALES |
7.309.340,00 |
7.533.683,00 |
5.727.676,00 |
|
|
ADDED VALUE |
2.319.960,00 |
2.512.211,00 |
2.660.145,00 |
46,44 |
|
BUSINESS RESULT |
151.954,00 |
166.156,00 |
22.784,00 |
0,40 |
|
OWN FUNDS |
1.801.786,00 |
1.967.942,00 |
1.990.726,00 |
|
|
DEBT |
6.020.851,00 |
6.086.055,00 |
7.863.707,00 |
|
|
TOTAL ASSET |
7.822.637,00 |
8.053.997,00 |
9.854.433,00 |
|
The sales of 5.727.676,00
Euros show a change of -23,97% compared with
2.003 . Between 2.002 and 2.003 , this change
was 3,07% .
Added value grew by 5,89%
compared with the previous year. Shareholders equity are 1.990.726,00
Euros for an indebtedness of 7.863.707,00 Euros .
The result 22.784,00 Euros
means financial profitability of 1,14% and economic profitability
of 0,23% . This result means growth of -86,29% compared
with the 2.003 .
THE FIGURES FOR THE LAST BALANCE SHEET ARE
RELEVANT:
SOURCE: FROM THE MERCANTILE REGISTER
DATE: 22/12/2005
Auditors’ opinion:
FAVOURABLE (2.004)
Auditors:
DELOITTE SL
Comparative Sector Analysis
|
|
Company |
Sector |
Difference |
|
|
(2.004) |
|
|
|
% of PRODUCTION VALUE |
|
|
|
|
SALES |
96,80 |
98,97 |
-2,17 |
|
ADDED
VALUE |
44,96 |
24,49 |
20,47 |
|
BUSINESS
RESULT |
0,39 |
2,51 |
-2,12 |
|
% OF TOTAL ASSETS |
|
|
|
|
OWN
FUNDS |
20,20 |
41,99 |
-21,79 |
|
DEBT |
79,80 |
58,01 |
21,79 |
Compared sector (CNAE): 182 - Confección de prendas de
vestir en textiles y accesorios
Number of companies: 168
Size (Sales Figure): 2.800.000,00 - 7.000.000,00 Euros
The turnover of the company is 2,17%
below the mean for the sector.
The company’s added value was 44,96%
s/ the production value, and 20,47% above the mean for the sector.
The company’s business result was
0,39% of the PV, 2,12% below the mean for the sector.
The company’s own resources are 20,20%
, 21,79% below the mean for the sector.
The company’s outside resources are
79,80% , 21,79% above the mean for the sector.
Legal Actions
No legal incidences registered
for this company in the official source
No claims registered for this
company in the official sources
AFFECTED BY: No significant
elemento
Main Board members, Directors and
Auditor
|
Position |
Surname and name |
Date of appointment |
|
CHAIRMAN |
GONZALEZ MONTERO RAMON LEONARDO |
27/12/2004 |
|
BOARD MEMBER |
IGLESIAS SOUTO MARIA BERNARDA |
27/12/2004 |
|
GENERAL MANAGER |
SUCASAS PEON JOSE ANGEL |
14/03/2004 |
|
BOARD MEMBER |
GONZALEZ MOSQUERA BEATRIZ |
27/12/2004 |
|
BOARD MEMBER |
ROMANO EGEA JOSE JAVIER |
27/12/2004 |
|
BOARD MEMBER |
NOVO IGLESIAS JOSE ALBERTO |
27/12/2004 |
|
AUDITOR |
DRT DELOITTE TOUCHE S A |
13/08/1993 |
Financial Links
|
Shareholders |
||||
|
Company Name |
|
|
Source |
Information Date |
|
GONZALEZ MONTERO RAMON |
|
50,00% |
OWN SOURCES |
10/01/2002 |
|
IGLESIAS SOUTO BERNARDA |
|
34,00% |
OWN SOURCES |
10/01/2002 |
|
NOVO IGLESIAS ALBERTO |
|
16,00% |
OWN SOURCES |
10/01/2002 |
Proceedings published in the
B.O.R.M.E. (Official Mercantile Register Gazette)
|
Proceedings |
Date |
Notice Num. |
Mercantile Reg. |
|
Capital increase |
30/05/2006 |
277742 |
PONTEVEDRA |
|
Registration of accounts
(2004) |
12/08/2005 |
213373 |
PONTEVEDRA |
|
Appointments |
27/12/2004 |
540243 |
PONTEVEDRA |
|
Resignations |
27/12/2004 |
540242 |
PONTEVEDRA |
|
Appointments |
27/12/2004 |
540242 |
PONTEVEDRA |
Press articles
11/11/2006 VOZ
GALIC SOCIAL
INFORMATION
LA EMPRESA TEXTIL TOYPES COMUNICO EL 10/11/06
A LA PLANTILLA EL INICIO DE UN EXPEDIENTE DE REGULACION DE EMPLEO QUE AFECTARA
A 50 TRABAJADORES DE LOS 118 QUE SE ENCUENTRAN ACTUALMENTE EN NOMINA. LA CAUSA
DE LA MEDIDA ES UNA REES TRUCTURACION EMPRESARIAL PROVOCADA POR LA SITUACION
GRAL. DEL TEXTIL. EL EX PEDIENTE, QUE AUN NO HA SIDO PRESENTADO EN TRABAJO,
TRAERA APAREJADA UNA RE DUCCION DEL NUMERO DE PUESTOS DE TRABAJO EN TODAS LAS
FASES DE LA CADENA DE PRODUCCION.
30/06/2005 VOZ
GALIC GENERAL
INFORMATION
TOYPES, CON UNA FACTURACION DE 5,7 MM. DE EUROS
EN 2004, APUESTA POR EL MER CADO EXTERIOR Y PARA ELLO HA PUESTO EN MARCHA UN
PLAN ESTRATEGICO CON EL QUE PRETENDE DUPLICAR SU FACTURACION EN LOS PROXIMOS 5
AÑOS, HASTA ALCANZAR LOS 12 MM. DE EUROS. DE MOMENTO, LA CIA. YA HA EXTENDIDO
SU RED DE DISTRIBUCION A RUSIA, PAIS EN EL QUE HA INICIADO LA COMERCIALIZACION
DE SU COLECCION DE OTOÑO-INVIERNO 2005-2006. ADEMAS, BUSCA DISTRIBUIDORES EN
POLONIA, NORUEGA, JAPON Y EMIRATOS ARABES Y PREVE ESTABLECER NUEVOS ACUERDOS EN
PAISES EN LOS QUE ESTA PRESENTE, COMO INGLATERRA, IRLANDA, EE.UU., PORTUGAL Y
MEXICO. EL 20% DE LAS VENTAS PROCEDE DEL EXTERIOR Y SE PREVE ALCANZAR EL 40% EN
5 AÑOS.
Complementary Information
26/12/2006 BLOQUE DE
INVESTIGACION:
- Actividad: Confeccion de
prendas de vestir, calzado y complementos.
- Realiza transacciones
intracomunitarios de compra-venta.
- La titular fue fundada por
MANUEL NOVO y RAMON GONZALEZ.
----------------------------------------------------------------------
El Bloque de Investigacion no
esta sujeto a actualizaciones sistemati-
cas. Los datos mostrados fueros
aportados por las fuentes consultadas
en la fecha del encabezamiento.
Brands, Signs and Commercial
Names
|
Prevailing Brands |
|||||
|
Name: |
CREACIONES TOYPES |
||||
|
Kind of Brand: |
DENOMINATIVE |
File: |
M2231124 |
||
|
Request Date: |
30/04/1999 |
Bulletin Date: |
Bulletin Date: |
Current situation: |
APPROVED REGISTER |
|
Types: 39 |
|
||||
|
Name: |
CREACIONES TOYPES |
||||
|
Kind of Brand: |
DENOMINATIVE |
File: |
M2231125 |
||
|
Request Date: |
30/04/1999 |
Bulletin Date: |
Bulletin Date: |
Current situation: |
APPROVED REGISTER |
|
Types: 18 |
|
||||
|
Name: |
CREACIONES TOYPES |
||||
|
Kind of Brand: |
DENOMINATIVE |
File: |
M2231126 |
||
|
Request Date: |
30/04/1999 |
Bulletin Date: |
Bulletin Date: |
Current situation: |
APPROVED REGISTER |
|
Types: 3 |
|
||||
Total Marcas: 3
The information on the last account contained
in this report is extracted from the Mercantile Register file of the legal
address of the Company and dated 22/12/2005
Balance Sheet (ASSETS)
|
(Figures given in Euros) |
31/12/2002 (12) |
31/12/2003 (12) |
31/12/2004 (12) |
|
|
|
A) DUE FROM SHAREHOLDERS FOR UNCALLED
CAPITAL |
|
|
|
|
|
B) FIXED ASSETS |
3.417.977,00 |
3.660.713,00 |
5.318.770,00 |
|
|
I. Establishment expenses |
|
|
|
|
|
II. Intangible assets |
257.155,00 |
251.988,00 |
698.102,00 |
|
|
R & D expenses |
255.450,00 |
153.866,00 |
151.354,00 |
|
|
Concessions, patents,licences , trademarks |
1.705,00 |
1.705,00 |
|
|
|
Acquired rights from finance leases |
|
90.152,00 |
318.303,00 |
|
|
Software |
|
|
26.335,00 |
|
|
Leasing |
|
9.270,00 |
237.252,00 |
|
|
Amortization |
|
-3.005,00 |
-35.142,00 |
|
|
III. Tangible assets |
3.160.822,00 |
3.401.362,00 |
4.611.555,00 |
|
|
Property, plant and equipment |
2.211.181,00 |
2.238.954,00 |
3.217.338,00 |
|
|
Machinery, equipment and other |
755.610,00 |
771.758,00 |
778.194,00 |
|
|
Other property plant and equipement |
213.917,00 |
227.226,00 |
514.273,00 |
|
|
Prepaid expenses on fixed assets |
963.119,00 |
1.308.730,00 |
1.408.422,00 |
|
|
Other assets |
213.979,00 |
220.401,00 |
233.304,00 |
|
|
Depreciation |
-1.196.984,00 |
-1.365.707,00 |
-1.539.976,00 |
|
|
IV. Financial assets |
|
7.363,00 |
9.113,00 |
|
|
Long term deposits and guarantees |
|
7.363,00 |
9.113,00 |
|
|
V. Owners equity |
|
|
|
|
|
VI. Long term trade liabilities |
|
|
|
|
|
C) DEFERRED EXPENSES |
|
|
|
|
|
D) CURRENT ASSETS |
4.404.660,00 |
4.393.284,00 |
4.535.663,00 |
|
|
I. Not paid in shareholder capital |
|
|
|
|
|
II. Inventory |
2.192.971,00 |
1.566.585,00 |
2.361.392,00 |
|
|
Raw material inventory |
435.517,00 |
391.275,00 |
472.504,00 |
|
|
Work in Progress |
528.129,00 |
419.705,00 |
553.950,00 |
|
|
Finished goods |
1.229.325,00 |
755.605,00 |
1.438.067,00 |
|
|
Provisions |
|
|
-103.129,00 |
|
|
III. Debtors |
1.950.749,00 |
2.598.309,00 |
2.031.486,00 |
|
|
Clients |
1.871.231,00 |
2.612.912,00 |
2.112.008,00 |
|
|
Amounts owned by affiliated companies |
|
25.056,00 |
55.025,00 |
|
|
Other debts |
15.915,00 |
3.443,00 |
3.083,00 |
|
|
Taxes refunds |
150.234,00 |
55.550,00 |
91.779,00 |
|
|
Provisions |
-86.631,00 |
-98.652,00 |
-230.409,00 |
|
|
IV. Short term financial assets |
|
|
2.925,00 |
|
|
Short term investment |
|
|
2.925,00 |
|
|
V. Short term owners equity |
|
|
|
|
|
VI. Cash |
260.940,00 |
228.390,00 |
130.337,00 |
|
|
VII. Prepaid expenses and accrued income |
|
|
9.523,00 |
|
|
ASSETS (A + B + C + D) |
7.822.637,00 |
8.053.997,00 |
9.854.433,00 |
Balance Sheet (LIABILITIES)
|
(Figures given in Euros) |
31/12/2002 (12) |
31/12/2003 (12) |
31/12/2004 (12) |
|
|
|
A) SHAREHOLDERS EQUITY |
1.801.786,00 |
1.967.942,00 |
1.990.726,00 |
|
|
I. Capital |
600.000,00 |
600.000,00 |
600.000,00 |
|
|
II. Premium share account |
|
|
|
|
|
III. Revaluation reserve |
|
|
|
|
|
IV. Reserves |
1.097.361,00 |
1.201.786,00 |
1.367.942,00 |
|
|
Retained earnings |
24.040,00 |
39.235,00 |
55.851,00 |
|
|
Other funds |
1.073.321,00 |
1.162.551,00 |
1.312.091,00 |
|
|
V. Prior year earnings |
-47.529,00 |
|
|
|
|
Prior years losses |
-47.529,00 |
|
|
|
|
VI. Prior year profit or losses |
151.954,00 |
166.156,00 |
22.784,00 |
|
|
VII. Dividend paid during the year |
|
|
|
|
|
VIII. Own shares for change in capital |
|
|
|
|
|
B) DEFERRED INCOME |
|
|
|
|
|
C) PROVISIONS FOR LIABILITIES AND EXPENSES |
|
|
|
|
|
D) LONG TERM LIABILITIES |
2.483.653,00 |
2.158.672,00 |
3.049.689,00 |
|
|
I. Bonds |
|
|
|
|
|
II. Bank loans |
2.483.052,00 |
2.158.071,00 |
3.049.689,00 |
|
|
Long term bank loans |
2.483.052,00 |
2.158.071,00 |
3.049.689,00 |
|
|
III. Debts with associed and affiliated
companies |
|
|
|
|
|
IV. Other creditors |
601,00 |
601,00 |
|
|
|
Other debts |
601,00 |
601,00 |
|
|
|
V. Deferred debts on shares |
|
|
|
|
|
VI. Long term debt with creditor |
|
|
|
|
|
E) SHORT TERM LIABILITIES |
3.537.198,00 |
3.927.383,00 |
4.814.018,00 |
|
|
I. Negotiable bonds |
|
|
|
|
|
II. Bank loans |
1.586.962,00 |
1.971.135,00 |
3.398.067,00 |
|
|
Loans and other debts |
1.586.962,00 |
1.971.135,00 |
3.391.790,00 |
|
|
Debt interest |
|
|
6.277,00 |
|
|
III. Short term debts with associated and
affiliated companies |
|
513.946,00 |
|
|
|
With affiliated companies |
|
513.946,00 |
|
|
|
IV. Trade creditors |
1.836.916,00 |
1.246.023,00 |
1.037.135,00 |
|
|
Expenses |
1.836.916,00 |
1.246.023,00 |
1.037.135,00 |
|
|
V. Other non trade payables |
113.320,00 |
196.279,00 |
378.816,00 |
|
|
Government |
37.819,00 |
86.479,00 |
45.418,00 |
|
|
Other debts |
5.373,00 |
7.041,00 |
236.906,00 |
|
|
Accounts receivable |
70.128,00 |
102.759,00 |
96.492,00 |
|
|
VI. Provisions for current assets |
|
|
|
|
|
VII. Accruals and deferred incomes |
|
|
|
|
|
F) SHORT TERM PROVISIONS FOR LIABILITIES
AND EXPENSES |
|
|
|
|
|
LIABILITIES (A + B + C + D + E + F) |
7.822.637,00 |
8.053.997,00 |
9.854.433,00 |
Profit and Loss Account
|
(Figures given in Euros) |
31/12/2002 (12) |
31/12/2003 (12) |
31/12/2004 (12) |
|
|
|
A) EXPENSES (A.1 a A.15) |
|
|
|
|
|
A.1 Operating Expenses |
4.071.669,00 |
3.975.385,00 |
2.174.305,00 |
|
|
A.3. Labor cost |
1.294.741,00 |
1.459.807,00 |
1.574.151,00 |
|
|
Wages |
1.007.258,00 |
1.139.290,00 |
1.266.923,00 |
|
|
Social security expenses |
287.483,00 |
320.517,00 |
307.228,00 |
|
|
A.3. Assets depreciation |
361.155,00 |
427.178,00 |
360.272,00 |
|
|
A.4. Variance in provision for current
assets |
8.769,00 |
79.791,00 |
236.773,00 |
|
|
A.5. Other operating costs |
1.257.395,00 |
1.293.963,00 |
1.082.860,00 |
|
|
A.I. OPERATING RESULT
(B.1-A.1-A.2-A.3-A.4-A.5) |
655.295,00 |
545.435,00 |
488.949,00 |
|
|
A.6. Financial expenses |
443.034,00 |
318.697,00 |
360.299,00 |
|
|
Other companies debts |
443.034,00 |
318.697,00 |
360.299,00 |
|
|
A.7. Variation in financial investments
provision |
|
|
|
|
|
A.8. Exchange losses |
2.949,00 |
15,00 |
62,00 |
|
|
A.II. POSITIVE FINANCIAL RESULTS
(B.2+B.3-A.6-A.7-A.8) |
|
|
|
|
|
A.III. PROFIT FROM ORDINARY ACTIVITIES
(A.I+A.II-B.I-B.II) |
218.055,00 |
233.228,00 |
167.190,00 |
|
|
A.9. Variation in provision in fixed
assets |
|
|
|
|
|
A.10. Losses in fixed assets |
|
|
1.705,00 |
|
|
A.11. Losses from shares and bonds |
|
|
|
|
|
A.12. Extraordinary charges |
|
5.222,00 |
89,00 |
|
|
A.13. Prior year’s expenses and losses |
|
24.860,00 |
175.998,00 |
|
|
A.IV. POSITIVE EXTRAORDINARY RESULT
(B.4+B.5+B.6+B.7+B.8-A.9-A.10-A.11-A.12-A.13) |
15.721,00 |
22.397,00 |
|
|
|
A.V. EARNINGS / LOSS BEFORE TAXES
(A.III+A.IV-B.III-B.IV) |
233.776,00 |
255.625,00 |
31.627,00 |
|
|
A.14. Corporate Taxes |
81.822,00 |
89.469,00 |
8.843,00 |
|
|
A.15. Other taxes |
|
|
|
|
|
A.VI. YEAR END RESULT (PROFIT)
(A.V-A.14-A.15) |
151.954,00 |
166.156,00 |
22.784,00 |
|
|
B) INCOMES (B.1 a B.8) |
|
|
|
|
|
B.1. Operating income |
7.649.024,00 |
7.781.559,00 |
5.917.310,00 |
|
|
Turnover |
7.309.340,00 |
7.533.683,00 |
5.727.676,00 |
|
|
Other operating income |
339.684,00 |
247.876,00 |
189.634,00 |
|
|
B.I. OPERATING LOSSES
(A.1+A.2+A.3+A.4+A.5-B.1) |
|
|
|
|
|
B.2. Financial Income |
6.075,00 |
6.505,00 |
38.349,00 |
|
|
Other |
6.075,00 |
6.505,00 |
38.312,00 |
|
|
Gains from investments |
|
|
37,00 |
|
|
B.3. Gains on exchange |
2.668,00 |
|
253,00 |
|
|
B.II. FINANCIAL LOSSES
(A.6+A.7+A.8-B.2-B.3) |
437.240,00 |
312.207,00 |
321.759,00 |
|
|
B.III. LOSSES FROM ORDINARY ACTIVITIES
(B.I+B.II-A.I-A.II) |
|
|
|
|
|
B.4. Gains from disposal of fixed assets |
|
|
|
|
|
B.5. Gains from dealing in own shares |
|
|
|
|
|
B.6. Paid in surplus |
|
|
|
|
|
B.7. Extraordinary income |
15.721,00 |
52.479,00 |
40.869,00 |
|
|
B.8. Prior year’s income and profits |
|
|
1.360,00 |
|
|
B.IV. EXTRAORDINARY LOSSES
(A.9+A.10+A.11+A.12+A.13-B.4-B.5-B.6-B.7-B.8) |
|
|
135.563,00 |
|
|
B.V. LOSS BEFORE TAXES
(B.III+B.IV-A.III-A.IV) |
|
|
|
|
|
B.VI. NET LOSS (B.V+A.14+A.15) |
|
|
|
Main Ratios
|
(Figures given in Euros) |
2.002 (12) |
2.003 (12) |
2.004 (12) |
|
|
|
ACTIVITY |
|
|
|
|
|
Increase of the Sales Figures |
2,43 |
3,07 |
-23,97 |
|
|
Assets Turnover |
0,93 |
0,94 |
0,58 |
|
|
Productivity |
1,79 |
1,72 |
1,69 |
|
|
Increase of the Added Value |
6,81 |
8,29 |
5,89 |
|
|
PROFITABILITY |
|
|
|
|
|
Economic Profitability |
1,94 |
2,06 |
0,23 |
|
|
Financial Profitability |
8,43 |
8,44 |
1,15 |
|
|
Financial Expenses |
6,06 |
4,23 |
6,29 |
|
|
BALANCE (IN DAYS OF SALES) |
|
|
|
|
|
Customers’ Credit (In days of sales) |
96,00 |
124,00 |
128,00 |
|
|
Suppliers’ Credit (In days of sales) |
162,00 |
113,00 |
172,00 |
|
|
Working Capital (In days of sales) |
43,00 |
22,00 |
0,00 |
|
|
Working Capital Requirement (In days of
sales) |
108,00 |
106,00 |
188,00 |
|
|
Treasury (In days of sales) |
0,00 |
0,00 |
0,00 |
|
|
BALANCE |
|
|
|
|
|
Working Capital |
867.462,00 |
465.901,00 |
-278.355,00 |
|
|
Working Capital Requirement |
2.193.484,00 |
2.208.646,00 |
2.986.450,00 |
|
|
Treasury |
-1.326.022,00 |
-1.742.745,00 |
-3.264.805,00 |
|
|
Balance Ratio |
1,25 |
1,13 |
0,95 |
|
|
SOLVENCY |
|
|
|
|
|
Borrowing Ratio |
76,97 |
75,57 |
79,80 |
|
|
Own / Permanent Funds |
42,04 |
47,69 |
39,49 |
|
|
Payback Capacity |
0,78 |
0,76 |
1,24 |
|
|
LIQUIDITY |
|
|
|
|
|
General Liquidity |
1,25 |
1,12 |
0,94 |
|
|
Immediate Liquidity |
0,07 |
0,06 |
0,03 |
Sectorial Analysis
Summary of Assets, Liability
& Equity
|
(Figures given in Percentages) |
Company |
Sector |
Company |
|
|
2.004 |
|
|
|
Assets |
|||
|
DUE FROM SHAREHOLDERS
FOR UNCALLED CAPITAL |
0,00 |
0,03 |
-0,03 |
|
FIXED ASSETS |
53,97 |
24,45 |
29,52 |
|
ACCRUED EXPENSES |
0,00 |
0,17 |
-0,17 |
|
CURRENT ASSETS |
46,03 |
75,35 |
-29,32 |
|
TOTAL ASSETS |
100,00 |
100,00 |
0,00 |
|
Liabilities |
|||
|
SHAREHOLDERS EQUITY |
20,20 |
41,99 |
-21,79 |
|
ACCRUED INCOME |
0,00 |
0,38 |
-0,38 |
|
RISK AND EXPENDITURE
COVER |
0,00 |
0,10 |
-0,10 |
|
LONG-TERM CREDITORS |
30,95 |
8,68 |
22,27 |
|
SHORT-TERM CREDITORS |
48,85 |
48,81 |
0,04 |
|
SHORT-TERM RISK AND
EXPENDITURE COVER |
0,00 |
0,04 |
-0,04 |
|
TOTAL LIABILITIES |
100,00 |
100,00 |
0,00 |
Analytical Account of Results
|
(Figures given in Percentages) |
Company |
Sector |
Company |
|
|
2.004 |
|
|
|
Net turnover |
96,80 |
98,97 |
-2,18 |
|
Other operating income |
3,20 |
1,03 |
2,18 |
|
Production Value |
100,00 |
100,00 |
0,00 |
|
Operating expenses |
36,74 |
60,76 |
-24,01 |
|
Other operation expenses |
18,30 |
14,76 |
3,54 |
|
Added value |
44,96 |
24,49 |
20,47 |
|
Labor cost |
26,60 |
17,89 |
8,72 |
|
Gross Economic Result |
18,35 |
6,60 |
11,75 |
|
Assets depreciation |
6,09 |
1,94 |
4,15 |
|
Variation in provision
for current assets |
4,00 |
0,21 |
3,79 |
|
Net Economic Result |
8,26 |
4,45 |
3,82 |
|
Financial income |
0,65 |
0,45 |
0,21 |
|
Financial expenses |
6,09 |
1,59 |
4,50 |
|
Variation in financial
investment provision |
0,00 |
-0,05 |
0,05 |
|
Ordinary Activities
Result |
2,83 |
3,35 |
-0,52 |
|
Extraordinary income |
0,71 |
0,56 |
0,15 |
|
Extraordinary expenses |
3,00 |
0,22 |
2,78 |
|
Variation in provision
in fixed assets |
0,00 |
-0,01 |
0,01 |
|
Results before Taxes |
0,53 |
3,70 |
-3,16 |
|
Corporaye taxes |
0,15 |
1,19 |
-1,04 |
|
Net Result |
0,39 |
2,51 |
-2,12 |
|
Assets depreciation |
6,09 |
1,94 |
4,15 |
|
Provisions fund
variation |
4,00 |
0,16 |
3,84 |
|
Net Self-Financing |
10,47 |
4,61 |
5,87 |
Ratios
|
(Figures given in ) |
Company |
Ptile25 |
Medium |
Ptile75 |
|
|
2.004 |
|
|
|
|
ACTIVITY |
|
|
|
|
|
Increase of the Sales
Figures |
-23,97 |
-9,40 |
1,27 |
9,56 |
|
Assets Turnover |
0,58 |
1,19 |
1,63 |
2,17 |
|
Fixed Assets Turnover |
1,08 |
4,19 |
8,33 |
18,14 |
|
Increase of the Added
Value |
5,89 |
-11,18 |
-0,80 |
10,66 |
|
PRODUCTIVITY |
|
|
|
|
|
Productivity |
1,69 |
1,20 |
1,34 |
1,78 |
|
Change of Personnel
Costs |
7,83 |
-1,02 |
5,55 |
13,54 |
|
Average Personnel Costs |
15.283,02 |
15.072,21 |
18.162,89 |
23.043,67 |
|
Value Added by Employees |
25.826,65 |
19.531,67 |
27.557,25 |
37.381,88 |
|
CASH FLOW |
|
|
|
|
|
Cash Flow |
619.829,00 |
73.005,52 |
135.327,51 |
225.525,61 |
|
Operating Cash Flow |
1.085.994,00 |
119.618,30 |
204.476,16 |
324.970,42 |
|
Change in Cash Flow |
-7,92 |
-28,23 |
-8,53 |
16,20 |
|
PROFITABILITY |
|
|
|
|
|
Economic Profitability |
0,23 |
1,17 |
3,00 |
6,68 |
|
Financial Profitability |
1,14 |
3,37 |
9,01 |
17,31 |
|
Financial Expenses |
6,29 |
0,55 |
1,11 |
2,10 |
|
Gross Economic
Profitability |
11,02 |
6,06 |
9,08 |
14,51 |
|
Gross Financial
Profitability |
54,55 |
15,06 |
28,58 |
47,90 |
|
BALANCE (IN DAYS OF SALES) |
|
|
|
|
|
Customers’ Credit (In
days of sales) |
127,00 |
36,15 |
64,57 |
108,54 |
|
Suppliers’ Credit (In
days of sales) |
171,00 |
0,00 |
0,00 |
0,00 |
|
Working Capital (In days
of sales) |
0,00 |
14,21 |
47,96 |
87,37 |
|
Working Capital
Requirement (In days of sales) |
187,00 |
-9,14 |
29,37 |
73,55 |
|
Treasury (In days of
sales) |
0,00 |
3,04 |
15,02 |
37,91 |
|
Operating Current Assets |
285,00 |
118,13 |
162,59 |
231,49 |
|
BALANCE |
|
|
|
|
|
Working Capital |
-278.355,00 |
157.080,83 |
447.522,81 |
966.102,60 |
|
Working Capital
Requirement |
2.986.450,00 |
-82.222,76 |
312.721,48 |
718.922,89 |
|
Treasury |
-3.264.805,00 |
32.108,44 |
134.785,51 |
386.274,44 |
|
Balance Ratio |
0,95 |
1,31 |
2,16 |
4,15 |
|
SOLVENCY |
|
|
|
|
|
Borrowing Ratio |
79,80 |
45,10 |
65,21 |
78,22 |
|
Own / Permanent Funds |
39,50 |
68,97 |
93,80 |
99,85 |
|
Payback Capacity |
1,24 |
0,23 |
0,34 |
0,50 |
|
Long term Indebtedness |
30,95 |
0,05 |
2,81 |
12,10 |
|
Gearing |
495,02 |
182,15 |
287,48 |
459,20 |
|
Financing Basic Ratio |
1,00 |
1,00 |
1,00 |
1,00 |
|
Assets Guarantee |
1,25 |
1,26 |
1,48 |
2,21 |
|
LIQUIDITY |
|
|
|
|
|
General Liquidity |
0,94 |
1,14 |
1,41 |
1,87 |
|
Immediate Liquidity |
0,03 |
0,03 |
0,14 |
0,46 |
RATING EXPLANATIONS
|
RATING |
STATUS |
PROPOSED CREDIT LINE |
|
|
>86 |
Aaa |
Possesses an extremely sound financial
base with the strongest capability for timely payment of interest and
principal sums |
Unlimited |
|
71-85 |
Aa |
Possesses adequate working capital. No
caution needed for credit transaction. It has above average (strong)
capability for payment of interest and principal sums |
Large |
|
56-70 |
A |
Financial & operational base are
regarded healthy. General unfavourable factors will not cause fatal effect.
Satisfactory capability for payment of interest and principal sums |
Fairly Large |
|
41-55 |
Ba |
Overall operation is considered normal.
Capable to meet normal commitments. |
Satisfactory |
|
26-40 |
B |
Unfavourable & favourable factors
carry similar weight in credit consideration. Capability to overcome
financial difficulties seems comparatively below average/normal. |
Small |
|
11-25 |
Ca |
Adverse factors are apparent. Repayment of
interest and principal sums in default or expected to be in default upon
maturity |
Limited with full security |
|
<10 |
C |
Absolute credit risk exists. Caution
needed to be exercised |
Credit not recommended |
|
NR |
In view of the lack of information, we
have no basis upon which to recommend credit dealings |
No Rating |
|