
MIRA
INFORM REPORT
|
Report Date : |
6th
January, 2007 |
IDENTIFICATION
DETAILS
|
Name : |
BILTREC SA |
|
|
|
|
Registered Office : |
Calle
Atlantida, 21 08930 Sant Adria De Besos (Barcelona) |
|
|
|
|
Country : |
Spain |
|
|
|
|
Financials (as on) : |
31.12.2005 |
|
|
|
|
Date of Incorporation : |
11.03.1985 |
|
|
|
|
Legal Form : |
Joint Stock Company |
|
|
|
|
Line of Business : |
Wholesale of industrial chemical products. |
RATING & COMMENTS
|
MIRA’s Rating : |
Ba |
|
RATING |
STATUS |
PROPOSED CREDIT LINE |
|
|
41-55 |
Ba |
Overall operation is considered normal.
Capable to meet normal commitments. |
Satisfactory |
|
Status : |
Satisfactory |
|
|
|
|
Payment Behaviour : |
Regular |
|
|
|
|
Litigation : |
Clear |
Identification and
Characteristics
Tax Number A08970873
NAME BILTREC
SA
TRADE NAME BILTREC
FORMER NAME BILTRECSART
SA
BUSINESS ADDRESS CALLE
ATLANTIDA, 21
Postcode 08930
SANT ADRIA DE BESOS (BARCELONA)
FORMER ADDRESS CALLE
BOGATELL 43 49
Postcode 08930
SANT ADRIA DE BESOS (BARCELONA)
URL http://www.biltrec.com
TELEPHONE 934622910
FAX 933819004
LEGAL FORM JOINT
STOCK COMPANY
DATE FOUNDED 11/03/1985
CAPITAL 60.101,21 Euros
PAID-UP CAPITAL 60.101,21 Euros
NUMBER OF EMPLOYEES 8
BANKS BSCH.BADALONA;
B POPULAR.SANT ADRIA DE BESOS;
ACTIVITY 1616600 - Wholesale
of industrial chemical products
CNAE 5155 - Wholesale
of chemical products
EXPORT COMPANY YES
IMPORT COMPANY YES
Synthesis
FINANCIAL SITUATION
(Year ending: 31/12/2005)
![]()
PROFITABILITY ![]() 4/9 Nil
4/9 Nil
TREASURY ![]() 6/9 Average
6/9 Average
BALANCE SHEET ![]() 9/9 Excellent
9/9 Excellent
DEBT ![]() 4/9 Heavy
4/9 Heavy
INCIDENTS
![]()
COMMITMENTS ![]() 9/9 Respected
9/9 Respected
INCIDENTS ![]() 9/9 None
or Negligible
9/9 None
or Negligible
PREVIOUS EXPERIENCE
![]()
PREVIOUS EXPERIENCE ![]() 7/9 Normal
7/9 Normal
Credit Appraisal
CREDIT ACCORDING TO
OBJECTIVE DATA (From 0 to 500.000,00 Euros):
FAVOURABLE TOWARDS 65.510,32
Max. Euros
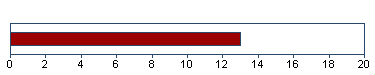
SOLVENCY RATING:
13/20 (BASED ON
HOMOGENEOUS FORMULATION)
Analysis made
on 06/12/2006
Financial Elements
Figures given in Euros
|
|
Balance sheet 2.003 (12) |
Balance sheet 2.004 (12) |
Balance sheet 2.005 (12) |
% Sales
|
|
SALES |
6.530.650,25 |
6.794.281,03 |
6.725.296,04 |
|
|
ADDED VALUE |
289.945,99 |
398.745,45 |
499.634,62 |
7,43 |
|
BUSINESS RESULT |
23.624,59 |
29.579,83 |
29.603,04 |
0,44 |
|
OWN FUNDS |
203.113,22 |
232.693,05 |
262.296,09 |
|
|
DEBT |
2.006.880,68 |
1.867.393,16 |
2.515.329,24 |
|
|
TOTAL ASSET |
2.209.993,90 |
2.100.086,21 |
2.777.625,33 |
|
The sales of
6.725.296,04 Euros show a change of -1,02%
compared with 2.004 . Between 2.003 and
2.004 , this change was 4,04% .
Added value grew by
25,30% compared with the previous year. Shareholders equity are
262.296,09 Euros for an indebtedness of 2.515.329,24
Euros .
The result
29.603,04 Euros means financial profitability of
11,29% and economic profitability of 1,07% . This result
means growth of 0,08% compared with the 2.004 .
THE FIGURES FOR THE
LAST BALANCE SHEET ARE RELEVANT:
SOURCE: FROM THE
MERCANTILE REGISTER
DATE: 23/10/2006
Comparative Sector Analysis
|
|
Company |
Sector |
Difference |
|
|
(2.005)
|
|
|
|
% of
PRODUCTION VALUE |
|
|
|
|
SALES |
98,72 |
99,35 |
-0,63 |
|
ADDED
VALUE |
7,33 |
15,73 |
-8,40 |
|
BUSINESS
RESULT |
0,43 |
2,83 |
-2,40 |
|
% OF TOTAL
ASSETS |
|
|
|
|
OWN
FUNDS |
9,44 |
36,86 |
-27,42 |
|
DEBT |
90,56 |
63,14 |
27,42 |
Compared sector (CNAE): 515 - Comercio al por
mayor de productos no agrarios semielaborados, chatarra y productos de desecho
Number of companies: 1.353
Size (Sales Figure): 2.800.000,00 -
7.000.000,00 Euros
The turnover of the company is
0,63% below the mean for the sector.
The company’s added value was
7,33% s/ the production value, and 8,40% below the mean for the
sector.
The company’s business result
was 0,43% of the PV, 2,40% below the mean for the sector.
The company’s own resources are
9,44% , 27,42% below the mean for the sector.
The company’s outside resources
are 90,56% , 27,42% above the mean for the sector.
Legal Actions
No legal incidences
registered for this company in the official source
No claims registered
for this company in the official sources
AFFECTED BY: No
significant elemento
Main Board members, Directors and
Auditor
|
Position |
Surname and name |
Date of appointment |
|
SOLE ADMINISTRATOR |
PLANAS CAPDEVILA JUAN |
18/01/2002 |
Financial Links
|
Shareholders |
||||
|
Company Name |
|
|
Source |
Information Date |
|
PLANAS CAPDEVILA JUAN |
|
100,00% |
OWN SOURCES |
10/02/2006 |
Proceedings published in the
B.O.R.M.E. (Official Mercantile Register Gazette)
|
Proceedings |
Date |
Notice Num. |
Mercantile Reg. |
|
Registration of accounts
(2005) |
04/10/2006 |
641564 |
BARCELONA |
|
Registration of accounts
(2004) |
04/10/2005 |
647175 |
BARCELONA |
|
Registration of accounts
(2003) |
26/10/2004 |
716206 |
BARCELONA |
|
Registration of accounts
(2002) |
02/10/2003 |
512789 |
BARCELONA |
|
Registration of accounts
(2001) |
23/09/2002 |
426311 |
BARCELONA |
Press articles
14/07/1999 GACETA NEG LEGAL ANNOUNCE
LA JUNTA GENERAL ORDINARIA
UNIVERSAL DEL DIA 30-6-99 ACORDO TRASLADAR EL DO MICILIO SOCIAL A LA C/
ATLANTIDA, N.21, PRIMERO 2, DE SANT ADRIA DEL BESOS.
Complementary Information
26/11/02 BLOQUE DE
INVESTIGACION:
- Realiza
transacciones intracomunitarias de sus compras y de sus ven-
tas.
- Importa de China,
Japon y EEUU.
- Exporta a Tunez y
Argelia.
----------------------------------------------------------------------
El Bloque de
Investigacion no esta sujeto a actualizaciones sistemati-
cas. Los datos
mostrados fueron aportados por las fuentes consultadas
en la fecha del
encabezamiento.
Brands, Signs and Commercial
Names
|
Prevailing
Brands |
|||||
|
Name: |
BILTREC |
||||
|
Kind of
Brand: |
JOINT |
File: |
M2286655 |
||
|
Request Date: |
28/01/2000 |
Bulletin
Date: |
Bulletin
Date: |
Current
situation: |
APPROVED
REGISTER |
|
Types: 1
|
|
||||
|
Prevailing
Commercial Names |
|||||
|
Name: |
BILTREC |
||||
|
Kind of
Brand: |
JOINT |
File: |
N224597 |
||
|
Request Date: |
28/01/2000 |
Bulletin
Date: |
Bulletin
Date: |
Current
situation: |
APPROVED
REGISTER |
|
|
|
||||
Total Marcas: 2
The information on the last
account contained in this report is extracted from the Mercantile Register file
of the legal address of the Company and dated 23/10/2006
Balance Sheet (ASSETS)
|
(Figures given in Euros)
|
31/12/2003 (12)
|
31/12/2004 (12)
|
31/12/2005 (12)
|
|
|
|
A) DUE FROM SHAREHOLDERS FOR
UNCALLED CAPITAL |
|
|
|
|
|
B) FIXED ASSETS |
79.502,62 |
69.605,75 |
62.274,00 |
|
|
I. Establishment expenses |
|
|
|
|
|
II. Intangible assets |
20.557,81 |
15.303,37 |
10.133,44 |
|
|
III. Tangible assets |
55.909,59 |
50.729,46 |
46.132,26 |
|
|
IV. Financial assets |
3.035,22 |
3.572,92 |
6.008,30 |
|
|
V. Owners equity |
|
|
|
|
|
VI. Long term trade
liabilities |
|
|
|
|
|
C) DEFERRED EXPENSES |
2.071,31 |
1.380,13 |
775,82 |
|
|
D) CURRENT ASSETS |
2.128.419,97 |
2.029.100,33 |
2.714.575,51 |
|
|
I. Not paid in shareholder
capital |
|
|
|
|
|
II. Inventory |
507.932,38 |
451.121,82 |
842.821,79 |
|
|
III. Debtors |
1.222.896,19 |
1.074.715,35 |
1.332.589,85 |
|
|
IV. Short term financial
assets |
103.764,43 |
104.938,50 |
125.613,47 |
|
|
V. Short term owners equity |
|
|
|
|
|
VI. Cash |
293.826,97 |
398.324,66 |
413.550,40 |
|
|
VII. Prepaid expenses and
accrued income |
|
|
|
|
|
ASSETS (A + B + C + D) |
2.209.993,90 |
2.100.086,21 |
2.777.625,33 |
Balance Sheet (LIABILITIES)
|
(Figures given in Euros)
|
31/12/2003 (12)
|
31/12/2004 (12)
|
31/12/2005 (12)
|
|
|
|
A) SHAREHOLDERS EQUITY |
203.113,22 |
232.693,05 |
262.296,09 |
|
|
I. Capital |
60.101,21 |
60.101,21 |
60.101,21 |
|
|
II. Premium share account |
|
|
|
|
|
III. Revaluation reserve |
|
|
|
|
|
IV. Reserves |
119.387,42 |
143.012,01 |
172.591,84 |
|
|
Sundry reserves |
119.387,42 |
143.012,01 |
172.591,84 |
|
|
V. Prior year earnings |
|
|
|
|
|
VI. Prior year profit or
losses |
23.624,59 |
29.579,83 |
29.603,04 |
|
|
VII. Dividend paid during the
year |
|
|
|
|
|
VIII. Own shares for change in
capital |
|
|
|
|
|
B) DEFERRED INCOME |
|
|
|
|
|
C) PROVISIONS FOR LIABILITIES
AND EXPENSES |
|
|
|
|
|
D) LONG TERM LIABILITIES |
15.826,08 |
11.869,56 |
7.855,20 |
|
|
E) SHORT TERM LIABILITIES |
1.991.054,60 |
1.855.523,60 |
2.507.474,04 |
|
|
F) SHORT TERM PROVISIONS FOR
LIABILITIES AND EXPENSES |
|
|
|
|
|
LIABILITIES (A + B + C + D + E
+ F) |
2.209.993,90 |
2.100.086,21 |
2.777.625,33 |
Profit and Loss Account
|
(Figures given in Euros)
|
31/12/2003 (12)
|
31/12/2004 (12)
|
31/12/2005 (12)
|
|
|
|
A) EXPENSES (A.1 a A.15) |
|
|
|
|
|
A.1 Operating Expenses |
5.864.862,02 |
5.794.846,49 |
5.695.760,04 |
|
|
A.3. Labor cost |
232.498,51 |
266.526,99 |
301.052,57 |
|
|
Wages |
167.931,66 |
192.040,94 |
217.046,13 |
|
|
Social security expenses |
64.566,85 |
74.486,05 |
84.006,44 |
|
|
A.3. Assets depreciation |
5.651,38 |
10.434,57 |
9.767,13 |
|
|
A.4. Variance in provision for
current assets |
|
|
1.840,44 |
|
|
A.5. Other operating costs |
681.218,95 |
711.681,92 |
617.170,26 |
|
|
A.I. OPERATING RESULT
(B.1-A.1-A.2-A.3-A.4-A.5) |
51.796,10 |
121.783,89 |
186.974,48 |
|
|
A.6. Financial expenses |
72.587,59 |
120.894,45 |
134.767,17 |
|
|
Other companies debts |
72.587,59 |
120.894,45 |
134.767,17 |
|
|
A.7. Variation in financial
investments provision |
|
|
|
|
|
A.8. Exchange losses |
8.813,88 |
24.866,56 |
74.043,57 |
|
|
A.II. POSITIVE FINANCIAL
RESULTS (B.2+B.3-A.6-A.7-A.8) |
|
|
|
|
|
A.III. PROFIT FROM ORDINARY
ACTIVITIES (A.I+A.II-B.I-B.II) |
41.874,97 |
|
41.782,35 |
|
|
A.9. Variation in provision in
fixed assets |
|
|
|
|
|
A.10. Losses in fixed assets |
|
|
|
|
|
A.11. Losses from shares and
bonds |
|
|
|
|
|
A.12. Extraordinary charges |
|
|
|
|
|
A.13. Prior year’s expenses
and losses |
|
|
|
|
|
A.IV. POSITIVE EXTRAORDINARY
RESULT (B.4+B.5+B.6+B.7+B.8-A.9-A.10-A.11-A.12-A.13) |
370,53 |
67.017,63 |
|
|
|
A.V. EARNINGS / LOSS BEFORE
TAXES (A.III+A.IV-B.III-B.IV) |
42.245,50 |
45.085,00 |
41.782,35 |
|
|
A.14. Corporate Taxes |
12.562,30 |
15.505,17 |
12.179,31 |
|
|
A.15. Other taxes |
6.058,61 |
|
|
|
|
A.VI. YEAR END RESULT (PROFIT)
(A.V-A.14-A.15) |
23.624,59 |
29.579,83 |
29.603,04 |
|
|
B) INCOMES (B.1 a B.8) |
|
|
|
|
|
B.1. Operating income |
6.836.026,96 |
6.905.273,86 |
6.812.564,92 |
|
|
Turnover |
6.530.650,25 |
6.794.281,03 |
6.725.296,04 |
|
|
Other operating income |
305.376,71 |
110.992,83 |
87.268,88 |
|
|
B.I. OPERATING LOSSES
(A.1+A.2+A.3+A.4+A.5-B.1) |
|
|
|
|
|
B.2. Financial Income |
963,99 |
2.044,49 |
3.842,14 |
|
|
Other |
963,99 |
2.044,49 |
3.612,76 |
|
|
Gains from investments |
|
|
229,38 |
|
|
B.3. Gains on exchange |
70.516,35 |
|
59.776,47 |
|
|
B.II. FINANCIAL LOSSES
(A.6+A.7+A.8-B.2-B.3) |
9.921,13 |
143.716,52 |
145.192,13 |
|
|
B.III. LOSSES FROM ORDINARY
ACTIVITIES (B.I+B.II-A.I-A.II) |
|
21.932,63 |
|
|
|
B.4. Gains from disposal of
fixed assets |
|
|
|
|
|
B.5. Gains from dealing in own
shares |
|
|
|
|
|
B.6. Paid in surplus |
|
|
|
|
|
B.7. Extraordinary income |
370,53 |
67.017,63 |
|
|
|
B.8. Prior year’s income and
profits |
|
|
|
|
|
B.IV. EXTRAORDINARY LOSSES
(A.9+A.10+A.11+A.12+A.13-B.4-B.5-B.6-B.7-B.8) |
|
|
|
|
|
B.V. LOSS BEFORE TAXES
(B.III+B.IV-A.III-A.IV) |
|
|
|
|
|
B.VI. NET LOSS (B.V+A.14+A.15) |
|
|
|
Main Ratios
|
(Figures given in Euros)
|
2.003 (12) |
2.004 (12) |
2.005 (12) |
|
|
|
ACTIVITY |
|
|
|
|
|
Increase of the Sales Figures |
1,49 |
4,04 |
-1,01 |
|
|
Assets Turnover |
2,96 |
3,24 |
2,42 |
|
|
Productivity |
1,25 |
1,50 |
1,66 |
|
|
Increase of the Added Value |
8,53 |
37,52 |
25,30 |
|
|
PROFITABILITY |
|
|
|
|
|
Economic Profitability |
1,07 |
1,41 |
1,07 |
|
|
Financial Profitability |
11,63 |
12,71 |
11,29 |
|
|
Financial Expenses |
1,11 |
1,78 |
2,00 |
|
|
BALANCE (IN DAYS OF SALES) |
|
|
|
|
|
Customers’ Credit (In days of
sales) |
67,00 |
57,00 |
71,00 |
|
|
Suppliers’ Credit (In days of
sales) |
|
|
|
|
|
Working Capital (In days of
sales) |
8,00 |
9,00 |
11,00 |
|
|
Working Capital Requirement
(In days of sales) |
0,00 |
0,00 |
0,00 |
|
|
Treasury (In days of sales) |
22,00 |
27,00 |
29,00 |
|
|
BALANCE |
|
|
|
|
|
Working Capital |
137.365,37 |
173.576,73 |
207.101,47 |
|
|
Working Capital Requirement |
-260.226,03 |
-329.686,43 |
-332.062,40 |
|
|
Treasury |
397.591,40 |
503.263,16 |
539.163,87 |
|
|
Balance Ratio |
2,68 |
3,45 |
4,29 |
|
|
SOLVENCY |
|
|
|
|
|
Borrowing Ratio |
90,81 |
88,92 |
90,56 |
|
|
Own / Permanent Funds |
92,77 |
95,15 |
97,09 |
|
|
Payback Capacity |
0,31 |
0,27 |
0,37 |
|
|
LIQUIDITY |
|
|
|
|
|
General Liquidity |
1,07 |
1,09 |
1,08 |
|
|
Immediate Liquidity |
0,20 |
0,27 |
0,22 |
Sectorial Analysis
Summary of Assets, Liability
& Equity
|
(Figures given in Percentages)
|
Company |
Sector |
Company |
|
|
2.005 |
|
|
|
Assets |
|||
|
DUE FROM
SHAREHOLDERS FOR UNCALLED CAPITAL |
0,00 |
0,16 |
-0,16 |
|
FIXED ASSETS |
2,24 |
26,46 |
-24,22 |
|
ACCRUED
EXPENSES |
0,03 |
0,38 |
-0,35 |
|
CURRENT
ASSETS |
97,73 |
72,99 |
24,74 |
|
TOTAL ASSETS |
100,00 |
100,00 |
0,00 |
|
Liabilities |
|||
|
SHAREHOLDERS
EQUITY |
9,44 |
36,86 |
-27,42 |
|
ACCRUED
INCOME |
0,00 |
0,27 |
-0,27 |
|
RISK AND
EXPENDITURE COVER |
0,00 |
0,11 |
-0,11 |
|
LONG-TERM
CREDITORS |
0,28 |
9,60 |
-9,32 |
|
SHORT-TERM
CREDITORS |
90,27 |
53,14 |
37,13 |
|
SHORT-TERM
RISK AND EXPENDITURE COVER |
0,00 |
0,02 |
-0,02 |
|
TOTAL
LIABILITIES |
100,00 |
100,00 |
0,00 |
Analytical Account of Results
|
(Figures given in Percentages)
|
Company |
Sector |
Company |
|
|
2.005 |
|
|
|
Net turnover |
98,72 |
99,35 |
-0,64 |
|
Other
operating income |
1,28 |
0,65 |
0,64 |
|
Production
Value |
100,00 |
100,00 |
0,00 |
|
Operating
expenses |
83,61 |
75,71 |
7,89 |
|
Other
operation expenses |
9,06 |
8,55 |
0,51 |
|
Added value |
7,33 |
15,73 |
-8,40 |
|
Labor cost |
4,42 |
9,25 |
-4,83 |
|
Gross
Economic Result |
2,91 |
6,48 |
-3,57 |
|
Assets
depreciation |
0,14 |
1,54 |
-1,40 |
|
Variation in
provision for current assets |
0,03 |
0,32 |
-0,29 |
|
Net Economic
Result |
2,74 |
4,62 |
-1,88 |
|
Financial
income |
0,93 |
0,36 |
0,57 |
|
Financial
expenses |
3,07 |
1,06 |
2,00 |
|
Variation in
financial investment provision |
0,00 |
-0,00 |
0,00 |
|
Ordinary
Activities Result |
0,61 |
3,92 |
-3,31 |
|
Extraordinary
income |
0,00 |
0,35 |
-0,35 |
|
Extraordinary
expenses |
0,00 |
0,18 |
-0,18 |
|
Variation in
provision in fixed assets |
0,00 |
-0,01 |
0,01 |
|
Results
before Taxes |
0,61 |
4,10 |
-3,49 |
|
Corporaye
taxes |
0,18 |
1,27 |
-1,09 |
|
Net Result |
0,43 |
2,83 |
-2,39 |
|
Assets
depreciation |
0,14 |
1,54 |
-1,40 |
|
Provisions
fund variation |
0,03 |
0,31 |
-0,29 |
|
Net
Self-Financing |
0,60 |
4,68 |
-4,08 |
Ratios
|
(Figures given in ) |
Company |
Ptile25 |
Medium |
Ptile75 |
|
|
2.005 |
|
|
|
|
ACTIVITY |
|
|
|
|
|
Increase of
the Sales Figures |
-1,02 |
-2,54 |
4,81 |
14,02 |
|
Assets
Turnover |
2,42 |
1,32 |
1,71 |
2,19 |
|
Fixed Assets
Turnover |
106,67 |
4,49 |
8,42 |
19,09 |
|
Increase of
the Added Value |
25,30 |
-5,50 |
4,97 |
16,49 |
|
PRODUCTIVITY |
|
|
|
|
|
Productivity |
1,66 |
1,40 |
1,64 |
2,04 |
|
Change of
Personnel Costs |
12,95 |
2,34 |
8,67 |
17,78 |
|
Average
Personnel Costs |
33.450,29 |
18.634,23 |
23.415,17 |
30.196,35 |
|
Value Added
by Employees |
55.514,96 |
30.556,31 |
40.196,12 |
55.735,89 |
|
CASH FLOW |
|
|
|
|
|
Cash Flow |
41.210,61 |
85.486,06 |
147.999,40 |
238.928,91 |
|
Operating
Cash Flow |
198.582,05 |
131.456,00 |
207.933,15 |
323.838,89 |
|
Change in
Cash Flow |
2,99 |
-19,19 |
3,62 |
23,20 |
|
PROFITABILITY |
|
|
|
|
|
Economic
Profitability |
1,07 |
1,53 |
3,38 |
6,57 |
|
Financial
Profitability |
11,29 |
6,07 |
11,23 |
17,87 |
|
Financial
Expenses |
2,00 |
0,33 |
0,75 |
1,44 |
|
Gross
Economic Profitability |
7,15 |
5,99 |
9,24 |
13,53 |
|
Gross
Financial Profitability |
75,71 |
19,09 |
30,60 |
47,04 |
|
BALANCE (IN DAYS OF SALES) |
|
|
|
|
|
Customers’
Credit (In days of sales) |
71,00 |
55,57 |
85,53 |
117,82 |
|
Suppliers’ Credit
(In days of sales) |
|
0,00 |
0,00 |
0,00 |
|
Working
Capital (In days of sales) |
11,00 |
11,30 |
35,54 |
73,21 |
|
Working
Capital Requirement (In days of sales) |
0,00 |
-7,36 |
18,90 |
51,19 |
|
Treasury (In
days of sales) |
28,00 |
3,52 |
12,39 |
32,65 |
|
Operating
Current Assets |
145,00 |
121,38 |
157,57 |
202,35 |
|
BALANCE |
|
|
|
|
|
Working
Capital |
207.101,47 |
126.312,60 |
378.173,88 |
789.961,18 |
|
Working
Capital Requirement |
-332.062,40 |
-74.165,12 |
195.291,60 |
541.398,97 |
|
Treasury |
539.163,87 |
36.733,58 |
132.800,87 |
356.377,23 |
|
Balance
Ratio |
4,28 |
1,23 |
1,89 |
3,68 |
|
SOLVENCY |
|
|
|
|
|
Borrowing
Ratio |
90,56 |
50,35 |
66,84 |
80,32 |
|
Own /
Permanent Funds |
97,09 |
67,97 |
89,88 |
99,66 |
|
Payback
Capacity |
0,37 |
0,24 |
0,34 |
0,49 |
|
Long term
Indebtedness |
0,28 |
0,07 |
3,58 |
12,12 |
|
Gearing |
1.058,97 |
201,40 |
301,54 |
508,20 |
|
Financing
Basic Ratio |
1,00 |
1,00 |
1,00 |
1,00 |
|
Assets
Guarantee |
1,10 |
1,21 |
1,46 |
1,95 |
|
LIQUIDITY |
|
|
|
|
|
General
Liquidity |
1,08 |
1,09 |
1,30 |
1,77 |
|
Immediate
Liquidity |
0,22 |
0,04 |
0,12 |
0,34 |
RATING EXPLANATIONS
|
RATING |
STATUS |
PROPOSED CREDIT LINE |
|
|
>86 |
Aaa |
Possesses an extremely sound financial
base with the strongest capability for timely payment of interest and
principal sums |
Unlimited |
|
71-85 |
Aa |
Possesses adequate working capital. No
caution needed for credit transaction. It has above average (strong)
capability for payment of interest and principal sums |
Large |
|
56-70 |
A |
Financial & operational base are
regarded healthy. General unfavourable factors will not cause fatal effect.
Satisfactory capability for payment of interest and principal sums |
Fairly Large |
|
41-55 |
Ba |
Overall operation is considered normal.
Capable to meet normal commitments. |
Satisfactory |
|
26-40 |
B |
Unfavourable & favourable factors
carry similar weight in credit consideration. Capability to overcome
financial difficulties seems comparatively below average/normal. |
Small |
|
11-25 |
Ca |
Adverse factors are apparent. Repayment of
interest and principal sums in default or expected to be in default upon
maturity |
Limited with full security |
|
<10 |
C |
Absolute credit risk exists. Caution
needed to be exercised |
Credit not recommended |
|
NR |
In view of the lack of information, we
have no basis upon which to recommend credit dealings |
No Rating |
|