
MIRA
INFORM REPORT
|
Report Date : |
12.01.2007 |
IDENTIFICATION
DETAILS
|
Name : |
MASIAS
MAQUINARIA SA |
|
|
|
|
Registered Office : |
Calle
Major De Santa Magdalena, 1, 17857 Sant Joan Les Fonts
(Gerona) |
|
|
|
|
Country : |
Spain |
|
|
|
|
Financials (as on) : |
31.12.2005 |
|
|
|
|
Date of Incorporation : |
13/05/1996 |
|
|
|
|
Legal Form : |
Joint
Stock Company |
|
|
|
|
Line of Business : |
Wholesale
of textile machinery |
RATING & COMMENTS
|
MIRA’s Rating : |
Aa |
|
RATING |
STATUS |
PROPOSED CREDIT LINE |
|
|
71-85 |
Aa |
Possesses adequate working capital. No caution
needed for credit transaction. It has above average (strong) capability for
payment of interest and principal sums |
Large |
|
Status : |
Good |
|
|
|
|
Payment Behaviour : |
Regular |
|
|
|
|
Litigation : |
Clear |
Identification and
Characteristics
|
Tax Number |
A17479809 |
|
NAME |
MASIAS MAQUINARIA SA |
|
BUSINESS
ADDRESS |
CALLE MAJOR DE SANTA
MAGDALENA, 1 |
|
Postcode |
17857 SANT JOAN LES FONTS
(GERONA) |
|
URL |
http://www.masias.com |
|
TELEPHONE |
972293150 |
|
FAX |
972293151 |
|
LEGAL FORM |
JOINT STOCK COMPANY |
|
DATE FOUNDED |
13/05/1996 |
|
CAPITAL |
60.110,00 Euros |
|
PAID-UP CAPITAL |
60.110,00 Euros |
|
NUMBER OF
EMPLOYEES |
8 |
|
ACTIVITY |
1617700 - Wholesale of textile
machinery |
|
CNAE |
5163 - Wholesale of machinery
for the textile industry and of sewing and knitting machines |
|
EXPORT COMPANY |
YES |
|
* Characteristics of the main address |
|
|
According to our investigations
dated 27/09/2004 it is a/an office property shared
premises and it is located in an area main Clarifications: Domicilio Social empresas relacionadas |
|
Synthesis
|
FINANCIAL SITUATION (Year
ending: 31/12/2005) |
||
|
|
|
|
|
PROFITABILITY |
|
5/9 Medium |
|
TREASURY |
|
9/9 Excellent |
|
BALANCE SHEET |
|
9/9 Excellent |
|
DEBT |
|
7/9 Low |
|
INCIDENTS |
||
|
|
|
|
|
COMMITMENTS |
|
9/9 Respected |
|
INCIDENTS |
|
9/9 None
or Negligible |
|
PREVIOUS EXPERIENCE |
||
|
|
|
|
|
PREVIOUS
EXPERIENCE |
|
8/9 Favourable |
Credit Appraisal
|
CREDIT ACCORDING TO OBJECTIVE DATA (From 0
to 6.000.000,00 Euros): |
|
FAVOURABLE TOWARDS 194.126,91
Max. Euros |
|
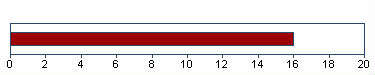
SOLVENCY RATING: |
|
16/20 (BASED ON HOMOGENEOUS
FORMULATION) |
|
|
|
Analysis made on 04/01/2007 |
Financial Elements
Figures given in
Euros
|
|
Balance
sheet 2.003 (12) |
Balance sheet 2.004
(12) |
Balance sheet 2.005
(12) |
% Sales |
|
|
SALES |
7.180.294,18 |
7.760.585,57 |
6.064.098,78 |
|
|
|
ADDED VALUE |
838.063,70 |
441.626,55 |
351.322,19 |
5,79 |
|
|
BUSINESS RESULT |
323.394,10 |
107.426,45 |
140.897,22 |
2,32 |
|
|
OWN FUNDS |
1.708.021,75 |
1.813.043,80 |
1.951.536,63 |
|
|
|
DEBT |
2.154.525,08 |
2.093.057,98 |
1.481.504,51 |
|
|
|
TOTAL ASSET |
3.862.546,83 |
3.906.101,78 |
3.433.041,14 |
|
|
|
The sales of 6.064.098,78
Euros show a change of -21,86% compared with
2.004 . Between 2.003 and 2.004 , this
change was 8,08% . |
|||||
|
Added value grew by -20,45%
compared with the previous year. Shareholders equity are 1.951.536,63
Euros for an indebtedness of 1.481.504,51 Euros
. |
|||||
|
The result 140.897,22
Euros means financial profitability of 7,22% and
economic profitability of 4,10% . This result means growth of
31,16% compared with the 2.004 . |
|||||
|
|
|||||
|
THE FIGURES FOR THE LAST BALANCE SHEET ARE
RELEVANT: |
|||||
|
SOURCE: FROM THE MERCANTILE REGISTER |
|||||
|
DATE: 28/12/2006 |
|||||
|
|
|
||||
|
Results Distribution |
|||||
|
Annual Report Year Source: 2.005 |
|||||
|
Figures given in Euros |
|||||
|
Distribution Base |
|||||
|
Profit and Loss |
140.897 |
||||
|
Total of Amounts to be
distributed |
140.897 |
||||
|
Distribution a |
|||||
|
Voluntary Reserve |
140.897 |
||||
|
|
|||||
|
Auditors’ opinion: |
|||||
|
FAVOURABLE (2.005) |
|||||
|
|
|||||
|
Auditors: |
|||||
|
AUDITORIA I CONTROL AUDITORS S.L. |
|||||
Comparative Sector
Analysis
|
|
Company |
Sector |
Difference |
|
|
(2.005) |
|
|
|
% of PRODUCTION VALUE |
|
|
|
|
SALES |
99,28 |
99,01 |
0,27 |
|
ADDED
VALUE |
5,75 |
19,90 |
-14,15 |
|
BUSINESS
RESULT |
2,31 |
3,29 |
-0,98 |
|
% OF TOTAL ASSETS |
|
|
|
|
OWN
FUNDS |
56,85 |
42,53 |
14,32 |
|
DEBT |
43,15 |
57,47 |
-14,32 |
Compared sector (CNAE): 516 - Comercio al por mayor de
maquinaria y equipo
Number of companies: 636
Size (Sales Figure): 2.800.000,00 - 7.000.000,00 Euros
The turnover of the company is 0,27%
above the mean for the sector.
The company’s added value was 5,75% s/
the production value, and 14,15% below the mean for the sector.
The company’s business result was
2,31% of the PV, 0,98% below the mean for the sector.
The company’s own resources are 56,85%
, 14,32% above the mean for the sector.
The company’s outside resources are
43,15% , 14,32% below the mean for the sector.
Legal Actions
No legal incidences registered for this
company in the official source
No claims registered for this company in the
official sources
AFFECTED BY: No significant elemento
Main Board members,
Directors and Auditor
|
Position |
Surname and name |
Date of appointment |
|
CHAIRMAN |
MASIAS PADROSA LUIS |
05/07/2006 |
|
BOARD MEMBER |
MASIAS TRIAS JORGE |
05/07/2006 |
|
BOARD MEMBER |
MASIAS PADROSA LLUIS |
05/07/2006 |
|
BOARD MEMBER |
ESMERAGDO MASIAS PADROSA |
05/07/2006 |
|
BOARD MEMBER |
MASIAS INVEST S L |
05/07/2006 |
|
AUDITOR |
AUDITORIA I CONTROL AUDITORS S L |
10/01/2003 |
Functional Managers
|
Position |
Surname and name |
Date of appointment |
|
FINANCIAL MANAGER |
MASIAS JAIME |
27/09/2004 |
|
MANAGER |
MASIAS PADROSA LUIS |
26/04/2006 |
Financial Links
|
Shareholders |
||||
|
Company Name |
CIF/Country |
|
Source |
Information Date |
|
MASIAS INVEST S.L. |
B17148883 |
99,90% |
OWN SOURCES |
27/04/2006 |
|
MASIAS PADROSA LUIS |
|
Indet. |
OWN SOURCES |
13/12/1996 |
|
MASIAS PADROSA JAIME |
|
Indet. |
OWN SOURCES |
13/12/1996 |
|
MASIAS TRIAS JORGE |
|
Indet. |
OWN SOURCES |
13/12/1996 |
|
MASIAS PADROSA ESMERANDO |
|
Indet. |
OWN SOURCES |
13/12/1996 |
|
Shareholdings |
||||
|
Company Name |
CIF/Country |
Percent. |
Source |
Information Date |
|
MASLAT SA CV |
MÉXICO |
98,00% |
M.REGISTER |
31/12/2005 |
|
INSTAL.LACIONS GESTIO FORMACIO I
ASSESORAMENT S.A. |
A17442260 |
33,33% |
M.REGISTER |
31/12/1998 |
|
HORSTMANN FORDBRTECHNIK GMBH & CO
KG-W.T.T. WASTE TREATMENT TECHNOLOGIES B.V. MASIAS MAQUINARIA SA. UTE LEY
18/1982 |
G17546805 |
20,00% |
M.REGISTER |
31/12/2005 |
|
UTE HORSTMANN WTT MASIAS II |
G17620972 |
11,40% |
M.REGISTER |
31/12/2005 |
Proceedings published
in the B.O.R.M.E. (Official Mercantile Register Gazette)
|
Proceedings |
Date |
Notice Num. |
Mercantile Reg. |
|
Registration of accounts (2005)
|
28/12/2006 |
051342 |
GERONA |
|
Appointments |
05/07/2006 |
348389 |
GERONA |
|
Re-elections |
05/07/2006 |
348389 |
GERONA |
|
Registration of accounts
(2004) |
08/09/2005 |
354818 |
GERONA |
|
Registration of accounts
(2003) |
27/08/2004 |
270990 |
GERONA |
Bank Entities
|
Entity |
Branch |
Branch Address |
Town |
Province |
|
BANCO DE SABADELL, S.A. |
0111 |
PS BLAY 000006 |
OLOT |
GERONA |
|
BANCO POPULAR ESPAÑOL, S.A. |
0053 |
OBISPO LORENZANA, 8 |
OLOT |
GERONA |
|
BANCO DE SABADELL, S.A. |
|
|
SANT JOAN LES FONTS |
|
|
BANCO POPULAR ESPAÑOL, S.A. |
0618 |
CTRA. DE OLOT, 51 |
SANT JOAN LES FONTS |
GERONA |
The information on the last account
contained in this report is extracted from the Mercantile Register file of the
legal address of the Company and dated 28/12/2006
Balance Sheet
(ASSETS)
|
(Figures given in Euros) |
31/12/2003 (12) |
31/12/2004 (12) |
31/12/2005 (12) |
|
|
|
A) DUE FROM SHAREHOLDERS FOR UNCALLED
CAPITAL |
|
|
|
|
|
B) FIXED ASSETS |
77.150,48 |
75.789,39 |
44.358,74 |
|
|
I. Establishment expenses |
|
|
|
|
|
II. Intangible assets |
|
|
|
|
|
III. Tangible assets |
70.503,31 |
69.142,22 |
44.358,74 |
|
|
Other property plant and equipement |
10.845,54 |
10.845,54 |
10.845,54 |
|
|
Other assets |
139.447,80 |
162.794,47 |
162.794,47 |
|
|
Depreciation |
-79.790,03 |
-104.497,79 |
-129.281,27 |
|
|
IV. Financial assets |
6.647,17 |
6.647,17 |
|
|
|
Shares in affiliated companies |
6.647,17 |
6.647,17 |
6.647,17 |
|
|
Provisions |
|
|
-6.647,17 |
|
|
V. Owners equity |
|
|
|
|
|
VI. Long term trade liabilities |
|
|
|
|
|
C) DEFERRED EXPENSES |
|
|
|
|
|
D) CURRENT ASSETS |
3.785.396,35 |
3.830.312,39 |
3.388.682,40 |
|
|
I. Not paid in shareholder capital |
|
|
|
|
|
II. Inventory |
|
|
|
|
|
III. Debtors |
1.357.629,64 |
781.944,73 |
841.524,86 |
|
|
Clients |
1.188.068,86 |
733.041,78 |
804.987,84 |
|
|
Other debts |
17.054,27 |
|
|
|
|
Taxes refunds |
165.549,48 |
49.883,95 |
67.550,11 |
|
|
Provisions |
-13.042,97 |
-981,00 |
-31.013,09 |
|
|
IV. Short term financial assets |
1.618.325,61 |
2.195.333,97 |
1.900.000,00 |
|
|
Short term investment |
1.408.274,99 |
2.015.333,97 |
|
|
|
Other loans |
210.050,62 |
180.000,00 |
1.900.000,00 |
|
|
V. Short term owners equity |
|
|
|
|
|
VI. Cash |
783.520,43 |
836.384,80 |
620.169,22 |
|
|
VII. Prepaid expenses and accrued income |
25.920,67 |
16.648,89 |
26.988,32 |
|
|
ASSETS (A + B + C + D) |
3.862.546,83 |
3.906.101,78 |
3.433.041,14 |
Balance Sheet
(LIABILITIES)
|
(Figures given in Euros) |
31/12/2003 (12) |
31/12/2004 (12) |
31/12/2005 (12) |
|
|
|
A) SHAREHOLDERS EQUITY |
1.708.021,75 |
1.813.043,80 |
1.951.536,63 |
|
|
I. Capital |
60.110,00 |
60.110,00 |
60.110,00 |
|
|
II. Premium share account |
|
|
|
|
|
III. Revaluation reserve |
|
|
|
|
|
IV. Reserves |
1.324.517,65 |
1.645.507,35 |
1.750.529,41 |
|
|
Retained earnings |
12.022,00 |
12.022,00 |
12.022,00 |
|
|
Other funds |
1.312.495,65 |
1.633.485,35 |
1.738.507,41 |
|
|
V. Prior year earnings |
|
|
|
|
|
VI. Prior year profit or losses |
323.394,10 |
107.426,45 |
140.897,22 |
|
|
VII. Dividend paid during the year |
|
|
|
|
|
VIII. Own shares for change in capital |
|
|
|
|
|
B) DEFERRED INCOME |
|
|
|
|
|
C) PROVISIONS FOR LIABILITIES AND EXPENSES |
|
|
|
|
|
D) LONG TERM LIABILITIES |
|
|
|
|
|
I. Bonds |
|
|
|
|
|
II. Bank loans |
|
|
|
|
|
III. Debts with associed and affiliated
companies |
|
|
|
|
|
IV. Other creditors |
|
|
|
|
|
V. Deferred debts on shares |
|
|
|
|
|
VI. Long term debt with creditor |
|
|
|
|
|
E) SHORT TERM LIABILITIES |
2.154.525,08 |
2.093.057,98 |
1.481.504,51 |
|
|
I. Negotiable bonds |
|
|
|
|
|
II. Bank loans |
|
|
|
|
|
III. Short term debts with associated and
affiliated companies |
70.853,97 |
67.188,68 |
46.774,49 |
|
|
With affiliated companies |
70.853,97 |
67.188,68 |
46.774,49 |
|
|
IV. Trade creditors |
1.854.417,25 |
1.924.267,62 |
1.337.615,07 |
|
|
Accounts payable |
565.954,55 |
235.269,36 |
647.110,01 |
|
|
Expenses |
1.288.462,70 |
1.688.998,26 |
690.505,06 |
|
|
V. Other non trade payables |
152.253,86 |
53.351,68 |
57.114,95 |
|
|
Government |
119.914,45 |
42.609,03 |
43.025,23 |
|
|
Accounts receivable |
32.339,41 |
10.742,65 |
14.089,72 |
|
|
VI. Provisions for current assets |
77.000,00 |
48.250,00 |
40.000,00 |
|
|
VII. Accruals and deferred incomes |
|
|
|
|
|
F) SHORT TERM PROVISIONS FOR LIABILITIES
AND EXPENSES |
|
|
|
|
|
LIABILITIES (A + B + C + D + E + F) |
3.862.546,83 |
3.906.101,78 |
3.433.041,14 |
Profit and Loss
Account
|
(Figures given in Euros) |
31/12/2003 (12) |
31/12/2004 (12) |
31/12/2005 (12) |
|
|
|
A) EXPENSES (A.1 a A.16) |
|
|
|
|
|
A.1. Change in stocks of finished goods
and work in progress |
|
|
|
|
|
A.2. Supplies |
5.594.688,07 |
6.691.724,64 |
4.970.077,26 |
|
|
Material consumed |
5.592.427,74 |
6.638.684,05 |
4.856.086,70 |
|
|
Raw materials consumed |
|
3.274,31 |
62.023,86 |
|
|
Other expenses |
2.260,33 |
49.766,28 |
51.966,70 |
|
|
A.3. Labor cost |
343.396,80 |
341.880,11 |
332.703,71 |
|
|
Wages |
290.943,33 |
287.324,28 |
281.399,81 |
|
|
Social security expenses |
52.453,47 |
54.555,83 |
51.303,90 |
|
|
A.4. Assets depreciation |
23.442,00 |
24.707,76 |
24.783,48 |
|
|
A.5 Variance in provision for current
assets |
20.950,04 |
-27.769,00 |
36.679,26 |
|
|
Variance in provision for bad debts |
13.042,97 |
981,00 |
9.415,19 |
|
|
Variance in provision for other current
assets |
7.907,07 |
-28.750,00 |
27.264,07 |
|
|
A.6. Other operating costs |
766.167,23 |
656.759,07 |
786.764,14 |
|
|
External costs |
763.769,52 |
654.802,68 |
784.501,97 |
|
|
Taxes |
2.397,71 |
1.956,39 |
2.262,17 |
|
|
A.I. OPERATING RESULT
(B.1+B.2+B.3+B.4-A.1-A.2-A.3-A.4-A.5-A.6) |
450.274,86 |
102.807,68 |
|
|
|
A.7. Financial expenses |
10.031,88 |
35.566,48 |
11.685,38 |
|
|
Other companies debts |
10.031,88 |
35.566,48 |
11.685,38 |
|
|
A.8. Variation in financial investments
provision |
|
|
|
|
|
A.9. Exchange losses |
79.671,46 |
26.646,64 |
|
|
|
A.II. POSITIVE FINANCIAL RESULTS
(B.5+B.6+B.7+B.8-A.7-A.8-A.9) |
|
|
193.344,43 |
|
|
A.III. PROFIT FROM ORDINARY ACTIVITIES
(A.I+A.II-B.I-B.II) |
420.476,67 |
86.836,69 |
150.500,17 |
|
|
A.10. Variation in provision in fixed
assets |
|
|
|
|
|
A.11. Losses in fixed assets |
|
|
|
|
|
A.12. Losses from shares and bonds |
|
|
|
|
|
A.13. Extraordinary charges |
8.262,40 |
|
|
|
|
A.14. Prior year’s expenses and losses |
|
|
|
|
|
A.IV. POSITIVE EXTRAORDINARY RESULT
(B.9+B.10+B.11+B.12+B.13-A.10-A.11-A.12-A.13-A.14) |
|
48.820,11 |
30.050,61 |
|
|
A.V. EARNINGS / LOSS BEFORE TAXES
(A.III+A.IV-B.III-B.IV) |
418.267,92 |
135.656,80 |
180.550,78 |
|
|
A.15. Corporate Taxes |
94.873,82 |
28.230,35 |
39.653,56 |
|
|
A.16. Other taxes |
|
|
|
|
|
A.VI. YEAR END RESULT (PROFIT)
(A.V-A.15-A.16) |
323.394,10 |
107.426,45 |
140.897,22 |
|
|
B) INCOMES (B.1 a B13) |
|
|
|
|
|
B.1. Turnover |
7.180.294,18 |
7.760.585,57 |
6.064.098,78 |
|
|
Sales |
7.180.294,18 |
7.760.585,57 |
6.064.098,78 |
|
|
B.2. Increase in inventory of finished goods |
|
|
|
|
|
B.3. Expenses capitalized |
|
|
|
|
|
B.4. Other operating income |
18.624,82 |
29.524,69 |
44.064,81 |
|
|
Grants |
18.624,82 |
29.524,69 |
44.064,81 |
|
|
B.I. OPERATING LOSSES
(A.1+A.2+A.3+A.4+A.5+A.6-B.1-B.2-B.3-B.4) |
|
|
42.844,26 |
|
|
B.5. Incomes from share |
|
|
|
|
|
B.6. Income from securities |
|
|
|
|
|
B.7. Other income from interrest |
59.538,52 |
45.268,93 |
63.231,42 |
|
|
From other companies |
59.538,52 |
45.268,93 |
63.231,42 |
|
|
B.8. Gains on exchange |
366,63 |
973,20 |
141.798,39 |
|
|
B.II. FINANCIAL LOSSES
(A.7+A.8+A.9-B.5-B.6-B.7-B.8) |
29.798,19 |
15.970,99 |
|
|
|
B.III. LOSSES FROM ORDINARY ACTIVITIES
(B.I+B.II-A.I-A.II) |
|
|
|
|
|
B.9. Gains from disposal of fixed assets |
1.913,80 |
|
|
|
|
B.10. Gains from dealing in own shares |
|
|
|
|
|
B.11. Paid in surplus |
|
|
|
|
|
B.12. Extraordinary income |
|
8.769,50 |
|
|
|
B.13. Prior year’s income and profits |
4.139,85 |
40.050,61 |
30.050,61 |
|
|
B.IV. EXTRAORDINARY LOSSES
(A.10+A.11+A.12+A.13+A.14-B.9-B.10-B.11-B.12-B.13) |
2.208,75 |
|
|
|
|
B.V. LOSS BEFORE TAXES
(B.III+B.IV-A.III-A.IV) |
|
|
|
|
|
B.VI. NET LOSS (B.V+A.15+A.16) |
|
|
|
Main Ratios
|
(Figures given in Euros) |
2.003 (12) |
2.004 (12) |
2.005 (12) |
|
|
|
ACTIVITY |
|
|
|
|
|
Increase of the Sales Figures |
-4,72 |
8,08 |
-21,86 |
|
|
Assets Turnover |
1,86 |
1,99 |
1,77 |
|
|
Productivity |
2,44 |
1,29 |
1,06 |
|
|
Increase of the Added Value |
24,09 |
-47,30 |
-20,45 |
|
|
PROFITABILITY |
|
|
|
|
|
Economic Profitability |
8,37 |
2,75 |
4,10 |
|
|
Financial Profitability |
18,93 |
5,93 |
7,22 |
|
|
Financial Expenses |
0,14 |
0,46 |
0,19 |
|
|
BALANCE (IN DAYS OF SALES) |
|
|
|
|
|
Customers’ Credit (In days of sales) |
68,00 |
36,00 |
50,00 |
|
|
Suppliers’ Credit (In days of sales) |
119,00 |
104,00 |
97,00 |
|
|
Working Capital (In days of sales) |
82,00 |
81,00 |
113,00 |
|
|
Working Capital Requirement (In days of
sales) |
0,00 |
0,00 |
0,00 |
|
|
Treasury (In days of sales) |
120,00 |
141,00 |
150,00 |
|
|
BALANCE |
|
|
|
|
|
Working Capital |
1.630.871,27 |
1.737.254,41 |
1.907.177,89 |
|
|
Working Capital Requirement |
-770.974,77 |
-1.294.464,36 |
-612.991,33 |
|
|
Treasury |
2.401.846,04 |
3.031.718,77 |
2.520.169,22 |
|
|
Balance Ratio |
22,14 |
23,92 |
43,99 |
|
|
SOLVENCY |
|
|
|
|
|
Borrowing Ratio |
55,78 |
53,58 |
43,15 |
|
|
Own / Permanent Funds |
100,00 |
100,00 |
100,00 |
|
|
Payback Capacity |
0,30 |
0,27 |
0,24 |
|
|
LIQUIDITY |
|
|
|
|
|
General Liquidity |
1,76 |
1,83 |
2,29 |
|
|
Immediate Liquidity |
1,12 |
1,45 |
1,70 |
Sectorial Analysis
Summary of Assets, Liability & Equity
|
(Figures given in Percentages) |
Company |
Sector |
Company |
|
|
2.005 |
|
|
|
Assets |
|||
|
DUE FROM SHAREHOLDERS
FOR UNCALLED CAPITAL |
0,00 |
0,03 |
-0,03 |
|
FIXED ASSETS |
1,29 |
22,33 |
-21,04 |
|
ACCRUED EXPENSES |
0,00 |
0,40 |
-0,40 |
|
CURRENT ASSETS |
98,71 |
77,24 |
21,47 |
|
TOTAL ASSETS |
100,00 |
100,00 |
0,00 |
|
Liabilities |
|||
|
SHAREHOLDERS EQUITY |
56,85 |
42,53 |
14,32 |
|
ACCRUED INCOME |
0,00 |
0,13 |
-0,13 |
|
RISK AND EXPENDITURE
COVER |
0,00 |
0,11 |
-0,11 |
|
LONG-TERM CREDITORS |
0,00 |
6,26 |
-6,26 |
|
SHORT-TERM CREDITORS |
43,15 |
50,95 |
-7,80 |
|
SHORT-TERM RISK AND
EXPENDITURE COVER |
0,00 |
0,01 |
-0,01 |
|
TOTAL LIABILITIES |
100,00 |
100,00 |
0,00 |
Analytical Account of Results
|
(Figures given in Percentages) |
Company |
Sector |
Company |
|
|
2.005 |
|
|
|
Net turnover |
99,28 |
99,01 |
0,27 |
|
Other operating income |
0,72 |
0,99 |
-0,27 |
|
Production Value |
100,00 |
100,00 |
0,00 |
|
Operating expenses |
81,37 |
70,77 |
10,59 |
|
Other operation expenses |
12,88 |
9,33 |
3,55 |
|
Added value |
5,75 |
19,90 |
-14,15 |
|
Labor cost |
5,45 |
12,94 |
-7,50 |
|
Gross Economic Result |
0,30 |
6,96 |
-6,65 |
|
Assets depreciation |
0,41 |
1,48 |
-1,07 |
|
Variation in provision
for current assets |
0,60 |
0,29 |
0,31 |
|
Net Economic Result |
-0,70 |
5,19 |
-5,89 |
|
Financial income |
3,36 |
0,46 |
2,90 |
|
Financial expenses |
0,19 |
0,94 |
-0,75 |
|
Variation in financial
investment provision |
0,00 |
0,01 |
-0,01 |
|
Ordinary Activities
Result |
2,46 |
4,70 |
-2,24 |
|
Extraordinary income |
0,49 |
0,38 |
0,11 |
|
Extraordinary expenses |
0,00 |
0,25 |
-0,25 |
|
Variation in provision
in fixed assets |
0,00 |
0,03 |
-0,03 |
|
Results before Taxes |
2,96 |
4,81 |
-1,85 |
|
Corporaye taxes |
0,65 |
1,52 |
-0,87 |
|
Net Result |
2,31 |
3,29 |
-0,98 |
|
Assets depreciation |
0,41 |
1,48 |
-1,07 |
|
Provisions fund
variation |
0,60 |
0,32 |
0,28 |
|
Net Self-Financing |
3,31 |
5,09 |
-1,78 |
Ratios
|
(Figures given in ) |
Company |
Ptile25 |
Medium |
Ptile75 |
|
|
2.005 |
|
|
|
|
ACTIVITY |
|
|
|
|
|
Increase of the Sales
Figures |
-21,86 |
-6,58 |
3,95 |
14,02 |
|
Assets Turnover |
1,77 |
1,25 |
1,65 |
2,09 |
|
Fixed Assets Turnover |
136,71 |
5,38 |
11,02 |
26,42 |
|
Increase of the Added
Value |
-20,45 |
-6,36 |
4,56 |
14,65 |
|
PRODUCTIVITY |
|
|
|
|
|
Productivity |
1,06 |
1,27 |
1,47 |
1,84 |
|
Change of Personnel
Costs |
-2,68 |
1,17 |
8,35 |
17,09 |
|
Average Personnel Costs |
47.529,10 |
21.854,27 |
28.323,90 |
36.201,90 |
|
Value Added by Employees |
50.188,88 |
33.033,01 |
43.178,27 |
61.981,28 |
|
CASH FLOW |
|
|
|
|
|
Cash Flow |
202.359,96 |
74.332,06 |
143.779,61 |
260.164,24 |
|
Operating Cash Flow |
18.618,48 |
112.376,37 |
196.265,89 |
341.813,93 |
|
Change in Cash Flow |
93,90 |
-22,66 |
-1,27 |
19,32 |
|
PROFITABILITY |
|
|
|
|
|
Economic Profitability |
4,10 |
1,67 |
3,88 |
7,20 |
|
Financial Profitability |
7,22 |
5,90 |
11,77 |
18,92 |
|
Financial Expenses |
0,19 |
0,21 |
0,60 |
1,25 |
|
Gross Economic
Profitability |
0,54 |
5,49 |
8,76 |
14,45 |
|
Gross Financial
Profitability |
0,95 |
16,20 |
27,31 |
43,35 |
|
BALANCE (IN DAYS OF SALES) |
|
|
|
|
|
Customers’ Credit (In
days of sales) |
49,00 |
61,05 |
94,76 |
127,94 |
|
Suppliers’ Credit (In
days of sales) |
96,00 |
0,00 |
0,00 |
0,00 |
|
Working Capital (In days
of sales) |
113,00 |
18,45 |
47,52 |
89,51 |
|
Working Capital
Requirement (In days of sales) |
0,00 |
-2,03 |
24,47 |
60,52 |
|
Treasury (In days of
sales) |
149,00 |
6,56 |
18,25 |
44,93 |
|
Operating Current Assets |
201,00 |
134,15 |
173,14 |
223,97 |
|
BALANCE |
|
|
|
|
|
Working Capital |
1.907.177,89 |
184.200,52 |
486.810,53 |
926.377,60 |
|
Working Capital
Requirement |
-612.991,33 |
-19.306,05 |
237.579,02 |
631.678,21 |
|
Treasury |
2.520.169,22 |
62.302,80 |
189.138,29 |
460.693,76 |
|
Balance Ratio |
43,99 |
1,42 |
2,63 |
5,83 |
|
SOLVENCY |
|
|
|
|
|
Borrowing Ratio |
43,15 |
45,36 |
62,82 |
79,35 |
|
Own / Permanent Funds |
100,00 |
74,71 |
94,88 |
100,00 |
|
Payback Capacity |
0,24 |
0,24 |
0,34 |
0,47 |
|
Long term Indebtedness |
|
0,00 |
1,91 |
9,36 |
|
Gearing |
175,92 |
183,00 |
268,99 |
484,18 |
|
Financing Basic Ratio |
1,00 |
1,00 |
1,00 |
1,00 |
|
Assets Guarantee |
2,32 |
1,22 |
1,52 |
2,13 |
|
LIQUIDITY |
|
|
|
|
|
General Liquidity |
2,29 |
1,14 |
1,43 |
1,89 |
|
Immediate Liquidity |
1,70 |
0,06 |
0,17 |
0,47 |
RATING EXPLANATIONS
|
RATING |
STATUS |
PROPOSED CREDIT LINE |
|
|
>86 |
Aaa |
Possesses an extremely sound financial
base with the strongest capability for timely payment of interest and
principal sums |
Unlimited |
|
71-85 |
Aa |
Possesses adequate working capital. No
caution needed for credit transaction. It has above average (strong)
capability for payment of interest and principal sums |
Large |
|
56-70 |
A |
Financial & operational base are
regarded healthy. General unfavourable factors will not cause fatal effect.
Satisfactory capability for payment of interest and principal sums |
Fairly Large |
|
41-55 |
Ba |
Overall operation is considered normal.
Capable to meet normal commitments. |
Satisfactory |
|
26-40 |
B |
Unfavourable & favourable factors
carry similar weight in credit consideration. Capability to overcome
financial difficulties seems comparatively below average/normal. |
Small |
|
11-25 |
Ca |
Adverse factors are apparent. Repayment of
interest and principal sums in default or expected to be in default upon
maturity |
Limited with full security |
|
<10 |
C |
Absolute credit risk exists. Caution
needed to be exercised |
Credit not recommended |
|
NR |
In view of the lack of information, we
have no basis upon which to recommend credit dealings |
No Rating |
|