
MIRA
INFORM REPORT
|
Report Date : |
15.01.2007 |
IDENTIFICATION DETAILS
|
Name : |
FERTILIZANTES
QUIMICOS SA |
|
|
|
|
Registered Office : |
Calle
Gonzalo De Cordoba - Ed Oporto, 2, 28010 |
|
|
|
|
Country : |
|
|
|
|
|
Financials (as on) : |
31.12.2004 |
|
|
|
|
Date of Incorporation : |
16/12/1988 |
|
|
|
|
Legal Form : |
Joint
Stock Company |
|
|
|
|
Line of Business : |
Wholesale
of cereals, fertilizers, plants , etc. |
RATING & COMMENTS
|
MIRA’s Rating : |
B |
|
RATING |
STATUS |
PROPOSED CREDIT LINE |
|
|
26-40 |
B |
Unfavourable & favourable factors
carry similar weight in credit consideration. Capability to overcome
financial difficulties seems comparatively below average/normal. |
Small |
|
Status : |
Moderate
|
|
|
|
|
Payment Behaviour : |
Unknown
|
|
|
|
|
Litigation : |
Clear |
Identification and
Characteristics
|
Tax Number |
A78960622 |
|
NAME |
FERTILIZANTES
QUIMICOS SA |
|
ANAGRAM |
FERQUISA |
|
TRADE NAME |
FERQUISA |
|
BUSINESS
ADDRESS |
CALLE GONZALO DE |
|
Postcode |
28010 |
|
FORMER
ADDRESS |
CALLE MARQUES DE |
|
Postcode |
28014 |
|
URL |
http://www.haifachem.com |
|
TELEPHONE |
915912138 |
|
FAX |
915912552 |
|
LEGAL FORM |
JOINT STOCK COMPANY |
|
DATE FOUNDED |
16/12/1988 |
|
CAPITAL |
60.200,00 Euros |
|
PAID-UP CAPITAL |
60.200,00 Euros |
|
NUMBER OF
EMPLOYEES |
9 |
|
ACTIVITY |
1612200 - Wholesale of cereals,
fertilizers, plants , etc. |
|
CNAE |
5121 - Wholesale of grain, seeds
and animal feeds |
|
IMPORT COMPANY |
YES |
|
* Characteristics of the main address |
|
|
According to our investigations
dated 23/12/2004 it is a/an office, warehouse
property rented and it is located in an area main Clarifications: Domicilio Social |
|
Synthesis
|
FINANCIAL SITUATION (Year
ending: 31/12/2004) |
||
|
|
|
|
|
PROFITABILITY |
|
4/9 Nil |
|
TREASURY |
|
3/9 Limited |
|
BALANCE SHEET |
|
1/9 Degraded |
|
DEBT |
|
4/9 Heavy |
|
INCIDENTS |
||
|
|
|
|
|
COMMITMENTS |
|
9/9 Respected |
|
INCIDENTS |
|
9/9 None
or Negligible |
|
PREVIOUS EXPERIENCE |
||
|
|
|
|
|
PREVIOUS
EXPERIENCE |
|
6/9 Average |
Credit Appraisal
|
CREDIT ACCORDING TO OBJECTIVE DATA (From 0
to 6.000.000,00 Euros): |
|
Prudence advised. |
|
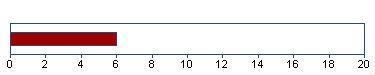
SOLVENCY RATING: |
|
6/20 (BASED ON HOMOGENEOUS
FORMULATION) |
|
|
|
Analysis made on 04/01/2007 |
Financial Elements
Figures given in
Euros
|
|
Balance
sheet 2.002 (12) |
Balance sheet 2.003
(12) |
Balance sheet 2.004
(12) |
% Sales |
|
|
SALES |
39.483.197,00 |
37.532.449,00 |
35.664.246,00 |
|
|
|
ADDED VALUE |
794.959,00 |
56.310,00 |
778.610,00 |
2,18 |
|
|
BUSINESS RESULT |
22.474,00 |
-150.817,00 |
116.174,00 |
0,33 |
|
|
OWN FUNDS |
362.110,00 |
211.293,00 |
327.467,00 |
|
|
|
DEBT |
19.211.461,00 |
22.468.767,00 |
17.083.997,00 |
|
|
|
TOTAL ASSET |
19.584.571,00 |
22.693.677,00 |
17.423.672,00 |
|
|
|
The sales of 35.664.246,00
Euros show a change of -4,98% compared with
2.003 . Between 2.002 and 2.003 , this
change was -4,94% . |
|||||
|
Added value grew by 1.282,72%
compared with the previous year. Shareholders equity are 327.467,00
Euros for an indebtedness of 17.083.997,00
Euros . |
|||||
|
The result 116.174,00
Euros means financial profitability of 35,48% and
economic profitability of 0,67% . This result means growth of
177,03% compared with the 2.003 . |
|||||
|
|
|||||
|
THE FIGURES FOR THE LAST BALANCE SHEET ARE
RELEVANT: |
|||||
|
SOURCE: FROM THE MERCANTILE REGISTER |
|||||
|
DATE: 27/02/2006 |
|||||
|
|
|
||||
|
Results Distribution |
|||||
|
Annual Report Year Source: 2.004 |
|||||
|
Figures given in Euros |
|||||
|
Distribution Base |
|||||
|
Profit and Loss |
116.174 |
||||
|
Total of Amounts to be
distributed |
116.174 |
||||
|
Distribution a |
|||||
|
Voluntary Reserve |
116.174 |
||||
|
|
|||||
|
Auditors’ opinion: |
|||||
|
FAVOURABLE WITH RESERVATIONS (2.004) |
|||||
|
|
|||||
|
Auditors: |
|||||
|
DELOITTE SL |
|||||
|
|
|
||||
|
Auditing Provisos |
|||||
|
Close Date: 31/12/2004 |
|
||||
|
|
|
||||
|
EL INFORME DE AUDITORIA DE LAS CUENTAS
ANUALES DE AGRICULTURA MODERNA, S.A. EMITIDO POR OTROS AUDITORES AL 31 DE
DICIEMBRE DE 2004, INCLUYE UNA INCERTIDUMBRE POR CONTINGENCIAS DE NATURALEZA
FISCAL CUYO IMPORTE Y EFECTO EN LA VALORACION DE LA PARTICIPACION EN LA
MENCIONADA SOCIEDAD, SEGUN EL SALDO QUE FIGURA EN LA NOTA 6, NO ES POSIBLE
CUANTIFICAR OBJETIVAMENTE. |
|||||
Comparative Sector
Analysis
|
|
Company |
Sector |
Difference |
|
|
(2.004) |
|
|
|
% of PRODUCTION VALUE |
|
|
|
|
SALES |
99,99 |
98,72 |
1,27 |
|
ADDED
VALUE |
2,18 |
8,08 |
-5,90 |
|
BUSINESS
RESULT |
0,33 |
1,62 |
-1,29 |
|
% OF TOTAL ASSETS |
|
|
|
|
OWN
FUNDS |
1,88 |
36,42 |
-34,54 |
|
DEBT |
98,05 |
63,58 |
34,47 |
Compared sector (CNAE): 512 - Comercio al por mayor de
materias primas agrarias y de animales vivos
Number of companies: 146
Size (Sales Figure): 7.000.000,00 - 40.000.000,00
Euros
The turnover of the company is 1,27%
above the mean for the sector.
The company’s added value was 2,18% s/
the production value, and 5,90% below the mean for the sector.
The company’s business result was
0,33% of the PV, 1,29% below the mean for the sector.
The company’s own resources are 1,88%
, 34,54% below the mean for the sector.
The company’s outside resources are
98,05% , 34,47% above the mean for the sector.
Legal Actions
|
No legal incidences registered for this
company in the official source |
|
|
CLAIM FILED AGAINST THE
ADMINISTRATION: 1 |
( Last 25/03/1999 ) |
|
|
0 |
|
|
0 |
|
|
1 |
|
AFFECTED BY: No significant elemento |
|
|
Last claim filed against the
administration |
|
(Figures given in Euros) |
|
||||
|
Rest of Organisms: 1 |
||||
|
|
||||
|
|
Information Date |
Organization |
Amount |
|
|
|
25/03/1999 |
UNDETERMINED AGENCY SUBDIRECCION DE
TRANSPORTES DE |
210,35 |
|
|
|
||||
Main Board members,
Directors and Auditor
|
Position |
Surname and name |
Date of appointment |
|
CHAIRMAN |
PELOSSOF AVI |
04/05/1998 |
|
BOARD MEMBER |
MATANIA ARIAV NIR |
05/06/2000 |
|
BOARD MEMBER |
DOWD WILLIAM |
17/11/2005 |
|
BOARD MEMBER |
OVADIA ILAN |
13/06/2006 |
|
AUDITOR |
DELOITTE TOUCHE ESPANA SL |
28/09/2004 |
Functional Managers
|
Position |
Surname and name |
Date of appointment |
|
GENERAL MANAGER |
|
06/07/2001 |
Financial Links
|
Shareholders |
||||
|
Company Name |
CIF/Country |
|
Source |
Information Date |
|
HAIFA CHEMICALS LTD |
|
99,40% |
OWN SOURCES |
20/06/2005 |
|
HAIFA CHEMICALS SOUTH LTD |
PAÍSES DIVERSOS |
0,60% |
OWN SOURCES |
20/06/2005 |
|
Shareholdings |
||||
|
Company Name |
CIF/Country |
Percent. |
Source |
Information Date |
|
AGRICULTURA MODERNA SA |
A80744998 |
100,00% |
M.REGISTER |
31/12/2005 |
Proceedings published
in the B.O.R.M.E. (Official Mercantile Register Gazette)
|
Proceedings |
Date |
Notice Num. |
Mercantile Reg. |
|
Registration of accounts
(2005) Consolidated |
04/01/2007 |
004091 |
|
|
Resignations |
13/06/2006 |
306905 |
|
|
Appointments |
13/06/2006 |
306905 |
|
|
Other statutary acts |
13/06/2006 |
306905 |
|
|
Registration of accounts
(2004) Consolidated |
28/11/2005 |
995461 |
|
Press articles
|
|
||
|
31/12/2002 |
M.REGISTER |
CONSOLIDATED BALANCE-SHEET |
|
ACTIVO (EN EUROS) PASIVO INMOVILIZADO:
2.098.018 FONDOS PROPIOS: 269.582 CAPITAL: 60.200 GASTOS A DISTRIBUIR: 15.636
RESULTADO: -403.998 CUENTAS A LARGO: 774.211 ACTIVO CIRCULANTE: 19.983.809
ACREEDORES A CORTO: 21.053.670 TOTAL ACTIVO: 22.097.463 TOTAL PASIVO:
22.097.463 |
||
|
|
||
|
08/08/2002 |
GACETA NEG |
LEGAL ANNOUNCE |
|
LA JUNTA GENERAL ORDINARIA Y UNIVERSAL,
CELEBRADA EL 30-06-02, ACORDO TRAS LADAR EL DOMICILIO SOCIAL A LA CALLE
GONZALO DE CORDOBA, 2, SEGUNDA PLANTA, EDIFICIO OPORTO, 28010 MADRID. |
||
Complementary
Information
|
La Junta General de fecha 23/11/01, acordo
la cesion global activo y |
|
pasivo de AGRICULTURA MODERNA SA NIF
A80744998, siendo beneficiaria |
|
FERTILIZANTES QUIMICOS SA NIF A78960622,
segun Borme Seccion 2 de 26/ |
|
11/01 |
|
07/07/2005 BLOQUE DE INVESTIGACION: |
|
- Direccion social: En C/ Gonzalo de
Cordoba, 2. ED. Oporto, situado |
|
en |
|
- El numero total de accionistas asciende
a 2. |
|
- Actividad: Comercio al mayor de
fertilizantes quimicos. |
|
---------------------------------------------------------------------- |
|
El Bloque de Investigacion no esta sujeto
a actualizaciones sistemati- |
|
cas. Los datos mostrados fueron aportados
por las fuentes consultadas |
|
en la fecha |
Commercial Experience
|
PURCHASES |
|
|
Import Percentage:
100% |
|
|
Imports:: |
|
|
|
|
|
|
|
|
SALES |
|
|
Collection (estimated) |
|
|
Cash sales percentage 40
% |
|
|
Credit sales percentage
60 % |
|
|
|
|
|
Commercial Experience |
|
|
|
|
|
Suppliers |
International |
|
HAIFA CHEMICALS LTD |
|
|
HAIFA CHEMICAL SOUTH LTD |
|
|
AGRICULTURA MODERNA SA |
|
|
DUCLOS INTERNACIONAL |
|
|
HI CHEM SA |
|
|
|
|
|
Total 25 |
|
|
|
|
|
Clients |
International |
|
AGRICULTURA MODERNA SA |
|
|
HI CHEM SA |
|
|
HAIFA CHEMICALS, LTD |
|
|
AGRICULTURA MODERNA, SA |
|
|
HAIFA CHEMICALS LTD |
|
|
Total 10 |
|
Bank Entities
|
Entity |
|
|
|
|
|
BANCO BILBAO VIZCAYA ARGENTARIA, S.A. |
|
|
|
|
|
CAJA DE AHORROS Y M.P. |
|
|
|
|
The information on the last account
contained in this report is extracted from the Mercantile Register file of the
legal address of the Company and dated 27/02/2006
Balance Sheet
(ASSETS)
|
(Figures given in Euros) |
31/12/2002 (12) |
31/12/2003 (12) |
31/12/2004 (12) |
|
|
|
A) DUE FROM SHAREHOLDERS FOR UNCALLED
CAPITAL |
|
|
|
|
|
B) FIXED ASSETS |
3.073.314,00 |
3.050.960,00 |
3.034.470,00 |
|
|
I. Establishment expenses |
|
|
|
|
|
II. Intangible assets |
7.603,00 |
5.620,00 |
3.637,00 |
|
|
Software |
9.914,00 |
9.914,00 |
9.914,00 |
|
|
Amortization |
-2.311,00 |
-4.294,00 |
-6.277,00 |
|
|
III. Tangible assets |
49.392,00 |
34.767,00 |
20.260,00 |
|
|
Other property plant and equipement |
7.717,00 |
6.799,00 |
6.799,00 |
|
|
Other assets |
83.753,00 |
83.753,00 |
53.517,00 |
|
|
Depreciation |
-42.078,00 |
-55.785,00 |
-40.056,00 |
|
|
IV. Financial assets |
3.016.319,00 |
3.010.573,00 |
3.010.573,00 |
|
|
Shares in affiliated companies |
3.005.061,00 |
3.005.061,00 |
3.005.061,00 |
|
|
Long term deposits and guarantees |
11.258,00 |
5.512,00 |
5.512,00 |
|
|
V. Owners equity |
|
|
|
|
|
VI. Long term trade liabilities |
|
|
|
|
|
C) DEFERRED EXPENSES |
15.636,00 |
|
|
|
|
D) CURRENT ASSETS |
16.495.621,00 |
19.642.717,00 |
14.389.202,00 |
|
|
I. Not paid in shareholder capital |
|
|
|
|
|
II. Inventory |
5.224.239,00 |
8.160.233,00 |
4.438.208,00 |
|
|
Goods available for sale |
5.511.146,00 |
|
|
|
|
Raw material inventory |
|
4.035.629,00 |
2.332.637,00 |
|
|
Work in Progress |
|
1.257.969,00 |
268.830,00 |
|
|
Finished goods |
|
2.736.131,00 |
2.010.024,00 |
|
|
Subproducts and recycled materials |
|
216.115,00 |
152.114,00 |
|
|
Cash advance |
|
4.325,00 |
5.864,00 |
|
|
Provisions |
-286.907,00 |
-89.936,00 |
-331.261,00 |
|
|
III. Debtors |
10.510.041,00 |
11.074.244,00 |
9.367.605,00 |
|
|
Clients |
8.258.957,00 |
7.766.348,00 |
7.596.161,00 |
|
|
Amounts owned by affiliated companies |
1.863.883,00 |
2.406.844,00 |
1.286.892,00 |
|
|
Taxes refunds |
387.201,00 |
901.052,00 |
484.552,00 |
|
|
IV. Short term financial assets |
|
|
|
|
|
V. Short term owners equity |
|
|
|
|
|
VI. Cash |
761.341,00 |
408.240,00 |
583.389,00 |
|
|
VII. Prepaid expenses and accrued income |
|
|
|
|
|
ASSETS (A + B + C + D) |
19.584.571,00 |
22.693.677,00 |
17.423.672,00 |
Balance Sheet
(LIABILITIES)
|
(Figures given in Euros) |
31/12/2002 (12) |
31/12/2003 (12) |
31/12/2004 (12) |
|
|
|
A) SHAREHOLDERS EQUITY |
362.110,00 |
211.293,00 |
327.467,00 |
|
|
I. Capital |
60.200,00 |
60.200,00 |
60.200,00 |
|
|
II. Premium share account |
|
|
|
|
|
III. Revaluation reserve |
|
|
|
|
|
IV. Reserves |
279.436,00 |
301.910,00 |
301.910,00 |
|
|
Retained earnings |
|
12.765,00 |
12.765,00 |
|
|
Other funds |
279.436,00 |
289.145,00 |
289.145,00 |
|
|
V. Prior year earnings |
|
|
-150.817,00 |
|
|
Prior years losses |
|
|
-150.817,00 |
|
|
VI. Prior year profit or losses |
22.474,00 |
-150.817,00 |
116.174,00 |
|
|
VII. Dividend paid during the year |
|
|
|
|
|
VIII. Own shares for change in capital |
|
|
|
|
|
B) DEFERRED INCOME |
|
2.617,00 |
1.208,00 |
|
|
Rate difference |
|
2.617,00 |
1.208,00 |
|
|
C) PROVISIONS FOR LIABILITIES AND EXPENSES |
11.000,00 |
11.000,00 |
11.000,00 |
|
|
Provision for pensions plans |
11.000,00 |
11.000,00 |
11.000,00 |
|
|
D) LONG TERM LIABILITIES |
|
|
|
|
|
I. Bonds |
|
|
|
|
|
II. Bank loans |
|
|
|
|
|
III. Debts with associed and affiliated
companies |
|
|
|
|
|
IV. Other creditors |
|
|
|
|
|
V. Deferred debts on shares |
|
|
|
|
|
VI. Long term debt with creditor |
|
|
|
|
|
E) SHORT TERM LIABILITIES |
19.211.461,00 |
22.468.767,00 |
17.083.997,00 |
|
|
I. Negotiable bonds |
|
|
|
|
|
II. Bank loans |
3.760.161,00 |
3.359.272,00 |
3.247.498,00 |
|
|
Loans and other debts |
3.760.161,00 |
3.359.272,00 |
3.247.498,00 |
|
|
III. Short term debts with associated and
affiliated companies |
13.970.580,00 |
17.910.377,00 |
1.004.479,00 |
|
|
With affiliated companies |
13.970.580,00 |
17.910.377,00 |
1.004.479,00 |
|
|
IV. Trade creditors |
1.450.816,00 |
1.096.763,00 |
12.747.016,00 |
|
|
Expenses |
1.450.816,00 |
1.096.763,00 |
12.747.016,00 |
|
|
V. Other non trade payables |
29.904,00 |
102.355,00 |
85.004,00 |
|
|
Government |
23.469,00 |
95.611,00 |
81.219,00 |
|
|
Other debts |
6.435,00 |
6.744,00 |
3.785,00 |
|
|
VI. Provisions for current assets |
|
|
|
|
|
VII. Accruals and deferred incomes |
|
|
|
|
|
F) SHORT TERM PROVISIONS FOR LIABILITIES
AND EXPENSES |
|
|
|
|
|
LIABILITIES (A + B + C + D + E + F) |
19.584.571,00 |
22.693.677,00 |
17.423.672,00 |
Profit and Loss
Account
|
(Figures given in Euros) |
31/12/2002 (12) |
31/12/2003 (12) |
31/12/2004 (12) |
|
|
|
A) EXPENSES (A.1 a A.16) |
|
|
|
|
|
A.1. Change in stocks of finished goods
and work in progress |
|
|
3.480.700,00 |
|
|
A.2. Supplies |
38.872.361,00 |
40.168.836,00 |
30.858.643,00 |
|
|
Material consumed |
38.872.361,00 |
40.168.836,00 |
30.858.643,00 |
|
|
A.3. Labor cost |
319.012,00 |
337.135,00 |
282.247,00 |
|
|
Wages |
238.179,00 |
260.450,00 |
215.510,00 |
|
|
Social security expenses |
80.833,00 |
76.685,00 |
66.737,00 |
|
|
A.4. Assets depreciation |
20.888,00 |
16.608,00 |
12.800,00 |
|
|
A.5 Variance in provision for current
assets |
291.090,00 |
-196.971,00 |
241.325,00 |
|
|
Variance in provision for inventory |
291.090,00 |
-196.971,00 |
241.325,00 |
|
|
A.6. Other operating costs |
625.013,00 |
506.342,00 |
548.729,00 |
|
|
External costs |
625.013,00 |
504.681,00 |
546.892,00 |
|
|
Taxes |
|
1.661,00 |
1.837,00 |
|
|
A.I. OPERATING RESULT
(B.1+B.2+B.3+B.4-A.1-A.2-A.3-A.4-A.5-A.6) |
163.969,00 |
|
242.238,00 |
|
|
A.7. Financial expenses |
178.504,00 |
116.160,00 |
94.030,00 |
|
|
Other companies debts |
178.504,00 |
116.160,00 |
94.030,00 |
|
|
A.8. Variation in financial investments
provision |
|
|
|
|
|
A.9. Exchange losses |
29.763,00 |
28.553,00 |
15.233,00 |
|
|
A.II. POSITIVE FINANCIAL RESULTS
(B.5+B.6+B.7+B.8-A.7-A.8-A.9) |
|
|
|
|
|
A.III. PROFIT FROM ORDINARY ACTIVITIES
(A.I+A.II-B.I-B.II) |
|
|
146.921,00 |
|
|
A.10. Variation in provision in fixed
assets |
21.265,00 |
|
|
|
|
A.11. Losses in fixed assets |
|
|
1.222,00 |
|
|
A.12. Losses from shares and bonds |
|
|
|
|
|
A.13. Extraordinary charges |
|
10.310,00 |
29.659,00 |
|
|
A.14. Prior year’s expenses and losses |
69.875,00 |
1.040,00 |
|
|
|
A.IV. POSITIVE EXTRAORDINARY RESULT
(B.9+B.10+B.11+B.12+B.13-A.10-A.11-A.12-A.13-A.14) |
52.185,00 |
42.720,00 |
|
|
|
A.V. EARNINGS / LOSS BEFORE TAXES
(A.III+A.IV-B.III-B.IV) |
32.880,00 |
|
129.184,00 |
|
|
A.15. Corporate Taxes |
10.406,00 |
39.651,00 |
13.010,00 |
|
|
A.16. Other taxes |
|
|
|
|
|
A.VI. YEAR END RESULT (PROFIT)
(A.V-A.15-A.16) |
22.474,00 |
|
116.174,00 |
|
|
B) INCOMES (B.1 a B13) |
|
|
|
|
|
B.1. Turnover |
39.483.197,00 |
37.532.449,00 |
35.664.246,00 |
|
|
Sales |
39.483.197,00 |
37.532.449,00 |
35.664.246,00 |
|
|
B.2. Increase in inventory of finished
goods |
|
2.739.023,00 |
|
|
|
B.3. Expenses capitalized |
|
|
|
|
|
B.4. Other operating income |
809.136,00 |
460.016,00 |
2.436,00 |
|
|
Other incomes |
809.136,00 |
460.016,00 |
2.436,00 |
|
|
B.I. OPERATING LOSSES
(A.1+A.2+A.3+A.4+A.5+A.6-B.1-B.2-B.3-B.4) |
|
100.462,00 |
|
|
|
B.5. Incomes from share |
|
|
|
|
|
B.6. Income from securities |
|
|
|
|
|
B.7. Other income from interrest |
148,00 |
940,00 |
1.255,00 |
|
|
From other companies |
148,00 |
940,00 |
1.255,00 |
|
|
B.8. Gains on exchange |
24.845,00 |
90.349,00 |
12.691,00 |
|
|
B.II. FINANCIAL LOSSES
(A.7+A.8+A.9-B.5-B.6-B.7-B.8) |
183.274,00 |
53.424,00 |
95.317,00 |
|
|
B.III. LOSSES FROM ORDINARY ACTIVITIES
(B.I+B.II-A.I-A.II) |
19.305,00 |
153.886,00 |
|
|
|
B.9. Gains from disposal of fixed assets |
|
|
2.700,00 |
|
|
B.10. Gains from dealing in own shares |
|
|
|
|
|
B.11. Paid in surplus |
|
|
|
|
|
B.12. Extraordinary income |
10.826,00 |
54.070,00 |
6.643,00 |
|
|
B.13. Prior year’s income and profits |
132.499,00 |
|
3.801,00 |
|
|
B.IV. EXTRAORDINARY LOSSES (A.10+A.11+A.12+A.13+A.14-B.9-B.10-B.11-B.12-B.13) |
|
|
17.737,00 |
|
|
B.V. LOSS BEFORE TAXES
(B.III+B.IV-A.III-A.IV) |
|
111.166,00 |
|
|
|
B.VI. NET LOSS (B.V+A.15+A.16) |
|
150.817,00 |
|
Main Ratios
|
(Figures given in Euros) |
2.002 (12) |
2.003 (12) |
2.004 (12) |
|
|
|
ACTIVITY |
|
|
|
|
|
Increase of the Sales Figures |
-0,64 |
-4,94 |
-4,98 |
|
|
Assets Turnover |
2,02 |
1,65 |
2,05 |
|
|
Productivity |
2,49 |
0,17 |
2,76 |
|
|
Increase of the Added Value |
-6,05 |
-92,92 |
1.282,72 |
|
|
PROFITABILITY |
|
|
|
|
|
Economic Profitability |
0,12 |
-0,66 |
0,67 |
|
|
Financial Profitability |
6,21 |
-71,38 |
35,48 |
|
|
Financial Expenses |
0,45 |
0,31 |
0,26 |
|
|
BALANCE (IN DAYS OF SALES) |
|
|
|
|
|
Customers’ Credit (In days of sales) |
96,00 |
106,00 |
95,00 |
|
|
Suppliers’ Credit (In days of sales) |
13,00 |
11,00 |
134,00 |
|
|
Working Capital (In days of sales) |
0,00 |
0,00 |
0,00 |
|
|
Working Capital Requirement (In days of
sales) |
3,00 |
1,00 |
0,00 |
|
|
Treasury (In days of sales) |
0,00 |
0,00 |
0,00 |
|
|
BALANCE |
|
|
|
|
|
Working Capital |
-2.715.840,00 |
-2.826.050,00 |
-2.694.795,00 |
|
|
Working Capital Requirement |
282.980,00 |
124.982,00 |
-30.686,00 |
|
|
Treasury |
-2.998.820,00 |
-2.951.032,00 |
-2.664.109,00 |
|
|
Balance Ratio |
0,12 |
0,07 |
0,11 |
|
|
SOLVENCY |
|
|
|
|
|
Borrowing Ratio |
98,10 |
99,01 |
98,05 |
|
|
Own / Permanent Funds |
97,05 |
93,95 |
96,41 |
|
|
Payback Capacity |
0,48 |
0,60 |
0,48 |
|
|
LIQUIDITY |
|
|
|
|
|
General Liquidity |
0,86 |
0,87 |
0,84 |
|
|
Immediate Liquidity |
0,04 |
0,02 |
0,03 |
Sectorial Analysis
Summary of Assets, Liability & Equity
|
(Figures given in Percentages) |
Company |
Sector |
Company |
|
|
2.004 |
|
|
|
Assets |
|||
|
DUE FROM SHAREHOLDERS
FOR UNCALLED CAPITAL |
0,00 |
0,01 |
-0,01 |
|
FIXED ASSETS |
17,42 |
26,15 |
-8,73 |
|
ACCRUED EXPENSES |
0,00 |
0,15 |
-0,15 |
|
CURRENT ASSETS |
82,58 |
73,69 |
8,89 |
|
TOTAL ASSETS |
100,00 |
100,00 |
0,00 |
|
Liabilities |
|||
|
SHAREHOLDERS EQUITY |
1,88 |
36,42 |
-34,54 |
|
ACCRUED INCOME |
0,01 |
1,11 |
-1,10 |
|
RISK AND EXPENDITURE
COVER |
0,06 |
0,19 |
-0,13 |
|
LONG-TERM CREDITORS |
0,00 |
9,13 |
-9,13 |
|
SHORT-TERM CREDITORS |
98,05 |
53,09 |
44,96 |
|
SHORT-TERM RISK AND
EXPENDITURE COVER |
0,00 |
0,06 |
-0,06 |
|
TOTAL LIABILITIES |
100,00 |
100,00 |
0,00 |
Analytical Account of
Results
|
(Figures given in Percentages) |
Company |
Sector |
Company |
|
|
2.004 |
|
|
|
Net turnover |
99,99 |
98,72 |
1,27 |
|
Other operating income |
0,01 |
1,28 |
-1,27 |
|
Production Value |
100,00 |
100,00 |
0,00 |
|
Operating expenses |
96,28 |
85,32 |
10,95 |
|
Other operation expenses |
1,54 |
6,60 |
-5,06 |
|
Added value |
2,18 |
8,08 |
-5,90 |
|
Labor cost |
0,79 |
4,40 |
-3,61 |
|
Gross Economic Result |
1,39 |
3,68 |
-2,29 |
|
Assets depreciation |
0,04 |
0,93 |
-0,89 |
|
Variation in provision
for current assets |
0,68 |
0,25 |
0,43 |
|
Net Economic Result |
0,68 |
2,50 |
-1,82 |
|
Financial income |
0,04 |
0,38 |
-0,34 |
|
Financial expenses |
0,31 |
0,79 |
-0,49 |
|
Variation in financial
investment provision |
0,00 |
-0,02 |
0,02 |
|
Ordinary Activities
Result |
0,41 |
2,11 |
-1,70 |
|
Extraordinary income |
0,04 |
0,33 |
-0,29 |
|
Extraordinary expenses |
0,09 |
0,14 |
-0,05 |
|
Variation in provision
in fixed assets |
0,00 |
0,01 |
-0,01 |
|
Results before Taxes |
0,36 |
2,29 |
-1,93 |
|
Corporaye taxes |
0,04 |
0,67 |
-0,63 |
|
Net Result |
0,33 |
1,62 |
-1,30 |
|
Assets depreciation |
0,04 |
0,93 |
-0,89 |
|
Provisions fund
variation |
0,68 |
0,25 |
0,43 |
|
Net Self-Financing |
1,04 |
2,79 |
-1,76 |
Ratios
|
(Figures given in ) |
Company |
Ptile25 |
Medium |
Ptile75 |
|
|
2.004 |
|
|
|
|
ACTIVITY |
|
|
|
|
|
Increase of the Sales
Figures |
-4,98 |
-10,43 |
1,32 |
12,98 |
|
Assets Turnover |
2,05 |
1,62 |
2,56 |
4,09 |
|
Fixed Assets Turnover |
11,75 |
6,34 |
11,44 |
28,35 |
|
Increase of the Added
Value |
1.282,72 |
-7,26 |
4,30 |
15,84 |
|
PRODUCTIVITY |
|
|
|
|
|
Productivity |
2,76 |
1,55 |
1,99 |
2,58 |
|
Change of Personnel
Costs |
-16,28 |
1,05 |
6,73 |
15,39 |
|
Average Personnel Costs |
47.041,17 |
18.182,41 |
23.546,55 |
30.654,10 |
|
Value Added by Employees |
129.768,33 |
34.500,86 |
47.750,22 |
66.324,84 |
|
CASH FLOW |
|
|
|
|
|
Cash Flow |
370.299,00 |
106.500,43 |
212.364,25 |
487.480,49 |
|
Operating Cash Flow |
496.363,00 |
143.022,85 |
276.805,07 |
609.547,26 |
|
Change in Cash Flow |
211,81 |
-18,56 |
1,15 |
20,06 |
|
PROFITABILITY |
|
|
|
|
|
Economic Profitability |
0,67 |
0,95 |
2,28 |
4,62 |
|
Financial Profitability |
35,48 |
4,58 |
8,87 |
13,03 |
|
Financial Expenses |
0,26 |
0,19 |
0,54 |
0,97 |
|
Gross Economic
Profitability |
2,85 |
4,33 |
6,42 |
11,04 |
|
Gross Financial
Profitability |
151,58 |
14,36 |
25,17 |
38,32 |
|
BALANCE (IN DAYS OF SALES) |
|
|
|
|
|
Customers’ Credit (In
days of sales) |
94,00 |
35,41 |
54,31 |
83,99 |
|
Suppliers’ Credit (In
days of sales) |
133,00 |
0,00 |
29,84 |
64,92 |
|
Working Capital (In days
of sales) |
0,00 |
2,19 |
15,59 |
51,81 |
|
Working Capital
Requirement (In days of sales) |
0,00 |
1,82 |
26,00 |
56,23 |
|
Treasury (In days of
sales) |
0,00 |
-26,18 |
0,90 |
9,72 |
|
Operating Current Assets |
145,00 |
68,03 |
100,10 |
151,09 |
|
BALANCE |
|
|
|
|
|
Working Capital |
-2.694.795,00 |
75.468,50 |
544.816,50 |
1.560.665,49 |
|
Working Capital
Requirement |
-30.686,00 |
53.485,83 |
885.118,30 |
2.463.722,10 |
|
Treasury |
-2.664.109,00 |
-814.404,01 |
22.027,45 |
354.665,75 |
|
Balance Ratio |
0,11 |
1,08 |
1,64 |
3,69 |
|
SOLVENCY |
|
|
|
|
|
Borrowing Ratio |
98,05 |
48,72 |
71,06 |
83,68 |
|
Own / Permanent Funds |
96,41 |
67,05 |
93,46 |
100,00 |
|
Payback Capacity |
0,48 |
0,15 |
0,23 |
0,35 |
|
Long term Indebtedness |
|
0,00 |
1,67 |
9,61 |
|
Gearing |
5.320,74 |
195,02 |
345,54 |
612,67 |
|
Financing Basic Ratio |
1,00 |
1,00 |
1,00 |
1,01 |
|
Assets Guarantee |
1,02 |
1,17 |
1,38 |
2,03 |
|
LIQUIDITY |
|
|
|
|
|
General Liquidity |
0,84 |
1,03 |
1,22 |
1,71 |
|
Immediate Liquidity |
0,03 |
0,02 |
0,08 |
0,30 |
RATING EXPLANATIONS
|
RATING |
STATUS |
PROPOSED CREDIT LINE |
|
|
>86 |
Aaa |
Possesses an extremely sound financial
base with the strongest capability for timely payment of interest and
principal sums |
Unlimited |
|
71-85 |
Aa |
Possesses adequate working capital. No
caution needed for credit transaction. It has above average (strong)
capability for payment of interest and principal sums |
Large |
|
56-70 |
A |
Financial & operational base are
regarded healthy. General unfavourable factors will not cause fatal effect.
Satisfactory capability for payment of interest and principal sums |
Fairly Large |
|
41-55 |
Ba |
Overall operation is considered normal.
Capable to meet normal commitments. |
Satisfactory |
|
26-40 |
B |
Unfavourable & favourable factors carry
similar weight in credit consideration. Capability to overcome financial
difficulties seems comparatively below average/normal. |
Small |
|
11-25 |
Ca |
Adverse factors are apparent. Repayment of
interest and principal sums in default or expected to be in default upon
maturity |
Limited with full security |
|
<10 |
C |
Absolute credit risk exists. Caution
needed to be exercised |
Credit not recommended |
|
NR |
In view of the lack of information, we
have no basis upon which to recommend credit dealings |
No Rating |
|