
MIRA
INFORM REPORT
|
Report Date : |
17.01.2007 |
IDENTIFICATION
DETAILS
|
Name : |
INDUSTRIA
DE DISENO TEXTIL SA |
|
|
|
|
Registered Office : |
Avenida
Diputacion (Plgo Industrial Sabon), S/N, 15142 Arteixo (La
Coruna) |
|
|
|
|
Country : |
Spain |
|
|
|
|
Financials (as on) : |
31.12.2006 |
|
|
|
|
Date of Incorporation : |
12/06/1985 |
|
|
|
|
Legal Form : |
Joint
Stock Company |
|
|
|
|
Line of Business : |
Wholesale
of clothing (outerwear) |
RATING & COMMENTS
|
MIRA’s Rating : |
A |
|
RATING |
STATUS |
PROPOSED CREDIT LINE |
|
|
56-70 |
A |
Financial & operational base are
regarded healthy. General unfavourable factors will not cause fatal effect.
Satisfactory capability for payment of interest and principal sums |
Fairly Large |
|
Status : |
Good |
|
|
|
|
Payment Behaviour : |
Regular
|
|
|
|
|
Litigation : |
Clear |
Identification and
Characteristics
|
Tax Number |
A15075062 |
|
NAME |
INDUSTRIA DE DISENO TEXTIL SA |
|
ANAGRAM |
INDITEX |
|
TRADE NAME |
STRADIVARIUS |
|
BUSINESS
ADDRESS |
AVENIDA DIPUTACION (PLGO INDUSTRIAL
SABON), S/N |
|
Postcode |
15142 ARTEIXO (LA CORUNA) |
|
FORMER
ADDRESS |
POLIGONO INDUSTRIAL SABON -
PAR, 79 |
|
Postcode |
15142 ARTEIXO (LA CORUNA) |
|
URL |
http://www.inditex.com |
|
TELEPHONE |
981185400 |
|
FAX |
981185544 |
|
LEGAL FORM |
JOINT STOCK COMPANY |
|
DATE FOUNDED |
12/06/1985 |
|
CAPITAL |
93.500.000,00 Euros |
|
PAID-UP CAPITAL |
93.500.000,00 Euros |
|
NUMBER OF
EMPLOYEES |
623 |
|
STOCK MARKET PRICE |
YES |
|
TYPE |
ORDINARY SHARES |
|
PERIOD |
MADRID |
|
PLACE |
BARCELONA; VIZCAYA;
VALENCIA; |
|
ACTIVITY |
1613300 - Wholesale of clothing
(outerwear) |
|
CNAE |
5142 - Wholesale of clothing and
footwear |
|
EXPORT COMPANY |
YES |
|
IMPORT COMPANY |
YES |
|
* Characteristics of the main address |
|
|
According to our investigations
dated 30/06/2006 it is a/an office property owned;
with no official confirmation and it is located in an
area secondary |
|
Synthesis
|
FINANCIAL SITUATION (Year
ending: 31/01/2006) |
||
|
|
|
|
|
PROFITABILITY |
|
9/9 Excellent |
|
TREASURY |
|
8/9 Very
good |
|
BALANCE SHEET |
|
7/9 Good |
|
DEBT |
|
7/9 Low |
|
INCIDENTS |
||
|
|
|
|
|
COMMITMENTS |
|
9/9 Respected |
|
INCIDENTS |
|
9/9 None
or Negligible |
|
PREVIOUS EXPERIENCE |
||
|
|
|
|
|
PREVIOUS
EXPERIENCE |
|
9/9 Very
favourable |
Credit Appraisal
|
CREDIT ACCORDING TO OBJECTIVE DATA (From 0
to 6.000.000,00 Euros): |
|
FAVOURABLE TOWARDS 6.000.000,00
Max. |
|
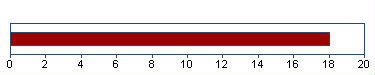
SOLVENCY RATING: |
|
18/20 (BASED ON HOMOGENEOUS
FORMULATION) |
|
|
|
|
Financial Elements
Figures given in
thousands of Euros
|
|
Balance
sheet 2.004 (12) |
Balance sheet 2.005
(12) |
Balance sheet 2.006
(12) |
% Sales |
|
|
SALES |
1.827.161,00 |
2.007.100,00 |
2.332.152,00 |
|
|
|
ADDED VALUE |
174.351,00 |
186.861,00 |
194.771,00 |
8,35 |
|
|
BUSINESS RESULT |
272.735,00 |
343.670,00 |
520.669,00 |
22,33 |
|
|
OWN FUNDS |
1.086.706,00 |
1.212.215,00 |
1.433.685,00 |
|
|
|
DEBT |
690.304,00 |
865.993,00 |
1.205.105,00 |
|
|
|
TOTAL ASSET |
1.799.220,00 |
2.107.140,00 |
2.678.150,00 |
|
|
|
The sales of 2.332.152,00
thousands of Euros show a change of 16,20% compared
with 2.005 . Between 2.004 and 2.005 , this
change was 9,85% . |
|||||
|
Added value grew by 4,23%
compared with the previous year. Shareholders equity are 1.433.685,00
thousands of Euros for an indebtedness of 1.205.105,00
thousands of Euros . |
|||||
|
The result 520.669,00
thousands of Euros means financial profitability of
36,32% and economic profitability of 19,44% . This
result means growth of 51,50% compared with the
2.005 . |
|||||
|
|
|||||
|
THE FIGURES FOR THE LAST BALANCE SHEET ARE
RELEVANT: |
|||||
|
SOURCE: OWN SOURCES |
|||||
|
DATE: 27/07/2006 |
|||||
|
|
|
||||
|
Results Distribution |
|||||
|
Annual Report Year Source: 2.004 |
|||||
|
Figures given in Euros |
|||||
|
Distribution Base |
|||||
|
Profit and Loss |
343.670.000 |
||||
|
Total of Amounts to be
distributed |
343.670.000 |
||||
|
Distribution a |
|||||
|
Voluntary Reserve |
44.471.000 |
||||
|
Dividends |
299.199.000 |
||||
|
|
|||||
|
Auditors’ opinion: |
|||||
|
FAVOURABLE (2.006) |
|||||
|
|
|||||
|
Auditors: |
|||||
|
KPMG AUDITORES S.L. |
|||||
Comparative Sector
Analysis
|
|
Company |
Sector |
Difference |
|
|
(2.006) |
|
|
|
% of PRODUCTION VALUE |
|
|
|
|
SALES |
96,24 |
97,44 |
-1,20 |
|
ADDED
VALUE |
8,04 |
15,25 |
-7,21 |
|
BUSINESS
RESULT |
21,49 |
4,37 |
17,12 |
|
% OF TOTAL ASSETS |
|
|
|
|
OWN
FUNDS |
53,53 |
38,01 |
15,52 |
|
DEBT |
45,00 |
61,99 |
-16,99 |
Compared sector (CNAE): 514 - Comercio al por mayor de
productos de consumo, distinto de los alimenticios
Number of companies: 125
Size (Sales Figure): > 40.000.000,00 Euros
The turnover of the company is 1,20%
below the mean for the sector.
The company’s added value was 8,04% s/
the production value, and 7,21% below the mean for the sector.
The company’s business result was
21,49% of the PV, 17,12% above the mean for the sector.
The company’s own resources are 53,53%
, 15,52% above the mean for the sector.
The company’s outside resources are
45,00% , 16,99% below the mean for the sector.
Legal Actions
|
No legal incidences registered for this
company in the official source |
|
|
CLAIM FILED AGAINST THE
ADMINISTRATION: 1 |
( Last 11/04/2001 ) |
|
|
0 |
|
|
0 |
|
|
1 |
|
AFFECTED BY: No significant elemento |
|
|
Last claim filed against the
administration |
|
(Figures given in Euros) |
|
||||
|
Rest of Organisms: 1 |
||||
|
|
||||
|
|
Information Date |
Organization |
|
|
|
|
11/04/2001 |
DEPUTATION/ DELEGATION DE LA CORUNA |
|
|
|
|
||||
Main Board members,
Directors and Auditor
|
Position |
Surname and name |
Date of appointment |
|
CHAIRMAN |
ORTEGA GAONA AMANCIO |
06/09/2005 |
|
VICE-PRESIDENT |
ISLA ALVAREZ DE TEJERA PABLO |
02/11/2005 |
|
VICE-PRESIDENT |
ESPINOSA DE LOS MONTEROS Y BERNALDO DE
QUIROS CARL |
02/11/2005 |
|
BOARD MEMBER |
ABRIL ABADIN ANTONIO GERARDO |
17/09/2003 |
|
BOARD MEMBER |
LUZON LOPEZ FRANCISCO |
21/09/2004 |
|
BOARD MEMBER |
URGOITI LOPEZ DE OCANA JUAN MANUEL |
06/09/2005 |
|
BOARD MEMBER |
GARTLER SL |
06/09/2005 |
|
BOARD MEMBER |
VAZQUEZ MARINO JOSE LUIS |
06/09/2005 |
|
BOARD MEMBER |
MILLER IRENE RUTH |
23/08/2006 |
|
AUDITOR |
KPMG AUDITORES S L |
23/08/2006 |
Functional Managers
|
Position |
Surname and name |
Date of appointment |
|
FINANCIAL MANAGER |
RUBIO MERINO ANTONIO |
03/03/2006 |
|
HUMAN RESOURCES MANAGER |
VEGA DE LA FALLA JESUS |
16/09/2005 |
|
MARKETING MANAGER |
JOSE MARIA GONZALEZ |
16/09/2005 |
|
EXPORTS MANAGER |
ROMAY DE LA COLINA JOSE MARIA |
16/09/2005 |
|
COMPUTING MANAGER |
SALGADO JUAN |
16/09/2005 |
Financial Links
|
Shareholders |
||||
|
Company Name |
CIF/Country |
|
Source |
Information Date |
|
GARTLER S.L. |
B70080601 |
50,01% |
STOCK EXCH. |
14/12/2006 |
|
ROSP CORUNNA PARTICIPACIONES EMPRESARIALES
S.L. |
B15792278 |
6,99% |
OWN SOURCES |
30/06/2006 |
|
CHASE NOMINEES LTD |
REINO UNIDO |
5,97% |
OWN SOURCES |
30/06/2006 |
|
STATE STREET BANK AND TRUST CO |
ESTADOS UNIDOS |
5,03% |
OWN SOURCES |
30/06/2006 |
|
CAPITAL GROUP |
PAÍSES DIVERSOS |
3,94% |
CINCO DIAS |
30/10/2006 |
|
FIDELITY INTERNATIONAL LIMITED |
ESTADOS UNIDOS |
1,22% |
CINCO DIAS |
30/10/2006 |
|
Shareholdings |
||||
|
Company Name |
CIF/Country |
Percent. |
Source |
Information Date |
|
SAMLOR S.A. |
A15022585 |
100,00% |
M.REGISTER |
31/01/2005 |
|
ZA CLOTHING IRELAND LTD |
IRLANDA |
100,00% |
M.REGISTER |
31/01/2005 |
|
ZARA MAGYARORSZAG |
HUNGRÍA |
100,00% |
M.REGISTER |
31/01/2005 |
|
ZARA BELGIQUE SA |
BÉLGICA |
100,00% |
M.REGISTER |
31/01/2005 |
|
ZARA SVERIGE AB |
SUECIA |
100,00% |
M.REGISTER |
31/01/2005 |
|
NIKOLE SA |
A15049299 |
100,00% |
M.REGISTER |
31/01/2005 |
Proceedings published
in the B.O.R.M.E. (Official Mercantile Register Gazette)
|
Proceedings |
Date |
Notice Num. |
Mercantile Reg. |
|
Registration of accounts
(2005) |
08/11/2006 |
855531 |
LA CORUNA |
|
Registration of accounts
(2005) Consolidated |
08/11/2006 |
854245 |
LA CORUNA |
|
Appointments |
08/11/2006 |
532427 |
LA CORUNA |
|
Other statutary acts |
08/11/2006 |
532426 |
LA CORUNA |
|
Change of statutes |
08/11/2006 |
532425 |
LA CORUNA |
Press articles
|
|
||
|
12/01/2007 |
GACETA NEG |
BRANCHES INFORMATION |
|
INDITEX COMIENZA A TOMAR POSICIONES ANTE
UNA POSIBLE VENTA DE ACTIVOS POR PARTE DE LA FIRMA NORTEAMERICANA GAP. LA
CIA. DE MODA GALLEGA QUE CONTROLA AMANCIO ORTEGA MIRA DE SOSLAYO HACIA UN
MERCADO QUE, EN PRINCIPIO, NO REPRE SENTA UNA PRIORIDAD PARA SUS PLANES
EXPANSIONISTAS, CON UN CRECIMIENTO PRE VISTO DE 50 TIENDAS PARA UN PERIODO DE
3 AÑOS, PERO QUE MUESTRA ALGUNOS CAM BIOS SIGNIFICATIVOS. EN EL SUPUESTO DE
QUE GAP DECIDIERA VENDER, INDITEX AC CEDERIA A LA OPERACION MEDIANTE UNA
COMPRA LOCAL A LOCAL Y NUCA A TRAVES DE PAQUETES DE ACTIVOS INMOBILIARIOS. LOS
ESTADOS DE FLORIDA, CALIFORNIA, NUEVA YORK Y WASHINGTON SERIAN, EN PRINCIPIO,
LOS MAS ATRACTIVOS PARA INDITEX. |
||
|
|
||
|
10/01/2007 |
VANGUARDIA |
BRANCHES INFORMATION |
|
LA FIRMA ESPAÑOLA INDITEX HA ANUNCIADO QUE
INICIARA UNA NUEVA FASE DE EXPAN SION EN CHINA, EMPEZANDO POR PEKIN, EN
FEBRERO DEL CORRIENTE. LA EMPRESA YA CUENTA CON DOS ESTABLECIMIENTOS ZARA EN
SHANGHAI, Y DEBIDO AL POTENCIAL DE CRECIMIENTO, AÑADIRA DOS MAS, UNO EN
SHANGHAI Y OTRO EN PEKIN. EL GRUPO HA ABIERTO 15 TIENDAS EN ASIA EN EL ULTIMO
AÑO, Y PRETENDE CONSOLIDAR SU EXPAN SION. |
||
Complementary
Information
|
Por causas ajenas a nuestra voluntad el
deposito de cuentas del |
|
ejercicio 2004, se ha recibido
erroneamente. |
|
30/06/06 BLOQUE DE INVESTIGACION: |
|
- Actividad: comercio mayor de prendas de
vestir. |
|
- Direccion social: En Poligono Industrial
Sabon, Avenida Diputacion, |
|
s/n en Arteixo (La Coruna) en propiedad
(sin verificacion registral) |
|
destinado a oficina. |
|
---------------------------------------------------------------------- |
|
El bloque de Investigacion no esta sujeto
a actualizaciones sistemati- |
|
cas. Los datos mostrados fueron aportados
por las fuentes consultadas |
|
en la fecha del encabezamiento. |
Brands, Signs and
Commercial Names
|
Prevailing Brands |
|||||
|
Name: |
Q QFFINITY CARD |
||||
|
Kind of Brand: |
JOINT |
File: |
M2711477 |
||
|
Request Date: |
16/05/2006 |
Bulletin Date: |
Bulletin Date: |
Current situation: |
REGISTER REQUEST |
|
Types: 9 35
36 |
|
||||
|
Name: |
CLAR TO WEAR |
||||
|
Kind of Brand: |
JOINT |
File: |
M2706218 |
||
|
Request Date: |
12/04/2006 |
Bulletin Date: |
Bulletin Date: |
Current situation: |
REGISTER REQUEST |
|
Types: 42 |
|
||||
|
Name: |
OYSHO |
||||
|
Kind of Brand: |
DENOMINATIVE |
File: |
M2704957 |
||
|
Request Date: |
05/04/2006 |
Bulletin Date: |
Bulletin Date: |
Current situation: |
APPROVED REGISTER |
|
Types: 16 26
28 |
|
||||
|
Name: |
CLEAR TO WEAR |
||||
|
Kind of Brand: |
JOINT |
File: |
M2702662 |
||
|
Request Date: |
23/03/2006 |
Bulletin Date: |
Bulletin Date: |
Current situation: |
REGISTER REQUEST |
|
Types: 3 8
9 10 12 14 |
(There’s more
types) |
||||
|
Name: |
SKHUABAN |
||||
|
Kind of Brand: |
DENOMINATIVE |
File: |
M2689592 |
||
|
Request Date: |
16/01/2006 |
Bulletin Date: |
Bulletin Date: |
Current situation: |
APPROVED REGISTER |
|
Types: 3 5
9 10 12 14 |
(There’s more
types) |
||||
Total Marcas: 231
|
Commercial Experience |
|
|
|
PURCHASES |
|
Import Percentage:
40% |
|
Imports:: |
|
C.E., Paises Asiaticos |
|
|
|
SALES |
|
Export Percentage: 18% |
|
Exports:: |
|
C.E. EE.UU |
Branches
|
Road |
Postal Code |
Town |
Province |
|
INDUSTRIAL ONZONILLA |
24231 |
ONZONILLA |
LEON |
Bank Entities
|
Entity |
|
|
Town |
|
|
BANCO PASTOR, S.A. |
|
|
A CORUNA |
|
|
BANCO BILBAO VIZCAYA ARGENTARIA, S.A. |
|
|
ARTEIXO |
|
|
BANCO SANTANDER CENTRAL HISPANO, S.A. |
|
|
ARTEIXO |
|
|
BANCO SIMEON, S.A. |
|
|
ARTEIXO |
|
|
CAIXA AFORROS VIGO,OURENSE E PONTEVEDRA(CAIXANOVA) |
|
|
ARTEIXO |
|
|
CAJA DE AHORROS DE GALICIA |
|
|
ARTEIXO |
|
Balance Sheet
(ASSETS)
|
(Figures given in thousands of
Euros) |
31/01/2004 (12) |
31/01/2005 (12) |
31/01/2006 (12) |
|
|
|
A) DUE FROM SHAREHOLDERS FOR UNCALLED
CAPITAL |
|
|
|
|
|
B) FIXED ASSETS |
856.298,00 |
985.418,00 |
1.289.940,00 |
|
|
I. Establishment expenses |
86,00 |
43,00 |
|
|
|
II. Intangible assets |
6.666,00 |
10.591,00 |
10.361,00 |
|
|
Concessions, patents,licences , trademarks |
13.292,00 |
13.644,00 |
14.142,00 |
|
|
Acquired rights from finance leases |
|
45,00 |
45,00 |
|
|
Software |
2.812,00 |
3.182,00 |
4.279,00 |
|
|
Leasing |
1.897,00 |
5.048,00 |
5.048,00 |
|
|
Prepayments |
|
506,00 |
|
|
|
Amortization |
-11.335,00 |
-11.834,00 |
-13.153,00 |
|
|
III. Tangible assets |
290.675,00 |
281.535,00 |
309.068,00 |
|
|
Property, plant and equipment |
150.657,00 |
158.239,00 |
169.352,00 |
|
|
Machinery, equipment and other |
179.311,00 |
194.574,00 |
210.993,00 |
|
|
Other property plant and equipement |
6.752,00 |
7.357,00 |
12.333,00 |
|
|
Prepaid expenses on fixed assets |
9.412,00 |
2.050,00 |
20.495,00 |
|
|
Other assets |
55.535,00 |
56.701,00 |
60.306,00 |
|
|
Depreciation |
-110.992,00 |
-137.386,00 |
-164.411,00 |
|
|
IV. Financial assets |
558.782,00 |
693.160,00 |
970.422,00 |
|
|
Shares in affiliated companies |
738.281,00 |
845.304,00 |
1.084.679,00 |
|
|
Shares in associated companies |
53.008,00 |
89.412,00 |
89.412,00 |
|
|
Securities |
5.157,00 |
5.157,00 |
5.257,00 |
|
|
Other loans |
5.152,00 |
2.576,00 |
20.000,00 |
|
|
Long term deposits and guarantees |
408,00 |
645,00 |
646,00 |
|
|
Provisions |
-243.224,00 |
-249.934,00 |
-229.572,00 |
|
|
V. Owners equity |
89,00 |
89,00 |
89,00 |
|
|
VI. Long term trade liabilities |
|
|
|
|
|
C) DEFERRED EXPENSES |
328,00 |
750,00 |
567,00 |
|
|
D) CURRENT ASSETS |
942.594,00 |
1.120.972,00 |
1.387.643,00 |
|
|
I. Not paid in shareholder capital |
|
|
|
|
|
II. Inventory |
159.158,00 |
170.545,00 |
207.914,00 |
|
|
Goods available for sale |
136.915,00 |
148.982,00 |
188.821,00 |
|
|
Raw material inventory |
22.153,00 |
21.473,00 |
19.003,00 |
|
|
Cash advance |
90,00 |
90,00 |
90,00 |
|
|
III. Debtors |
307.888,00 |
310.788,00 |
375.373,00 |
|
|
Clients |
24.745,00 |
28.275,00 |
25.818,00 |
|
|
Amounts owned by affiliated companies |
254.903,00 |
249.973,00 |
299.394,00 |
|
|
Other debts |
390,00 |
1.916,00 |
1.409,00 |
|
|
Labor costs |
15,00 |
120,00 |
203,00 |
|
|
Taxes refunds |
27.835,00 |
32.327,00 |
48.629,00 |
|
|
Provisions |
|
-1.823,00 |
-80,00 |
|
|
IV. Short term financial assets |
402.950,00 |
610.330,00 |
798.075,00 |
|
|
Receivables in affiliated companies |
267.509,00 |
295.227,00 |
435.694,00 |
|
|
Other loans |
135.431,00 |
315.094,00 |
362.372,00 |
|
|
Short Term Deposit and guarantees |
10,00 |
9,00 |
9,00 |
|
|
V. Short term owners equity |
|
|
|
|
|
VI. Cash |
72.597,00 |
29.309,00 |
6.281,00 |
|
|
VII. Prepaid expenses and accrued income |
1,00 |
|
|
|
|
ASSETS (A + B + C + D) |
1.799.220,00 |
2.107.140,00 |
2.678.150,00 |
Balance Sheet
(LIABILITIES)
|
(Figures given in thousands of
Euros) |
31/01/2004 (12) |
31/01/2005 (12) |
31/01/2006 (12) |
|
|
|
A) SHAREHOLDERS EQUITY |
1.086.706,00 |
1.212.215,00 |
1.433.685,00 |
|
|
I. Capital |
93.500,00 |
93.500,00 |
93.500,00 |
|
|
II. Premium share account |
20.379,00 |
20.379,00 |
20.379,00 |
|
|
III. Revaluation reserve |
1.692,00 |
1.692,00 |
1.692,00 |
|
|
IV. Reserves |
698.400,00 |
752.974,00 |
797.445,00 |
|
|
Retained earnings |
18.700,00 |
18.700,00 |
18.700,00 |
|
|
Sinking fund from owner equity |
89,00 |
89,00 |
89,00 |
|
|
Other funds |
679.611,00 |
734.185,00 |
778.656,00 |
|
|
V. Prior year earnings |
|
|
|
|
|
VI. Prior year profit or losses |
272.735,00 |
343.670,00 |
520.669,00 |
|
|
VII. Dividend paid during the year |
|
|
|
|
|
VIII. Own shares for change in capital |
|
|
|
|
|
B) DEFERRED INCOME |
13.185,00 |
12.449,00 |
13.660,00 |
|
|
Rate difference |
478,00 |
|
1.468,00 |
|
|
Other deferred income |
12.707,00 |
12.449,00 |
12.192,00 |
|
|
C) PROVISIONS FOR LIABILITIES AND EXPENSES |
9.025,00 |
16.483,00 |
25.700,00 |
|
|
Provision for pensions plans |
52,00 |
52,00 |
52,00 |
|
|
Other provisions |
8.837,00 |
16.227,00 |
25.376,00 |
|
|
Reversion fund |
136,00 |
204,00 |
272,00 |
|
|
D) LONG TERM LIABILITIES |
34.579,00 |
42.658,00 |
49.208,00 |
|
|
I. Bonds |
|
|
|
|
|
II. Bank loans |
|
|
|
|
|
III. Debts with associed and affiliated
companies |
528,00 |
713,00 |
713,00 |
|
|
Debt with affiliated companies |
528,00 |
713,00 |
713,00 |
|
|
IV. Other creditors |
34.051,00 |
41.945,00 |
48.495,00 |
|
|
Other debts |
34.033,00 |
41.928,00 |
48.474,00 |
|
|
Long term deposit and guaranties |
18,00 |
17,00 |
21,00 |
|
|
V. Deferred debts on shares |
|
|
|
|
|
VI. Long term debt with creditor |
|
|
|
|
|
E) SHORT TERM LIABILITIES |
655.725,00 |
823.335,00 |
1.155.897,00 |
|
|
I. Negotiable bonds |
|
|
|
|
|
II. Bank loans |
215,00 |
349,00 |
296,00 |
|
|
Loans and other debts |
215,00 |
349,00 |
296,00 |
|
|
III. Short term debts with associated and
affiliated companies |
338.912,00 |
385.255,00 |
571.878,00 |
|
|
With affiliated companies |
338.912,00 |
385.255,00 |
571.878,00 |
|
|
IV. Trade creditors |
239.035,00 |
302.194,00 |
387.080,00 |
|
|
Accounts payable |
511,00 |
|
|
|
|
Expenses |
238.524,00 |
302.194,00 |
387.080,00 |
|
|
V. Other non trade payables |
77.563,00 |
135.536,00 |
196.291,00 |
|
|
Government |
64.099,00 |
110.298,00 |
170.657,00 |
|
|
Other debts |
8.337,00 |
15.329,00 |
13.926,00 |
|
|
Accounts receivable |
4.227,00 |
9.909,00 |
11.708,00 |
|
|
Short term deposits and guarantees |
900,00 |
|
|
|
|
VI. Provisions for current assets |
|
|
|
|
|
VII. Accruals and deferred incomes |
|
1,00 |
352,00 |
|
|
F) SHORT TERM PROVISIONS FOR LIABILITIES
AND EXPENSES |
|
|
|
|
|
LIABILITIES (A + B + C + D + E + F) |
1.799.220,00 |
2.107.140,00 |
2.678.150,00 |
Profit and Loss
Account
|
(Figures given in thousands of
Euros) |
31/01/2004 (12) |
31/01/2005 (12) |
31/01/2006 (12) |
|
|
|
A) EXPENSES (A.1 a A.16) |
|
|
|
|
|
A.1. Change in stocks of finished goods
and work in progress |
|
|
|
|
|
A.2. Supplies |
1.600.967,00 |
1.749.929,00 |
2.038.200,00 |
|
|
Material consumed |
1.331.569,00 |
1.458.851,00 |
1.706.834,00 |
|
|
Raw materials consumed |
255.836,00 |
273.600,00 |
309.371,00 |
|
|
Other expenses |
13.562,00 |
17.478,00 |
21.995,00 |
|
|
A.3. Labor cost |
47.164,00 |
53.743,00 |
69.239,00 |
|
|
Wages |
40.089,00 |
46.824,00 |
60.205,00 |
|
|
Social security expenses |
7.075,00 |
6.919,00 |
9.034,00 |
|
|
A.4. Assets depreciation |
26.013,00 |
27.509,00 |
28.417,00 |
|
|
A.5 Variance in provision for current
assets |
|
|
91,00 |
|
|
Variance in provision for bad debts |
|
|
91,00 |
|
|
A.6. Other operating costs |
123.778,00 |
151.855,00 |
190.343,00 |
|
|
External costs |
123.314,00 |
150.573,00 |
187.593,00 |
|
|
Taxes |
389,00 |
548,00 |
1.109,00 |
|
|
Other day to day expenses |
|
666,00 |
1.573,00 |
|
|
Allowance to reversion fund |
75,00 |
68,00 |
68,00 |
|
|
A.I. OPERATING RESULT
(B.1+B.2+B.3+B.4-A.1-A.2-A.3-A.4-A.5-A.6) |
101.174,00 |
105.609,00 |
97.024,00 |
|
|
A.7. Financial expenses |
3.822,00 |
3.728,00 |
6.380,00 |
|
|
Debts with related companies |
2.176,00 |
2.563,00 |
5.896,00 |
|
|
Debts with associated companies |
|
|
484,00 |
|
|
Other companies debts |
1.646,00 |
590,00 |
|
|
|
Losses from financial investments |
|
575,00 |
|
|
|
A.8. Variation in financial investments
provision |
|
|
|
|
|
A.9. Exchange losses |
10.543,00 |
11.753,00 |
7.267,00 |
|
|
A.II. POSITIVE FINANCIAL RESULTS
(B.5+B.6+B.7+B.8-A.7-A.8-A.9) |
198.915,00 |
232.503,00 |
385.013,00 |
|
|
A.III. PROFIT FROM ORDINARY ACTIVITIES
(A.I+A.II-B.I-B.II) |
300.089,00 |
338.112,00 |
482.037,00 |
|
|
A.10. Variation in provision in fixed
assets |
763,00 |
-9.709,00 |
-30.967,00 |
|
|
A.11. Losses in fixed assets |
|
157,00 |
4.152,00 |
|
|
A.12. Losses from shares and bonds |
|
|
|
|
|
A.13. Extraordinary charges |
1.209,00 |
|
1.025,00 |
|
|
A.14. Prior year’s expenses and losses |
2.416,00 |
988,00 |
222,00 |
|
|
A.IV. POSITIVE EXTRAORDINARY RESULT (B.9+B.10+B.11+B.12+B.13-A.10-A.11-A.12-A.13-A.14) |
|
11.669,00 |
26.245,00 |
|
|
A.V. EARNINGS / LOSS BEFORE TAXES
(A.III+A.IV-B.III-B.IV) |
297.430,00 |
349.781,00 |
508.282,00 |
|
|
A.15. Corporate Taxes |
24.635,00 |
6.111,00 |
-12.387,00 |
|
|
A.16. Other taxes |
60,00 |
|
|
|
|
A.VI. YEAR END RESULT (PROFIT)
(A.V-A.15-A.16) |
272.735,00 |
343.670,00 |
520.669,00 |
|
|
B) INCOMES (B.1 a B13) |
|
|
|
|
|
B.1. Turnover |
1.827.161,00 |
2.007.100,00 |
2.332.152,00 |
|
|
Sales |
1.950.628,00 |
2.108.343,00 |
2.401.573,00 |
|
|
Services provided |
14.704,00 |
20.365,00 |
19.668,00 |
|
|
Discounts |
-138.171,00 |
-121.608,00 |
-89.089,00 |
|
|
B.2. Increase in inventory of finished
goods |
|
|
|
|
|
B.3. Expenses capitalized |
|
|
|
|
|
B.4. Other operating income |
71.935,00 |
81.545,00 |
91.162,00 |
|
|
Other incomes |
70.480,00 |
81.244,00 |
90.814,00 |
|
|
Grants |
1.455,00 |
301,00 |
348,00 |
|
|
B.I. OPERATING LOSSES
(A.1+A.2+A.3+A.4+A.5+A.6-B.1-B.2-B.3-B.4) |
|
|
|
|
|
B.5. Incomes from share |
193.170,00 |
230.377,00 |
378.234,00 |
|
|
From affiliated companies |
193.170,00 |
230.263,00 |
378.088,00 |
|
|
From other companies |
|
114,00 |
146,00 |
|
|
B.6. Income from securities |
|
|
|
|
|
B.7. Other income from interrest |
8.341,00 |
8.680,00 |
12.915,00 |
|
|
From affiliated companies |
4.072,00 |
5.015,00 |
5.217,00 |
|
|
From associated companies |
|
|
7.698,00 |
|
|
From other companies |
4.244,00 |
3.664,00 |
|
|
|
Gains from investments |
25,00 |
1,00 |
|
|
|
B.8. Gains on exchange |
11.769,00 |
8.927,00 |
7.511,00 |
|
|
B.II. FINANCIAL LOSSES
(A.7+A.8+A.9-B.5-B.6-B.7-B.8) |
|
|
|
|
|
B.III. LOSSES FROM ORDINARY ACTIVITIES
(B.I+B.II-A.I-A.II) |
|
|
|
|
|
B.9. Gains from disposal of fixed assets |
|
3.017,00 |
28,00 |
|
|
B.10. Gains from dealing in own shares |
123,00 |
|
|
|
|
B.11. Paid in surplus |
|
|
|
|
|
B.12. Extraordinary income |
1.536,00 |
86,00 |
649,00 |
|
|
B.13. Prior year’s income and profits |
70,00 |
2,00 |
|
|
|
B.IV. EXTRAORDINARY LOSSES (A.10+A.11+A.12+A.13+A.14-B.9-B.10-B.11-B.12-B.13) |
2.659,00 |
|
|
|
|
B.V. LOSS BEFORE TAXES
(B.III+B.IV-A.III-A.IV) |
|
|
|
|
|
B.VI. NET LOSS (B.V+A.15+A.16) |
|
|
|
Main Ratios
|
(Figures given in thousands of
Euros) |
2.004 (12) |
2.005 (12) |
2.006 (12) |
|
|
|
ACTIVITY |
|
|
|
|
|
Increase of the Sales Figures |
14,44 |
9,85 |
16,20 |
|
|
Assets Turnover |
1,02 |
0,95 |
0,87 |
|
|
Productivity |
3,70 |
3,48 |
2,81 |
|
|
Increase of the Added Value |
4,63 |
7,18 |
4,23 |
|
|
PROFITABILITY |
|
|
|
|
|
Economic Profitability |
15,16 |
16,31 |
19,44 |
|
|
Financial Profitability |
25,10 |
28,35 |
36,32 |
|
|
Financial Expenses |
0,21 |
0,19 |
0,27 |
|
|
BALANCE (IN DAYS OF SALES) |
|
|
|
|
|
Customers’ Credit (In days of sales) |
61,00 |
56,00 |
58,00 |
|
|
Suppliers’ Credit (In days of sales) |
54,00 |
62,00 |
68,00 |
|
|
Working Capital (In days of sales) |
57,00 |
53,00 |
36,00 |
|
|
Working Capital Requirement (In days of
sales) |
0,00 |
0,00 |
0,00 |
|
|
Treasury (In days of sales) |
94,00 |
115,00 |
124,00 |
|
|
BALANCE |
|
|
|
|
|
Working Capital |
286.869,00 |
297.637,00 |
231.746,00 |
|
|
Working Capital Requirement |
-188.463,00 |
-341.653,00 |
-572.314,00 |
|
|
Treasury |
475.332,00 |
639.290,00 |
804.060,00 |
|
|
Balance Ratio |
1,34 |
1,30 |
1,18 |
|
|
SOLVENCY |
|
|
|
|
|
Borrowing Ratio |
38,37 |
41,10 |
45,00 |
|
|
Own / Permanent Funds |
95,03 |
94,42 |
94,18 |
|
|
Payback Capacity |
0,37 |
0,43 |
0,52 |
|
|
LIQUIDITY |
|
|
|
|
|
General Liquidity |
1,44 |
1,36 |
1,20 |
|
|
Immediate Liquidity |
0,73 |
0,78 |
0,70 |
Sectorial Analysis
Summary of Assets, Liability & Equity
|
(Figures given in Percentages) |
Company |
Sector |
Company |
|
|
2.006 |
|
|
|
Assets |
|||
|
DUE FROM SHAREHOLDERS
FOR UNCALLED CAPITAL |
0,00 |
0,25 |
-0,25 |
|
FIXED ASSETS |
48,17 |
32,00 |
16,17 |
|
ACCRUED EXPENSES |
0,02 |
0,22 |
-0,20 |
|
CURRENT ASSETS |
51,81 |
67,54 |
-15,73 |
|
TOTAL ASSETS |
100,00 |
100,00 |
0,00 |
|
Liabilities |
|||
|
SHAREHOLDERS EQUITY |
53,53 |
38,01 |
15,52 |
|
ACCRUED INCOME |
0,51 |
0,34 |
0,17 |
|
RISK AND EXPENDITURE
COVER |
0,96 |
2,61 |
-1,65 |
|
LONG-TERM CREDITORS |
1,84 |
7,71 |
-5,87 |
|
SHORT-TERM CREDITORS |
43,16 |
51,27 |
-8,11 |
|
SHORT-TERM RISK AND
EXPENDITURE COVER |
0,00 |
0,06 |
-0,06 |
|
TOTAL LIABILITIES |
100,00 |
100,00 |
0,00 |
Analytical Account of
Results
|
(Figures given in Percentages) |
Company |
Sector |
Company |
|
|
2.006 |
|
|
|
Net turnover |
96,24 |
97,44 |
-1,21 |
|
Other operating income |
3,76 |
2,56 |
1,21 |
|
Production Value |
100,00 |
100,00 |
0,00 |
|
Operating expenses |
84,11 |
71,63 |
12,48 |
|
Other operation expenses |
7,85 |
13,12 |
-5,26 |
|
Added value |
8,04 |
15,25 |
-7,22 |
|
Labor cost |
2,86 |
7,64 |
-4,78 |
|
Gross Economic Result |
5,18 |
7,62 |
-2,44 |
|
Assets depreciation |
1,17 |
1,15 |
0,02 |
|
Variation in provision
for current assets |
0,00 |
0,21 |
-0,20 |
|
Net Economic Result |
4,00 |
6,26 |
-2,26 |
|
Financial income |
16,45 |
1,40 |
15,05 |
|
Financial expenses |
0,56 |
1,08 |
-0,51 |
|
Variation in financial
investment provision |
0,00 |
-0,01 |
0,01 |
|
Ordinary Activities
Result |
19,89 |
6,60 |
13,29 |
|
Extraordinary income |
0,03 |
0,38 |
-0,35 |
|
Extraordinary expenses |
0,22 |
0,29 |
-0,06 |
|
Variation in provision
in fixed assets |
-1,28 |
0,59 |
-1,87 |
|
Results before Taxes |
20,97 |
6,10 |
14,87 |
|
Corporaye taxes |
-0,51 |
1,73 |
-2,24 |
|
Net Result |
21,49 |
4,37 |
17,11 |
|
Assets depreciation |
1,17 |
1,15 |
0,02 |
|
Provisions fund
variation |
-1,27 |
0,78 |
-2,06 |
|
Net Self-Financing |
21,38 |
6,31 |
15,08 |
Ratios
|
(Figures given in ) |
Company |
Ptile25 |
Medium |
Ptile75 |
|
|
2.006 |
|
|
|
|
ACTIVITY |
|
|
|
|
|
Increase of the Sales
Figures |
16,20 |
0,60 |
6,06 |
12,60 |
|
Assets Turnover |
0,87 |
1,44 |
2,11 |
3,43 |
|
Fixed Assets Turnover |
1,81 |
7,19 |
15,56 |
27,33 |
|
Increase of the Added
Value |
4,23 |
-1,85 |
5,53 |
16,32 |
|
PRODUCTIVITY |
|
|
|
|
|
Productivity |
2,81 |
1,34 |
1,79 |
2,28 |
|
Change of Personnel
Costs |
28,83 |
1,33 |
7,95 |
15,62 |
|
Average Personnel Costs |
|
26,34 |
34,69 |
56,86 |
|
Value Added by Employees |
|
42,32 |
66,20 |
115,80 |
|
CASH FLOW |
|
|
|
|
|
Cash Flow |
518.210,00 |
1.130,62 |
3.436,59 |
7.068,74 |
|
Operating Cash Flow |
125.532,00 |
1.549,91 |
4.578,43 |
9.512,00 |
|
Change in Cash Flow |
43,36 |
-24,30 |
0,14 |
26,47 |
|
PROFITABILITY |
|
|
|
|
|
Economic Profitability |
19,44 |
2,15 |
5,45 |
11,04 |
|
Financial Profitability |
36,32 |
8,65 |
17,01 |
29,51 |
|
Financial Expenses |
0,27 |
0,17 |
0,47 |
1,04 |
|
Gross Economic
Profitability |
4,69 |
4,63 |
9,98 |
18,39 |
|
Gross Financial
Profitability |
8,76 |
15,66 |
30,73 |
56,50 |
|
BALANCE (IN DAYS OF SALES) |
|
|
|
|
|
Customers’ Credit (In
days of sales) |
57,00 |
44,68 |
79,99 |
119,42 |
|
Suppliers’ Credit (In
days of sales) |
68,00 |
17,69 |
42,30 |
94,17 |
|
Working Capital (In days
of sales) |
35,00 |
7,10 |
26,89 |
61,79 |
|
Working Capital
Requirement (In days of sales) |
0,00 |
5,61 |
35,51 |
59,12 |
|
Treasury (In days of
sales) |
124,00 |
-19,83 |
-0,06 |
19,76 |
|
Operating Current Assets |
214,00 |
86,18 |
125,20 |
191,72 |
|
BALANCE |
|
|
|
|
|
Working Capital |
231.746,00 |
2.101,77 |
6.886,84 |
16.459,45 |
|
Working Capital
Requirement |
-572.314,00 |
1.111,82 |
6.579,74 |
17.334,78 |
|
Treasury |
804.060,00 |
-4.877,80 |
-14,95 |
4.705,93 |
|
Balance Ratio |
1,18 |
1,21 |
2,33 |
4,74 |
|
SOLVENCY |
|
|
|
|
|
Borrowing Ratio |
45,00 |
53,87 |
66,85 |
76,79 |
|
Own / Permanent Funds |
94,18 |
83,45 |
96,41 |
99,79 |
|
Payback Capacity |
0,52 |
0,18 |
0,27 |
0,42 |
|
Long term Indebtedness |
1,84 |
0,00 |
0,31 |
3,38 |
|
Gearing |
186,80 |
216,83 |
301,61 |
430,79 |
|
Financing Basic Ratio |
1,00 |
1,00 |
1,00 |
1,00 |
|
Assets Guarantee |
2,22 |
1,23 |
1,47 |
1,79 |
|
LIQUIDITY |
|
|
|
|
|
General Liquidity |
1,20 |
1,08 |
1,30 |
1,64 |
|
Immediate Liquidity |
0,70 |
0,02 |
0,09 |
0,32 |
RATING EXPLANATIONS
|
RATING |
STATUS |
PROPOSED CREDIT LINE |
|
|
>86 |
Aaa |
Possesses an extremely sound financial
base with the strongest capability for timely payment of interest and
principal sums |
Unlimited |
|
71-85 |
Aa |
Possesses adequate working capital. No
caution needed for credit transaction. It has above average (strong)
capability for payment of interest and principal sums |
Large |
|
56-70 |
A |
Financial & operational base are
regarded healthy. General unfavourable factors will not cause fatal effect.
Satisfactory capability for payment of interest and principal sums |
Fairly Large |
|
41-55 |
Ba |
Overall operation is considered normal.
Capable to meet normal commitments. |
Satisfactory |
|
26-40 |
B |
Unfavourable & favourable factors
carry similar weight in credit consideration. Capability to overcome financial
difficulties seems comparatively below average/normal. |
Small |
|
11-25 |
Ca |
Adverse factors are apparent. Repayment of
interest and principal sums in default or expected to be in default upon
maturity |
Limited with full security |
|
<10 |
C |
Absolute credit risk exists. Caution
needed to be exercised |
Credit not recommended |
|
NR |
In view of the lack of information, we
have no basis upon which to recommend credit dealings |
No Rating |
|