
MIRA
INFORM REPORT
|
Report Date : |
17.01.2007 |
IDENTIFICATION DETAILS
|
Name : |
BSV
ELECTRONIC SL |
|
|
|
|
Registered Office : |
Calle
Almogavers, 21, 08401 Granollers ( |
|
|
|
|
Country : |
|
|
|
|
|
Financials (as on) : |
31.12.2005 |
|
|
|
|
Date of Incorporation : |
20/12/1984 |
|
|
|
|
Legal Form : |
Limited
Liability Company |
|
|
|
|
Line of Business : |
Wholesale
of radioelectric appliance |
RATING & COMMENTS
|
MIRA’s Rating : |
A |
|
RATING |
STATUS |
PROPOSED CREDIT LINE |
|
|
56-70 |
A |
Financial & operational base are
regarded healthy. General unfavourable factors will not cause fatal effect.
Satisfactory capability for payment of interest and principal sums |
Fairly Large |
|
Status : |
Good |
|
|
|
|
Payment Behaviour : |
Regular |
|
|
|
|
Litigation : |
Clear |
Identification and
Characteristics
|
Tax Number |
B08960718 |
|
NAME |
BSV ELECTRONIC SL |
|
FORMER NAME |
BSV ELECTRONIC SA |
|
BUSINESS
ADDRESS |
CALLE ALMOGAVERS, 21 |
|
Postcode |
08401 GRANOLLERS ( |
|
URL |
http://www.bsvelectronic.com |
|
TELEPHONE |
938615115 |
|
FAX |
938615299 |
|
LEGAL FORM |
LIMITED LIABILITY COMPANY |
|
DATE FOUNDED |
20/12/1984 |
|
CAPITAL |
85.400,97 Euros |
|
NUMBER OF
EMPLOYEES |
9 |
|
ACTIVITY |
1615400 - Wholesale of
radioelectric appliance |
|
CNAE |
5143 - Wholesale of electrical
household appliances and radio and television goods |
|
* Characteristics of the main address |
|
|
According to our investigations
dated 16/01/2007 it is a/an office, warehouse
property rented and it is located in an area secondary Clarifications: Domicilio Social |
|
Synthesis
|
FINANCIAL SITUATION (Year
ending: 31/12/2005) |
||
|
|
|
|
|
PROFITABILITY |
|
6/9 Average |
|
TREASURY |
|
9/9 Excellent |
|
BALANCE SHEET |
|
9/9 Excellent |
|
DEBT |
|
6/9 Medium |
|
INCIDENTS |
||
|
|
|
|
|
COMMITMENTS |
|
9/9 Respected |
|
INCIDENTS |
|
9/9 None
or Negligible |
|
PREVIOUS EXPERIENCE |
||
|
|
|
|
|
PREVIOUS
EXPERIENCE |
|
8/9 Favourable |
Credit Appraisal
|
CREDIT ACCORDING TO OBJECTIVE DATA (From 0
to 6.000.000,00 Euros): |
|
FAVOURABLE TOWARDS 92.002,93
Max. |
|
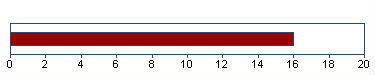
SOLVENCY RATING: |
|
16/20 (BASED ON HOMOGENEOUS
FORMULATION) |
|
|
|
|
Financial Elements
Figures given in
Euros
|
|
Balance
sheet 2.003 (12) |
Balance sheet 2.004
(12) |
Balance sheet 2.005
(12) |
% Sales |
|
|
SALES |
1.640.998,54 |
1.867.976,51 |
3.217.913,03 |
|
|
|
ADDED VALUE |
357.636,67 |
410.034,71 |
789.416,00 |
24,53 |
|
|
BUSINESS RESULT |
98.714,24 |
67.540,91 |
191.944,67 |
5,96 |
|
|
OWN FUNDS |
490.031,59 |
543.572,50 |
735.517,17 |
|
|
|
DEBT |
593.359,00 |
578.212,30 |
1.159.190,41 |
|
|
|
TOTAL ASSET |
1.083.390,59 |
1.121.784,80 |
1.894.707,58 |
|
|
|
The sales of 3.217.913,03
Euros show a change of 72,27% compared with
2.004 . Between 2.003 and 2.004 , this
change was 13,83% . |
|||||
|
Added value grew by 92,52%
compared with the previous year. Shareholders equity are 735.517,17
Euros for an indebtedness of 1.159.190,41 Euros
. |
|||||
|
The result 191.944,67
Euros means financial profitability of 26,10% and
economic profitability of 10,13% . This result means growth of
184,19% compared with the 2.004 . |
|||||
|
|
|||||
|
THE FIGURES FOR THE LAST BALANCE SHEET ARE
RELEVANT: |
|||||
|
SOURCE: FROM THE MERCANTILE REGISTER |
|||||
|
DATE: 19/12/2006 |
|||||
|
|
|
||||
|
Results Distribution |
|||||
|
Annual Report Year Source: 2.005 |
|||||
|
Figures given in Euros |
|||||
|
Distribution Base |
|||||
|
Profit and Loss |
191.945 |
||||
|
Total of Amounts to be
distributed |
191.945 |
||||
|
Distribution a |
|||||
|
Voluntary Reserve |
191.945 |
||||
Comparative Sector
Analysis
|
|
Company |
Sector |
Difference |
|
|
(2.005) |
|
|
|
% of PRODUCTION VALUE |
|
|
|
|
SALES |
99,85 |
98,86 |
0,99 |
|
ADDED
VALUE |
24,49 |
16,37 |
8,12 |
|
BUSINESS
RESULT |
5,96 |
2,69 |
3,27 |
|
% OF TOTAL ASSETS |
|
|
|
|
OWN
FUNDS |
38,82 |
36,34 |
2,48 |
|
DEBT |
61,18 |
63,66 |
-2,48 |
Compared sector (CNAE): 514 - Comercio al por mayor de
productos de consumo, distinto de los alimenticios
Number of companies: 873
Size (Sales Figure): 2.800.000,00 - 7.000.000,00 Euros
The turnover of the company is 0,99%
above the mean for the sector.
The company’s added value was 24,49%
s/ the production value, and 8,12% above the mean for the sector.
The company’s business result was
5,96% of the PV, 3,27% above the mean for the sector.
The company’s own resources are 38,82%
, 2,48% above the mean for the sector.
The company’s outside resources are
61,18% , 2,48% below the mean for the sector.
Legal Actions
No legal
incidences registered for this company in the official source
No claims
registered for this company in the official sources
AFFECTED BY:
No significant elemento
Main Board members,
Directors and Auditor
|
Position |
Surname and name |
Date of appointment |
|
SOLE ADMINISTRATOR |
|
06/09/2006 |
Functional Managers
|
Position |
Surname and name |
Date of appointment |
|
FINANCIAL MANAGER |
DOMINGUEZ PILAR |
09/06/2006 |
|
COMMERCIAL MANAGER |
|
09/06/2006 |
Financial Links
|
Shareholders |
||||
|
Company Name |
|
|
Source |
Information Date |
|
|
|
Indet. |
OWN SOURCES |
16/01/2007 |
|
|
|
Indet. |
OWN SOURCES |
16/01/2007 |
|
Shareholdings |
|||||
|
Company Name |
CIF/Country |
Percent. |
Source |
Information Date |
|
|
|
B58988429 |
0,00% |
OWN SOURCES |
18/01/1999 |
|
|
|
Company with solvency rating
below 7 |
||||
Proceedings published
in the B.O.R.M.E. (Official Mercantile Register Gazette)
|
Proceedings |
Date |
Notice Num. |
Mercantile Reg. |
|
Registration of accounts
(2005) |
08/01/2007 |
036744 |
|
|
Capital increase |
22/09/2006 |
461778 |
|
|
Fusion by absorption |
22/09/2006 |
461778 |
|
|
Change of legal form |
06/09/2006 |
437309 |
|
|
Appointments |
06/09/2006 |
437309 |
|
Press articles
|
|
||
|
27/04/2006 |
MARCA |
LEGAL ANNOUNCE |
|
LAS JUNTAS GENERALES DE B.S.V. ELECTRONIC,
S.L. (SDAD. ABSORBENTE) Y DE LUZ IMPORT, S.L. (SDAD. ABSORBIDA), CELEBRADAS
EL 31/03/06, ACORDARON LA FUSION POR ABSORCION DE LAS CITADAS EMPRESAS. |
||
Complementary
Information
|
16/01/07 BLOQUE DE INVESTIGACION: |
|
- Domicilio social: C/ Almogavers, 21 de
Granollers en |
|
una oficina y almacen en regimen de
alquiler. |
|
- Sucursal: Pg. Ind Sector V C/ Ribera del
Gogulf, 40 de Les Franque- |
|
ses de Valles en |
|
---------------------------------------------------------------------- |
|
El bloque de investigacion o esta sujeto a
actualizaciones sistemati- |
|
cas.Los datos mostrados fueron aportados
por las fuentes consultadas |
|
en la fecha |
Remarks for customer
The correct name is the indicated one in
this report.
Brands, Signs and
Commercial Names
|
Prevailing Brands |
|||||
|
Name: |
BSV. BSV ELECTRONIC, |
||||
|
Kind of Brand: |
JOINT |
File: |
M2532071 |
||
|
Request Date: |
21/03/2003 |
Bulletin Date: |
Bulletin Date: |
Current situation: |
APPROVED REGISTER |
|
Types: 35 |
|
||||
Total Marcas: 1
|
Commercial Experience |
Branches
|
Road |
Postal Code |
Town |
Province |
|
RIBERA DEL GOGULF |
08520 |
LES FRANQUESES |
|
Bank Entities
|
Entity |
Branch |
Branch Address |
Town |
Province |
|
BANCO DE |
0034 |
C JOAN PRIM 000036 |
GRANOLLERS |
|
|
BANCO POPULAR |
0042 |
PL. MALUQUER I |
GRANOLLERS |
|
|
BANCO |
4946 |
PL. PERPINYA, 23-25 |
GRANOLLERS |
|
The information on the last account
contained in this report is extracted from the Mercantile Register file of the
legal address of the Company and dated 19/12/2006
Balance Sheet
(ASSETS)
|
(Figures given in Euros) |
31/12/2003 (12) |
31/12/2004 (12) |
31/12/2005 (12) |
|
|
|
A) DUE FROM SHAREHOLDERS FOR UNCALLED
CAPITAL |
|
|
|
|
|
B) FIXED ASSETS |
266.739,49 |
380.530,77 |
396.221,24 |
|
|
I. Establishment expenses |
|
|
|
|
|
II. Intangible assets |
186.032,36 |
170.918,78 |
132.371,66 |
|
|
III. Tangible assets |
80.695,11 |
79.599,97 |
132.158,07 |
|
|
IV. Financial assets |
12,02 |
130.012,02 |
131.691,51 |
|
|
V. Owners equity |
|
|
|
|
|
VI. Long term trade liabilities |
|
|
|
|
|
C) DEFERRED EXPENSES |
7.605,61 |
4.826,23 |
2.932,79 |
|
|
D) CURRENT ASSETS |
809.045,49 |
736.427,80 |
1.495.553,55 |
|
|
I. Not paid in shareholder capital |
|
|
|
|
|
II. Inventory |
205.825,32 |
210.902,44 |
229.548,67 |
|
|
III. Debtors |
507.188,72 |
494.400,93 |
923.998,02 |
|
|
IV. Short term financial assets |
72,12 |
1.547,72 |
8.525,58 |
|
|
V. Short term owners equity |
|
|
|
|
|
VI. Cash |
95.959,33 |
29.576,71 |
333.481,28 |
|
|
VII. Prepaid expenses and accrued income |
|
|
|
|
|
ASSETS (A + B + C + D) |
1.083.390,59 |
1.121.784,80 |
1.894.707,58 |
Balance Sheet
(LIABILITIES)
|
(Figures given in Euros) |
31/12/2003 (12) |
31/12/2004 (12) |
31/12/2005 (12) |
|
|
|
A) SHAREHOLDERS EQUITY |
490.031,59 |
543.572,50 |
735.517,17 |
|
|
I. Capital |
60.101,21 |
60.101,21 |
60.101,21 |
|
|
II. Premium share account |
|
|
|
|
|
III. Revaluation reserve |
|
|
|
|
|
IV. Reserves |
331.216,14 |
415.930,38 |
483.471,29 |
|
|
Sundry reserves |
331.216,14 |
415.930,38 |
483.471,29 |
|
|
V. Prior year earnings |
|
|
|
|
|
VI. Prior year profit or losses |
98.714,24 |
67.540,91 |
191.944,67 |
|
|
VII. Dividend paid during the year |
|
|
|
|
|
VIII. Own shares for change in capital |
|
|
|
|
|
B) DEFERRED INCOME |
|
|
|
|
|
C) PROVISIONS FOR LIABILITIES AND EXPENSES |
|
|
|
|
|
D) LONG TERM LIABILITIES |
125.531,55 |
49.982,99 |
353.267,62 |
|
|
E) SHORT TERM LIABILITIES |
467.827,45 |
528.229,31 |
805.922,79 |
|
|
F) SHORT TERM PROVISIONS FOR LIABILITIES
AND EXPENSES |
|
|
|
|
|
LIABILITIES (A + B + C + D + E + F) |
1.083.390,59 |
1.121.784,80 |
1.894.707,58 |
Profit and Loss
Account
|
(Figures given in Euros) |
31/12/2003 (12) |
31/12/2004 (12) |
31/12/2005 (12) |
|
|
|
A) EXPENSES (A.1 a A.15) |
|
|
|
|
|
A.1 Operating Expenses |
1.180.889,64 |
1.343.981,73 |
2.097.851,72 |
|
|
A.3. Labor cost |
206.494,49 |
287.450,65 |
473.690,24 |
|
|
Wages |
169.102,45 |
228.664,43 |
379.844,23 |
|
|
Social security expenses |
37.392,04 |
58.786,22 |
93.846,01 |
|
|
A.3. Assets depreciation |
26.187,19 |
26.442,25 |
31.107,04 |
|
|
A.4. Variance in provision for current
assets |
918,57 |
5.188,17 |
15.242,12 |
|
|
A.5. Other operating costs |
119.054,97 |
131.492,03 |
335.538,39 |
|
|
A.I. OPERATING RESULT
(B.1-A.1-A.2-A.3-A.4-A.5) |
124.036,42 |
90.953,64 |
269.376,60 |
|
|
A.6. Financial expenses |
9.555,30 |
3.974,20 |
14.481,54 |
|
|
Debts with related companies |
|
179,21 |
1.378,38 |
|
|
Other companies debts |
9.555,30 |
3.794,99 |
13.103,16 |
|
|
A.7. Variation in financial investments
provision |
|
|
|
|
|
A.8. Exchange losses |
65,38 |
36,79 |
0,01 |
|
|
A.II. POSITIVE FINANCIAL RESULTS
(B.2+B.3-A.6-A.7-A.8) |
|
|
|
|
|
A.III. PROFIT FROM ORDINARY ACTIVITIES
(A.I+A.II-B.I-B.II) |
116.133,62 |
87.855,82 |
267.390,90 |
|
|
A.9. Variation in provision in fixed
assets |
|
|
|
|
|
A.10. Losses in fixed assets |
|
|
|
|
|
A.11. Losses from shares and bonds |
|
|
|
|
|
A.12. Extraordinary charges |
21.847,17 |
2.759,74 |
488,76 |
|
|
A.13. Prior year’s expenses and losses |
190,28 |
|
|
|
|
A.IV. POSITIVE EXTRAORDINARY RESULT (B.4+B.5+B.6+B.7+B.8-A.9-A.10-A.11-A.12-A.13) |
28.799,69 |
9.169,53 |
11.471,73 |
|
|
A.V. EARNINGS / LOSS BEFORE TAXES
(A.III+A.IV-B.III-B.IV) |
144.933,31 |
97.025,35 |
278.862,63 |
|
|
A.14. Corporate Taxes |
46.219,07 |
29.484,44 |
86.917,96 |
|
|
A.15. Other taxes |
|
|
|
|
|
A.VI. YEAR END RESULT (PROFIT)
(A.V-A.14-A.15) |
98.714,24 |
67.540,91 |
191.944,67 |
|
|
B) INCOMES (B.1 a B.8) |
|
|
|
|
|
B.1. Operating income |
1.657.581,28 |
1.885.508,47 |
3.222.806,11 |
|
|
Turnover |
1.640.998,54 |
1.867.976,51 |
3.217.913,03 |
|
|
Other operating income |
16.582,74 |
17.531,96 |
4.893,08 |
|
|
B.I. OPERATING LOSSES
(A.1+A.2+A.3+A.4+A.5-B.1) |
|
|
|
|
|
B.2. Financial Income |
708,57 |
482,80 |
7.652,62 |
|
|
In affiliated companies |
|
388,95 |
244,06 |
|
|
Other |
708,57 |
93,85 |
6.082,34 |
|
|
Gains from investments |
|
|
1.326,22 |
|
|
B.3. Gains on exchange |
1.009,31 |
430,37 |
4.843,23 |
|
|
B.II. FINANCIAL LOSSES
(A.6+A.7+A.8-B.2-B.3) |
7.902,80 |
3.097,82 |
1.985,70 |
|
|
B.III. LOSSES FROM ORDINARY ACTIVITIES
(B.I+B.II-A.I-A.II) |
|
|
|
|
|
B.4. Gains from disposal of fixed assets |
|
|
|
|
|
B.5. Gains from dealing in own shares |
|
|
|
|
|
B.6. Paid in surplus |
|
|
|
|
|
B.7. Extraordinary income |
50.837,14 |
11.929,27 |
11.960,49 |
|
|
B.8. Prior year’s income and profits |
|
|
|
|
|
B.IV. EXTRAORDINARY LOSSES (A.9+A.10+A.11+A.12+A.13-B.4-B.5-B.6-B.7-B.8) |
|
|
|
|
|
B.V. LOSS BEFORE TAXES
(B.III+B.IV-A.III-A.IV) |
|
|
|
|
|
B.VI. NET LOSS (B.V+A.14+A.15) |
|
|
|
Main Ratios
|
(Figures given in Euros) |
2.003 (12) |
2.004 (12) |
2.005 (12) |
|
|
|
ACTIVITY |
|
|
|
|
|
Increase of the Sales Figures |
15,00 |
13,83 |
72,27 |
|
|
Assets Turnover |
1,52 |
1,67 |
1,70 |
|
|
Productivity |
1,73 |
1,43 |
1,67 |
|
|
Increase of the Added Value |
27,60 |
14,65 |
92,52 |
|
|
PROFITABILITY |
|
|
|
|
|
Economic Profitability |
9,11 |
6,02 |
10,13 |
|
|
Financial Profitability |
20,14 |
12,43 |
26,10 |
|
|
Financial Expenses |
0,58 |
0,21 |
0,45 |
|
|
BALANCE (IN DAYS OF SALES) |
|
|
|
|
|
Customers’ Credit (In days of sales) |
111,00 |
95,00 |
103,00 |
|
|
Suppliers’ Credit (In days of sales) |
|
|
|
|
|
Working Capital (In days of sales) |
75,00 |
40,00 |
77,00 |
|
|
Working Capital Requirement (In days of
sales) |
54,00 |
34,00 |
39,00 |
|
|
Treasury (In days of sales) |
21,00 |
6,00 |
38,00 |
|
|
BALANCE |
|
|
|
|
|
Working Capital |
341.218,04 |
208.198,49 |
689.630,76 |
|
|
Working Capital Requirement |
245.186,59 |
177.074,06 |
347.623,90 |
|
|
Treasury |
96.031,45 |
31.124,43 |
342.006,86 |
|
|
Balance Ratio |
2,24 |
1,54 |
2,73 |
|
|
SOLVENCY |
|
|
|
|
|
Borrowing Ratio |
54,77 |
51,54 |
61,18 |
|
|
Own / Permanent Funds |
79,61 |
91,58 |
67,55 |
|
|
Payback Capacity |
0,36 |
0,30 |
0,36 |
|
|
LIQUIDITY |
|
|
|
|
|
General Liquidity |
1,73 |
1,39 |
1,86 |
|
|
Immediate Liquidity |
0,21 |
0,06 |
0,42 |
Sectorial Analysis
Summary of Assets, Liability & Equity
|
(Figures given in Percentages) |
Company |
Sector |
Company |
|
|
2.005 |
|
|
|
Assets |
|||
|
DUE FROM SHAREHOLDERS
FOR UNCALLED CAPITAL |
0,00 |
0,02 |
-0,02 |
|
FIXED ASSETS |
20,91 |
21,76 |
-0,85 |
|
ACCRUED EXPENSES |
0,15 |
0,39 |
-0,24 |
|
CURRENT ASSETS |
78,93 |
77,82 |
1,11 |
|
TOTAL ASSETS |
100,00 |
100,00 |
0,00 |
|
Liabilities |
|||
|
SHAREHOLDERS EQUITY |
38,82 |
36,34 |
2,48 |
|
ACCRUED INCOME |
0,00 |
0,11 |
-0,11 |
|
RISK AND EXPENDITURE
COVER |
0,00 |
0,14 |
-0,14 |
|
LONG-TERM CREDITORS |
18,64 |
8,05 |
10,59 |
|
SHORT-TERM CREDITORS |
42,54 |
55,30 |
-12,76 |
|
SHORT-TERM RISK AND
EXPENDITURE COVER |
0,00 |
0,05 |
-0,05 |
|
TOTAL LIABILITIES |
100,00 |
100,00 |
0,00 |
Analytical Account of
Results
|
(Figures given in Percentages) |
Company |
Sector |
Company |
|
|
2.005 |
|
|
|
Net turnover |
99,85 |
98,86 |
0,99 |
|
Other operating income |
0,15 |
1,14 |
-0,99 |
|
Production Value |
100,00 |
100,00 |
0,00 |
|
Operating expenses |
65,09 |
72,58 |
-7,49 |
|
Other operation expenses |
10,41 |
11,05 |
-0,64 |
|
Added value |
24,49 |
16,37 |
8,13 |
|
Labor cost |
14,70 |
10,26 |
4,44 |
|
Gross Economic Result |
9,80 |
6,11 |
3,69 |
|
Assets depreciation |
0,97 |
1,20 |
-0,24 |
|
Variation in provision
for current assets |
0,47 |
0,27 |
0,20 |
|
Net Economic Result |
8,36 |
4,63 |
3,73 |
|
Financial income |
0,39 |
0,55 |
-0,16 |
|
Financial expenses |
0,45 |
1,44 |
-0,99 |
|
Variation in financial
investment provision |
0,00 |
0,00 |
-0,00 |
|
Ordinary Activities
Result |
8,30 |
3,73 |
4,56 |
|
Extraordinary income |
0,37 |
0,32 |
0,05 |
|
Extraordinary expenses |
0,02 |
0,19 |
-0,17 |
|
Variation in provision
in fixed assets |
0,00 |
-0,00 |
0,00 |
|
Results before Taxes |
8,65 |
3,87 |
4,79 |
|
Corporaye taxes |
2,70 |
1,17 |
1,52 |
|
Net Result |
5,96 |
2,69 |
3,26 |
|
Assets depreciation |
0,97 |
1,20 |
-0,24 |
|
Provisions fund
variation |
0,47 |
0,28 |
0,20 |
|
Net Self-Financing |
7,39 |
4,17 |
3,22 |
Ratios
|
(Figures given in ) |
Company |
Ptile25 |
Medium |
Ptile75 |
|
|
2.005 |
|
|
|
|
ACTIVITY |
|
|
|
|
|
Increase of the Sales
Figures |
72,27 |
-6,12 |
3,81 |
13,57 |
|
Assets Turnover |
1,70 |
1,31 |
1,78 |
2,37 |
|
Fixed Assets Turnover |
8,06 |
5,70 |
12,54 |
32,35 |
|
Increase of the Added
Value |
92,52 |
-6,19 |
4,59 |
16,21 |
|
PRODUCTIVITY |
|
|
|
|
|
Productivity |
1,67 |
1,32 |
1,56 |
2,05 |
|
Change of Personnel
Costs |
64,79 |
1,58 |
9,18 |
18,86 |
|
Average Personnel Costs |
23.684,51 |
18.053,72 |
23.520,82 |
31.450,00 |
|
Value Added by Employees |
39.470,80 |
28.000,10 |
38.672,06 |
58.371,37 |
|
CASH FLOW |
|
|
|
|
|
Cash Flow |
238.293,83 |
66.552,81 |
123.964,12 |
216.216,45 |
|
Operating Cash Flow |
315.725,76 |
105.033,88 |
193.014,24 |
322.733,08 |
|
Change in Cash Flow |
140,28 |
-23,99 |
0,12 |
24,28 |
|
PROFITABILITY |
|
|
|
|
|
Economic Profitability |
10,13 |
1,42 |
3,12 |
6,27 |
|
Financial Profitability |
26,10 |
5,66 |
11,27 |
19,12 |
|
Financial Expenses |
0,45 |
0,37 |
0,93 |
1,78 |
|
Gross Economic
Profitability |
16,66 |
5,32 |
8,97 |
13,68 |
|
Gross Financial
Profitability |
42,93 |
17,79 |
30,41 |
48,63 |
|
BALANCE (IN DAYS OF SALES) |
|
|
|
|
|
Customers’ Credit (In
days of sales) |
103,00 |
44,99 |
80,54 |
114,48 |
|
Suppliers’ Credit (In
days of sales) |
|
0,00 |
0,00 |
0,00 |
|
Working Capital (In days
of sales) |
77,00 |
16,02 |
36,70 |
75,15 |
|
Working Capital
Requirement (In days of sales) |
38,00 |
-4,48 |
18,23 |
50,38 |
|
Treasury (In days of
sales) |
38,00 |
4,79 |
15,84 |
34,84 |
|
Operating Current Assets |
167,00 |
121,50 |
163,60 |
215,88 |
|
BALANCE |
|
|
|
|
|
Working Capital |
689.630,76 |
162.491,10 |
403.449,51 |
804.100,16 |
|
Working Capital
Requirement |
347.623,90 |
-46.803,27 |
184.589,29 |
543.741,63 |
|
Treasury |
342.006,86 |
50.250,00 |
163.715,65 |
379.357,16 |
|
Balance Ratio |
2,73 |
1,38 |
2,44 |
5,29 |
|
SOLVENCY |
|
|
|
|
|
Borrowing Ratio |
61,18 |
52,99 |
69,15 |
80,92 |
|
Own / Permanent Funds |
67,55 |
72,44 |
92,64 |
100,00 |
|
Payback Capacity |
0,36 |
0,24 |
0,35 |
0,49 |
|
Long term Indebtedness |
18,64 |
0,00 |
2,26 |
10,69 |
|
Gearing |
257,60 |
212,72 |
324,18 |
524,08 |
|
Financing Basic Ratio |
1,00 |
1,00 |
1,00 |
1,00 |
|
Assets Guarantee |
1,63 |
1,20 |
1,40 |
1,86 |
|
LIQUIDITY |
|
|
|
|
|
General Liquidity |
1,86 |
1,12 |
1,31 |
1,72 |
|
Immediate Liquidity |
0,42 |
0,06 |
0,15 |
0,39 |
RATING EXPLANATIONS
|
RATING |
STATUS |
PROPOSED CREDIT LINE |
|
|
>86 |
Aaa |
Possesses an extremely sound financial
base with the strongest capability for timely payment of interest and
principal sums |
Unlimited |
|
71-85 |
Aa |
Possesses adequate working capital. No
caution needed for credit transaction. It has above average (strong)
capability for payment of interest and principal sums |
Large |
|
56-70 |
A |
Financial & operational base are regarded
healthy. General unfavourable factors will not cause fatal effect.
Satisfactory capability for payment of interest and principal sums |
Fairly Large |
|
41-55 |
Ba |
Overall operation is considered normal.
Capable to meet normal commitments. |
Satisfactory |
|
26-40 |
B |
Unfavourable & favourable factors
carry similar weight in credit consideration. Capability to overcome
financial difficulties seems comparatively below average/normal. |
Small |
|
11-25 |
Ca |
Adverse factors are apparent. Repayment of
interest and principal sums in default or expected to be in default upon
maturity |
Limited with full security |
|
<10 |
C |
Absolute credit risk exists. Caution
needed to be exercised |
Credit not recommended |
|
NR |
In view of the lack of information, we
have no basis upon which to recommend credit dealings |
No Rating |
|