
MIRA
INFORM REPORT
|
Report Date : |
15.01.2007 |
IDENTIFICATION DETAILS
|
Name : |
MARMOL
COMPAC SA |
|
|
|
|
Registered Office : |
|
|
|
|
|
Country : |
|
|
|
|
|
Financials (as on) : |
31.12.2004 |
|
|
|
|
Date of Incorporation : |
02/07/1975 |
|
|
|
|
Legal Form : |
Joint
Stock Company |
|
|
|
|
Line of Business : |
Cutting,
shaping & finishing of natural stone industry |
RATING & COMMENTS
|
MIRA’s Rating : |
A |
|
RATING |
STATUS |
PROPOSED CREDIT LINE |
|
|
56-70 |
A |
Financial & operational base are
regarded healthy. General unfavourable factors will not cause fatal effect.
Satisfactory capability for payment of interest and principal sums |
Fairly Large |
|
Status : |
Good |
|
|
|
|
Payment Behaviour : |
Regular |
|
|
|
|
Litigation : |
Clear |
Identification and
Characteristics
|
Tax Number |
A46079869 |
|
NAME |
MARMOL COMPAC SA |
|
TRADE NAME |
MARMOL COMPAC, S.A. |
|
BUSINESS
ADDRESS |
CARRETERA ALMANSA |
|
Postcode |
46727 REAL DE GANDIA ( |
|
URL |
http://www.compacmq.com |
|
TELEPHONE |
962954053 |
|
FAX |
962954151 |
|
LEGAL FORM |
JOINT STOCK COMPANY |
|
DATE FOUNDED |
02/07/1975 |
|
CAPITAL |
4.768.000,00 Euros |
|
PAID-UP CAPITAL |
4.768.000,00 Euros |
|
NUMBER OF
EMPLOYEES |
187 |
|
ACTIVITY |
1244200 - Cutting, shaping &
finishing of natural stone industry |
|
CNAE |
2670 - Cutting, shaping and
finishing of stone |
|
EXPORT COMPANY |
YES |
|
IMPORT COMPANY |
YES |
|
* Characteristics of the main address |
|
|
According to our investigations
dated 22/06/2006 it is
a/an office, factory, warehouse property owned;
with no official confirmation and it is located in an
area secondary |
|
Synthesis
|
FINANCIAL SITUATION (Year
ending: 31/12/2004) |
||
|
|
|
|
|
PROFITABILITY |
|
5/9 Medium |
|
TREASURY |
|
6/9 Average |
|
BALANCE SHEET |
|
7/9 Good |
|
DEBT |
|
6/9 Medium |
|
INCIDENTS |
||
|
|
|
|
|
COMMITMENTS |
|
9/9 Respected |
|
INCIDENTS |
|
9/9 None
or Negligible |
|
PREVIOUS EXPERIENCE |
||
|
|
|
|
|
PREVIOUS
EXPERIENCE |
|
9/9 Very
favourable |
Credit Appraisal
|
CREDIT ACCORDING TO OBJECTIVE DATA (From 0
to 6.000.000,00 Euros): |
|
FAVOURABLE TOWARDS 500.000,00
Max. Euros |
|
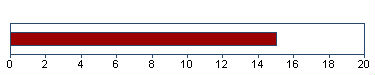
SOLVENCY RATING: |
|
15/20 (BASED ON HOMOGENEOUS
FORMULATION) |
|
|
|
Analysis made on 09/01/2007 |
Financial Elements
Figures given in
thousands of Euros
|
|
Balance
sheet 2.002 (12) |
Balance sheet 2.003
(12) |
Balance sheet 2.004
(12) |
% Sales |
|
|
SALES |
28.390,00 |
29.174,00 |
40.186,00 |
|
|
|
ADDED VALUE |
9.713,00 |
9.761,00 |
9.891,00 |
24,61 |
|
|
BUSINESS RESULT |
1.455,00 |
753,00 |
1.104,00 |
2,75 |
|
|
OWN FUNDS |
10.845,00 |
10.995,00 |
11.497,00 |
|
|
|
DEBT |
18.357,00 |
19.370,00 |
24.378,00 |
|
|
|
TOTAL ASSET |
29.277,00 |
30.409,00 |
36.280,00 |
|
|
|
The sales of 40.186,00
thousands of Euros show a change of 37,75% compared
with 2.003 . Between 2.002 and 2.003 , this
change was 2,76% . |
|||||
|
Added value grew by 1,33%
compared with the previous year. Shareholders equity are 11.497,00
thousands of Euros for an indebtedness of 24.378,00
thousands of Euros . |
|||||
|
The result 1.104,00 thousands
of Euros means financial profitability of 9,60% and
economic profitability of 3,04% . This result means growth of
46,61% compared with the 2.003 . |
|||||
|
|
|||||
|
THE FIGURES FOR THE LAST BALANCE SHEET ARE
RELEVANT: |
|||||
|
SOURCE: FROM THE MERCANTILE REGISTER |
|||||
|
DATE: 31/03/2006 |
|||||
|
|
|
||||
|
Results Distribution |
|||||
|
Annual Report Year Source: 2.004 |
|||||
|
Figures given in Euros |
|||||
|
Distribution Base |
|||||
|
Profit and Loss |
1.104.000 |
||||
|
Total of Amounts to be
distributed |
1.104.000 |
||||
|
Distribution a |
|||||
|
Retained earnings |
110.000 |
||||
|
Voluntary Reserve |
391.000 |
||||
|
Dividends |
603.000 |
||||
|
|
|||||
|
Auditors’ opinion: |
|||||
|
FAVOURABLE (2.004) |
|||||
|
|
|||||
|
Auditors: |
|||||
|
PRICEWATERHOUSECOOPERS AUDITORES SL |
|||||
Comparative Sector
Analysis
|
|
Company |
Sector |
Difference |
|
|
(2.004) |
|
|
|
% of PRODUCTION VALUE |
|
|
|
|
SALES |
97,27 |
99,15 |
-1,88 |
|
ADDED
VALUE |
23,94 |
28,91 |
-4,97 |
|
BUSINESS
RESULT |
2,67 |
6,47 |
-3,80 |
|
% OF TOTAL ASSETS |
|
|
|
|
OWN
FUNDS |
31,69 |
40,88 |
-9,19 |
|
DEBT |
67,19 |
59,12 |
8,07 |
Compared sector (CNAE): 267 - Industria de la piedra
Number of companies: 38
Size (Sales Figure): > 7.000.000,00 Euros
The turnover of the company is 1,88%
below the mean for the sector.
The company’s added value was 23,94%
s/ the production value, and 4,97% below the mean for the sector.
The company’s business result was
2,67% of the PV, 3,80% below the mean for the sector.
The company’s own resources are 31,69%
, 9,19% below the mean for the sector.
The company’s outside resources are
67,19% , 8,07% above the mean for the sector.
Legal Actions
|
LEGAL ACTIONS: 1 |
( Last 23/06/2000 ) |
|
|
|
|
|
0 |
|
|
1 |
|
No claims registered for this company in
the official sources |
|
|
AFFECTED BY: 2 Company /
Companies in Insolvency Proceedings |
|
|
Last Legal Actions |
|
(Figures given in Euros) |
|
|||||
|
|
|||||
|
|
Information Date |
Incidence Status |
Actor |
Amount |
|
|
|
23/06/2000 |
ATTACHMENT |
SANCHEZ ORTIZ
FELIPE |
3.907,66 |
|
|
Total: 1 |
|||||
Main Board members,
Directors and Auditor
|
Position |
Surname and name |
Date of appointment |
|
CHAIRMAN |
BRINES GRAU CARMEN |
15/10/2001 |
|
BOARD MEMBER |
SANCHIS BRINES FRANCISCO |
11/03/2003 |
|
BOARD MEMBER |
SANCHIS BRINES CARMEN |
11/03/2003 |
|
AUDITOR |
PRICEWATERHOUSECOOPERS SL |
22/02/2005 |
Functional Managers
|
Position |
Surname and name |
Date of appointment |
|
FINANCIAL MANAGER |
PICOT CALATAYUD VICENTE |
18/01/2005 |
|
COMMERCIAL MANAGER |
ZAPATERO RINCON JOSE LUIS |
18/01/2005 |
|
EXPORTS MANAGER |
ZAPATERO RINCON JOSE LUIS |
18/01/2005 |
Financial Links
|
Shareholders |
||||
|
Company Name |
CIF/Country |
|
Source |
Information Date |
|
SILICALIA SOCIEDAD LIMITADA. |
B96925342 |
94,95% |
M.REGISTER |
31/12/2004 |
|
SANCHIS BEL LAN FRANCISCO |
|
5,05% |
M.REGISTER |
31/12/2004 |
Proceedings published
in the B.O.R.M.E. (Official Mercantile Register Gazette)
|
Proceedings |
Date |
Notice Num. |
Mercantile Reg. |
|
Appointments |
11/04/2006 |
197638 |
|
|
Registration of accounts
(2004) |
07/12/2005 |
015263 |
|
|
Re-elections |
22/02/2005 |
081467 |
|
|
Registration of accounts
(2003) |
17/12/2004 |
940802 |
|
|
Registration of accounts
(2002) |
12/12/2003 |
931605 |
|
Press articles
|
|
||
|
28/12/2006 |
LAS PROVINCIAS |
BRANCHES INFORMATION |
|
LA EMPRESA VALENCIANA DE MARMOL COMPAC,
QUE PERTENECE A SILICALIA, INSTALARA EN BAZA UNA INDUSTRIA DE RECUBRIMIENTOS
DECORATIVOS QUE CREARA 40 PUESTOS DE TRABAJO EN EL PRIMER AÑO DE
FUNCIONAMIENTO Y HASTA 200 UNA VEZ CULMINADA LA SEGUNDA FASE DE SU
INSTALACION. LA CIA. INVERTIRA 23 MM. DE EUROS EN 2 AÑOS. |
||
|
|
||
|
08/11/2006 |
LEVANTE |
PRODUCTION DATA INFORMATION |
|
LA EMPRESA VALENCIANA COMPAC MARMOL &
QUARTZ PRODUCE AL AÑO MAS DE 2,5 MM DE MTS. CUADRADOS DE SUPERFICIES DE
MARMOL Y CUARZO. CON CENTROS DE PRODUCCION EN GANDIA ( |
||
Brands, Signs and
Commercial Names
|
Prevailing Brands |
|||||
|
Name: |
MCC COMPAC STONE |
||||
|
Kind of Brand: |
JOINT |
File: |
M2398158 |
||
|
Request Date: |
04/05/2001 |
Bulletin Date: |
Bulletin Date: |
Current situation: |
APPROVED REGISTER |
|
Types: 19 |
|
||||
|
Name: |
MCC COMPAC STONE |
||||
|
Kind of Brand: |
JOINT |
File: |
M2398159 |
||
|
Request Date: |
04/05/2001 |
Bulletin Date: |
Bulletin Date: |
Current situation: |
APPROVED REGISTER |
|
Types: 27 |
|
||||
|
Name: |
MCC COMPAC STONE |
||||
|
Kind of Brand: |
JOINT |
File: |
M2398160 |
||
|
Request Date: |
04/05/2001 |
Bulletin Date: |
Bulletin Date: |
Current situation: |
APPROVED REGISTER |
|
Types: 35 |
|
||||
|
Name: |
MCC COMPAC STONE |
||||
|
Kind of Brand: |
JOINT |
File: |
M2398161 |
||
|
Request Date: |
04/05/2001 |
Bulletin Date: |
Bulletin Date: |
Current situation: |
APPROVED REGISTER |
|
Types: 37 |
|
||||
|
Name: |
MCC COMPAC STONE |
||||
|
Kind of Brand: |
JOINT |
File: |
M2398162 |
||
|
Request Date: |
04/05/2001 |
Bulletin Date: |
Bulletin Date: |
Current situation: |
APPROVED REGISTER |
|
Types: 39 |
|
||||
Total Marcas: 26
|
|
|
Commercial Experience |
|
|
|
PURCHASES |
|
Import Percentage:
5% |
|
Imports:: |
|
|
|
|
|
SALES |
|
Collection (estimated) |
|
Cash sales percentage 40
% |
|
Credit sales percentage
60 % |
|
|
|
Export Percentage: 60% |
|
Exports:: |
|
U.E, JAPON, EXTREMO ORIENTE, USA, CHINA,
EMIRATOS ARABES, AUSTRALIA, FRANCIA Y FILIPINAS |
Bank Entities
|
Entity |
Branch |
Branch Address |
Town |
Province |
|
BANCO DE |
7340 |
PASSEIG DE LES GERMANIES 000046 |
GANDIA |
|
|
BANCO |
0332 |
PASEO DE GERMANIAS, 9 |
GANDIA |
|
|
BANCO GUIPUZCOANO, S.A. |
0154 |
PSO. GERMANIAS, 35 |
GANDIA |
|
|
|
9469 |
PLAZA DE CRISTO REY S/N |
GANDIA |
|
|
BANCO |
0061 |
|
GANDIA |
|
|
CAJA DE AHORROS DEL MEDITERRANEO |
|
|
|
|
|
BANCO VIZCAYA ARGENTARIA, S.A. |
2740 |
MAJOR, 69 (ESQUINA A GERMANIAS) |
GANDIA |
|
|
CAJA DE AHORROS Y M.P. |
9663 |
BENICANENA, 55 |
GANDIA |
|
The information on the last account
contained in this report is extracted from the Mercantile Register file of the
legal address of the Company and dated 31/03/2006
Balance Sheet
(ASSETS)
|
(Figures given in thousands of
Euros) |
31/12/2002 (12) |
31/12/2003 (12) |
31/12/2004 (12) |
|
|
|
A) DUE FROM SHAREHOLDERS FOR UNCALLED
CAPITAL |
|
|
|
|
|
B) FIXED ASSETS |
12.676,00 |
13.299,00 |
11.902,00 |
|
|
I. Establishment expenses |
|
|
|
|
|
II. Intangible assets |
1.399,00 |
1.495,00 |
1.268,00 |
|
|
R & D expenses |
420,00 |
420,00 |
504,00 |
|
|
Concessions, patents,licences , trademarks |
2,00 |
2,00 |
2,00 |
|
|
Software |
105,00 |
139,00 |
139,00 |
|
|
Leasing |
1.451,00 |
1.951,00 |
2.033,00 |
|
|
Prepayments |
34,00 |
|
|
|
|
Amortization |
-613,00 |
-1.017,00 |
-1.410,00 |
|
|
III. Tangible assets |
10.163,00 |
9.119,00 |
8.832,00 |
|
|
Property, plant and equipment |
4.897,00 |
4.985,00 |
5.053,00 |
|
|
Machinery, equipment and other |
14.755,00 |
15.289,00 |
16.536,00 |
|
|
Other property plant and equipement |
379,00 |
403,00 |
435,00 |
|
|
Other assets |
651,00 |
669,00 |
680,00 |
|
|
Depreciation |
-10.519,00 |
-12.227,00 |
-13.872,00 |
|
|
IV. Financial assets |
1.114,00 |
2.685,00 |
1.802,00 |
|
|
Loans to affiliated companies |
1.111,00 |
2.673,00 |
1.782,00 |
|
|
Other loans |
3.578,00 |
|
|
|
|
Long term deposits and guarantees |
3,00 |
12,00 |
20,00 |
|
|
Provisions |
-3.578,00 |
|
|
|
|
V. Owners equity |
|
|
|
|
|
VI. Long term trade liabilities |
|
|
|
|
|
C) DEFERRED EXPENSES |
107,00 |
74,00 |
40,00 |
|
|
D) CURRENT ASSETS |
16.494,00 |
17.036,00 |
24.338,00 |
|
|
I. Not paid in shareholder capital |
|
|
|
|
|
II. Inventory |
4.871,00 |
6.459,00 |
7.249,00 |
|
|
Goods available for sale |
852,00 |
1.087,00 |
3.498,00 |
|
|
Raw material inventory |
1.078,00 |
1.128,00 |
1.099,00 |
|
|
Work in Progress |
851,00 |
978,00 |
993,00 |
|
|
Finished goods |
2.137,00 |
3.266,00 |
1.659,00 |
|
|
Provisions |
-47,00 |
|
|
|
|
III. Debtors |
11.245,00 |
10.052,00 |
16.121,00 |
|
|
Clients |
10.653,00 |
9.940,00 |
14.435,00 |
|
|
Amounts owned by affiliated companies |
52,00 |
498,00 |
1.716,00 |
|
|
Other debts |
853,00 |
79,00 |
240,00 |
|
|
Taxes refunds |
74,00 |
210,00 |
278,00 |
|
|
Provisions |
-387,00 |
-675,00 |
-548,00 |
|
|
IV. Short term financial assets |
3,00 |
303,00 |
906,00 |
|
|
Receivables in affiliated companies |
|
297,00 |
891,00 |
|
|
Short term investment |
3,00 |
6,00 |
6,00 |
|
|
Short Term Deposit and guarantees |
|
|
9,00 |
|
|
V. Short term owners equity |
|
|
|
|
|
VI. Cash |
303,00 |
186,00 |
18,00 |
|
|
VII. Prepaid expenses and accrued income |
72,00 |
36,00 |
44,00 |
|
|
ASSETS (A + B + C + D) |
29.277,00 |
30.409,00 |
36.280,00 |
Balance Sheet
(LIABILITIES)
|
(Figures given in thousands of
Euros) |
31/12/2002 (12) |
31/12/2003 (12) |
31/12/2004 (12) |
|
|
|
A) SHAREHOLDERS EQUITY |
10.845,00 |
10.995,00 |
11.497,00 |
|
|
I. Capital |
4.768,00 |
4.768,00 |
4.768,00 |
|
|
II. Premium share account |
|
|
|
|
|
III. Revaluation reserve |
|
|
|
|
|
IV. Reserves |
4.622,00 |
5.474,00 |
5.625,00 |
|
|
Retained earnings |
518,00 |
663,00 |
739,00 |
|
|
Other funds |
4.103,00 |
4.810,00 |
4.885,00 |
|
|
Capital adjustments in Euros |
1,00 |
1,00 |
1,00 |
|
|
V. Prior year earnings |
|
|
|
|
|
VI. Prior year profit or losses |
1.455,00 |
753,00 |
1.104,00 |
|
|
VII. Dividend paid during the year |
|
|
|
|
|
VIII. Own shares for change in capital |
|
|
|
|
|
B) DEFERRED INCOME |
75,00 |
44,00 |
49,00 |
|
|
Capital grants |
75,00 |
44,00 |
49,00 |
|
|
C) PROVISIONS FOR LIABILITIES AND EXPENSES |
|
|
356,00 |
|
|
Other provisions |
|
|
356,00 |
|
|
D) LONG TERM LIABILITIES |
2.684,00 |
2.919,00 |
2.139,00 |
|
|
I. Bonds |
|
|
|
|
|
II. Bank loans |
987,00 |
2.041,00 |
1.742,00 |
|
|
Long term bank loans |
|
995,00 |
1.077,00 |
|
|
Leasing |
987,00 |
1.046,00 |
665,00 |
|
|
III. Debts with associed and affiliated
companies |
|
|
|
|
|
IV. Other creditors |
1.697,00 |
878,00 |
397,00 |
|
|
Other debts |
1.697,00 |
878,00 |
397,00 |
|
|
V. Deferred debts on shares |
|
|
|
|
|
VI. Long term debt with creditor |
|
|
|
|
|
E) SHORT TERM LIABILITIES |
15.673,00 |
16.451,00 |
22.239,00 |
|
|
I. Negotiable bonds |
|
|
|
|
|
II. Bank loans |
6.496,00 |
6.909,00 |
10.194,00 |
|
|
Loans and other debts |
6.141,00 |
6.480,00 |
9.744,00 |
|
|
Leasing |
355,00 |
429,00 |
450,00 |
|
|
III. Short term debts with associated and
affiliated companies |
50,00 |
1.340,00 |
2.363,00 |
|
|
With affiliated companies |
50,00 |
1.340,00 |
2.363,00 |
|
|
IV. Trade creditors |
7.287,00 |
6.577,00 |
8.392,00 |
|
|
Expenses |
6.091,00 |
5.161,00 |
6.722,00 |
|
|
Bills payable |
1.196,00 |
1.416,00 |
1.670,00 |
|
|
V. Other non trade payables |
1.840,00 |
1.475,00 |
1.290,00 |
|
|
Government |
458,00 |
318,00 |
428,00 |
|
|
Other debts |
1.084,00 |
829,00 |
508,00 |
|
|
Accounts receivable |
298,00 |
328,00 |
354,00 |
|
|
VI. Provisions for current assets |
|
150,00 |
|
|
|
VII. Accruals and deferred incomes |
|
|
|
|
|
F) SHORT TERM PROVISIONS FOR LIABILITIES
AND EXPENSES |
|
|
|
|
|
LIABILITIES (A + B + C + D + E + F) |
29.277,00 |
30.409,00 |
36.280,00 |
Profit and Loss
Account
|
(Figures given in thousands of
Euros) |
31/12/2002 (12) |
31/12/2003 (12) |
31/12/2004 (12) |
|
|
|
A) EXPENSES (A.1 a A.16) |
|
|
|
|
|
A.1. Change in stocks of finished goods
and work in progress |
|
|
1.592,00 |
|
|
A.2. Supplies |
13.674,00 |
15.639,00 |
22.651,00 |
|
|
Material consumed |
2.173,00 |
4.363,00 |
10.070,00 |
|
|
Raw materials consumed |
10.456,00 |
10.066,00 |
11.137,00 |
|
|
Other expenses |
1.045,00 |
1.210,00 |
1.444,00 |
|
|
A.3. Labor cost |
4.571,00 |
4.732,00 |
5.204,00 |
|
|
Wages |
3.499,00 |
3.561,00 |
3.935,00 |
|
|
Social security expenses |
1.072,00 |
1.171,00 |
1.269,00 |
|
|
A.4. Assets depreciation |
2.052,00 |
2.173,00 |
2.038,00 |
|
|
A.5 Variance in provision for current assets |
337,00 |
577,00 |
530,00 |
|
|
Variance in provision for inventory |
47,00 |
-47,00 |
|
|
|
Variance in provision for bad debts |
290,00 |
474,00 |
324,00 |
|
|
Variance in provision for other current
assets |
|
150,00 |
206,00 |
|
|
A.6. Other operating costs |
5.779,00 |
5.587,00 |
7.178,00 |
|
|
External costs |
5.727,00 |
5.530,00 |
7.098,00 |
|
|
Taxes |
52,00 |
57,00 |
80,00 |
|
|
A.I. OPERATING RESULT
(B.1+B.2+B.3+B.4-A.1-A.2-A.3-A.4-A.5-A.6) |
2.753,00 |
2.279,00 |
2.119,00 |
|
|
A.7. Financial expenses |
747,00 |
697,00 |
694,00 |
|
|
Other companies debts |
747,00 |
697,00 |
694,00 |
|
|
A.8. Variation in financial investments
provision |
|
|
|
|
|
A.9. Exchange losses |
132,00 |
185,00 |
167,00 |
|
|
A.II. POSITIVE FINANCIAL RESULTS
(B.5+B.6+B.7+B.8-A.7-A.8-A.9) |
|
|
|
|
|
A.III. PROFIT FROM ORDINARY ACTIVITIES
(A.I+A.II-B.I-B.II) |
1.925,00 |
1.547,00 |
1.525,00 |
|
|
A.10. Variation in provision in fixed
assets |
|
|
|
|
|
A.11. Losses in fixed assets |
|
|
|
|
|
A.12. Losses from shares and bonds |
|
|
|
|
|
A.13. Extraordinary charges |
99,00 |
744,00 |
211,00 |
|
|
A.14. Prior year’s expenses and losses |
43,00 |
7,00 |
|
|
|
A.IV. POSITIVE EXTRAORDINARY RESULT
(B.9+B.10+B.11+B.12+B.13-A.10-A.11-A.12-A.13-A.14) |
|
|
|
|
|
A.V. EARNINGS / LOSS BEFORE TAXES
(A.III+A.IV-B.III-B.IV) |
1.906,00 |
921,00 |
1.411,00 |
|
|
A.15. Corporate Taxes |
451,00 |
168,00 |
307,00 |
|
|
A.16. Other taxes |
|
|
|
|
|
A.VI. YEAR END RESULT (PROFIT)
(A.V-A.15-A.16) |
1.455,00 |
753,00 |
1.104,00 |
|
|
B) INCOMES (B.1 a B13) |
|
|
|
|
|
B.1. Turnover |
28.390,00 |
29.174,00 |
40.186,00 |
|
|
Sales |
27.691,00 |
28.616,00 |
39.219,00 |
|
|
Services provided |
935,00 |
817,00 |
1.392,00 |
|
|
Discounts |
-236,00 |
-259,00 |
-425,00 |
|
|
B.2. Increase in inventory of finished
goods |
85,00 |
1.256,00 |
|
|
|
B.3. Expenses capitalized |
23,00 |
85,00 |
43,00 |
|
|
B.4. Other operating income |
668,00 |
472,00 |
1.083,00 |
|
|
Other incomes |
661,00 |
463,00 |
1.083,00 |
|
|
Grants |
7,00 |
|
|
|
|
Excess in provision for liabilities and
charges |
|
9,00 |
|
|
|
B.I. OPERATING LOSSES
(A.1+A.2+A.3+A.4+A.5+A.6-B.1-B.2-B.3-B.4) |
|
|
|
|
|
B.5. Incomes from share |
|
|
|
|
|
B.6. Income from securities |
|
|
|
|
|
B.7. Other income from interrest |
8,00 |
125,00 |
186,00 |
|
|
From affiliated companies |
|
113,00 |
98,00 |
|
|
From other companies |
8,00 |
12,00 |
88,00 |
|
|
B.8. Gains on exchange |
43,00 |
25,00 |
81,00 |
|
|
B.II. FINANCIAL LOSSES
(A.7+A.8+A.9-B.5-B.6-B.7-B.8) |
828,00 |
732,00 |
594,00 |
|
|
B.III. LOSSES FROM ORDINARY ACTIVITIES
(B.I+B.II-A.I-A.II) |
|
|
|
|
|
B.9. Gains from disposal of fixed assets |
20,00 |
3,00 |
|
|
|
B.10. Gains from dealing in own shares |
|
|
|
|
|
B.11. Paid in surplus |
45,00 |
31,00 |
20,00 |
|
|
B.12. Extraordinary income |
33,00 |
59,00 |
77,00 |
|
|
B.13. Prior year’s income and profits |
25,00 |
32,00 |
|
|
|
B.IV. EXTRAORDINARY LOSSES (A.10+A.11+A.12+A.13+A.14-B.9-B.10-B.11-B.12-B.13) |
19,00 |
626,00 |
114,00 |
|
|
B.V. LOSS BEFORE TAXES
(B.III+B.IV-A.III-A.IV) |
|
|
|
|
|
B.VI. NET LOSS (B.V+A.15+A.16) |
|
|
|
Main Ratios
|
(Figures given in thousands of
Euros) |
2.002 (12) |
2.003 (12) |
2.004 (12) |
|
|
|
ACTIVITY |
|
|
|
|
|
Increase of the Sales Figures |
0,67 |
2,76 |
37,75 |
|
|
Assets Turnover |
0,97 |
0,96 |
1,11 |
|
|
Productivity |
2,13 |
2,06 |
1,90 |
|
|
Increase of the Added Value |
7,75 |
0,49 |
1,33 |
|
|
PROFITABILITY |
|
|
|
|
|
Economic Profitability |
4,97 |
2,48 |
3,04 |
|
|
Financial Profitability |
13,42 |
6,85 |
9,60 |
|
|
Financial Expenses |
2,63 |
2,39 |
1,73 |
|
|
BALANCE (IN DAYS OF SALES) |
|
|
|
|
|
Customers’ Credit (In days of sales) |
143,00 |
124,00 |
144,00 |
|
|
Suppliers’ Credit (In days of sales) |
193,00 |
165,00 |
125,00 |
|
|
Working Capital (In days of sales) |
10,00 |
7,00 |
19,00 |
|
|
Working Capital Requirement (In days of
sales) |
89,00 |
86,00 |
102,00 |
|
|
Treasury (In days of sales) |
0,00 |
0,00 |
0,00 |
|
|
BALANCE |
|
|
|
|
|
Working Capital |
821,00 |
585,00 |
2.099,00 |
|
|
Working Capital Requirement |
7.011,00 |
7.005,00 |
11.369,00 |
|
|
Treasury |
-6.190,00 |
-6.420,00 |
-9.270,00 |
|
|
Balance Ratio |
1,06 |
1,04 |
1,18 |
|
|
SOLVENCY |
|
|
|
|
|
Borrowing Ratio |
62,70 |
63,70 |
67,19 |
|
|
Own / Permanent Funds |
79,72 |
78,77 |
81,88 |
|
|
Payback Capacity |
0,60 |
0,61 |
0,57 |
|
|
LIQUIDITY |
|
|
|
|
|
General Liquidity |
1,05 |
1,04 |
1,09 |
|
|
Immediate Liquidity |
0,02 |
0,03 |
0,04 |
Sectorial Analysis
Summary of Assets, Liability & Equity
|
(Figures given in Percentages) |
Company |
Sector |
Company |
|
|
2.004 |
|
|
|
Assets |
|||
|
DUE FROM SHAREHOLDERS
FOR UNCALLED CAPITAL |
0,00 |
0,00 |
0,00 |
|
FIXED ASSETS |
32,81 |
37,47 |
-4,66 |
|
ACCRUED EXPENSES |
0,11 |
0,58 |
-0,47 |
|
CURRENT ASSETS |
67,08 |
61,94 |
5,14 |
|
TOTAL ASSETS |
100,00 |
100,00 |
0,00 |
|
Liabilities |
|||
|
SHAREHOLDERS EQUITY |
31,69 |
40,88 |
-9,19 |
|
ACCRUED INCOME |
0,14 |
1,78 |
-1,64 |
|
RISK AND EXPENDITURE
COVER |
0,98 |
0,17 |
0,81 |
|
LONG-TERM CREDITORS |
5,90 |
10,20 |
-4,30 |
|
SHORT-TERM CREDITORS |
61,30 |
46,97 |
14,33 |
|
SHORT-TERM RISK AND
EXPENDITURE COVER |
0,00 |
0,00 |
0,00 |
|
TOTAL LIABILITIES |
100,00 |
100,00 |
0,00 |
Analytical Account of
Results
|
(Figures given in Percentages) |
Company |
Sector |
Company |
|
|
2.004 |
|
|
|
Net turnover |
97,27 |
99,15 |
-1,87 |
|
Other operating income |
2,73 |
0,85 |
1,87 |
|
Production Value |
100,00 |
100,00 |
0,00 |
|
Operating expenses |
58,68 |
54,42 |
4,27 |
|
Other operation expenses |
17,38 |
16,67 |
0,71 |
|
Added value |
23,94 |
28,91 |
-4,97 |
|
Labor cost |
12,60 |
13,41 |
-0,81 |
|
Gross Economic Result |
11,35 |
15,50 |
-4,16 |
|
Assets depreciation |
4,93 |
4,59 |
0,34 |
|
Variation in provision
for current assets |
1,28 |
0,60 |
0,68 |
|
Net Economic Result |
5,13 |
10,31 |
-5,18 |
|
Financial income |
0,65 |
1,22 |
-0,57 |
|
Financial expenses |
2,08 |
2,18 |
-0,09 |
|
Variation in financial
investment provision |
0,00 |
0,51 |
-0,51 |
|
Ordinary Activities
Result |
3,69 |
8,84 |
-5,15 |
|
Extraordinary income |
0,23 |
0,84 |
-0,61 |
|
Extraordinary expenses |
0,51 |
0,37 |
0,15 |
|
Variation in provision
in fixed assets |
0,00 |
0,02 |
-0,02 |
|
Results before Taxes |
3,42 |
9,30 |
-5,88 |
|
Corporaye taxes |
0,74 |
2,83 |
-2,09 |
|
Net Result |
2,67 |
6,47 |
-3,80 |
|
Assets depreciation |
4,93 |
4,59 |
0,34 |
|
Provisions fund
variation |
1,28 |
1,13 |
0,15 |
|
Net Self-Financing |
8,89 |
12,19 |
-3,30 |
Ratios
|
(Figures given in ) |
Company |
Ptile25 |
Medium |
Ptile75 |
|
|
2.004 |
|
|
|
|
ACTIVITY |
|
|
|
|
|
Increase of the Sales
Figures |
37,75 |
-11,39 |
-2,14 |
5,52 |
|
Assets Turnover |
1,11 |
0,80 |
0,94 |
1,17 |
|
Fixed Assets Turnover |
3,36 |
1,65 |
2,61 |
4,50 |
|
Increase of the Added
Value |
1,33 |
-14,34 |
-4,51 |
12,15 |
|
PRODUCTIVITY |
|
|
|
|
|
Productivity |
1,90 |
1,55 |
1,87 |
2,34 |
|
Change of Personnel
Costs |
9,98 |
-0,01 |
6,67 |
18,40 |
|
Average Personnel Costs |
27,68 |
20,83 |
25,12 |
27,33 |
|
Value Added by Employees |
52,61 |
38,05 |
48,70 |
54,82 |
|
CASH FLOW |
|
|
|
|
|
Cash Flow |
3.672,00 |
628,37 |
1.065,00 |
1.468,49 |
|
Operating Cash Flow |
4.687,00 |
782,81 |
1.301,99 |
1.878,76 |
|
Change in Cash Flow |
4,82 |
-28,83 |
-7,77 |
18,15 |
|
PROFITABILITY |
|
|
|
|
|
Economic Profitability |
3,04 |
1,17 |
3,06 |
5,28 |
|
Financial Profitability |
9,60 |
4,60 |
8,73 |
16,46 |
|
Financial Expenses |
1,73 |
0,84 |
1,59 |
2,22 |
|
Gross Economic
Profitability |
12,92 |
8,25 |
11,29 |
15,65 |
|
Gross Financial
Profitability |
40,77 |
20,58 |
33,79 |
52,95 |
|
BALANCE (IN DAYS OF SALES) |
|
|
|
|
|
Customers’ Credit (In
days of sales) |
144,00 |
111,27 |
131,36 |
152,52 |
|
Suppliers’ Credit (In
days of sales) |
124,00 |
90,65 |
129,88 |
176,99 |
|
Working Capital (In days
of sales) |
18,00 |
-6,20 |
39,93 |
106,42 |
|
Working Capital
Requirement (In days of sales) |
101,00 |
36,13 |
89,26 |
135,05 |
|
Treasury (In days of
sales) |
0,00 |
-94,19 |
-46,77 |
34,68 |
|
Operating Current Assets |
218,00 |
188,74 |
225,36 |
302,41 |
|
BALANCE |
|
|
|
|
|
Working Capital |
2.099,00 |
-159,34 |
1.166,42 |
3.463,25 |
|
Working Capital
Requirement |
11.369,00 |
980,45 |
2.751,60 |
5.018,87 |
|
Treasury |
-9.270,00 |
-3.377,76 |
-1.577,80 |
1.383,29 |
|
Balance Ratio |
1,18 |
0,96 |
1,25 |
2,08 |
|
SOLVENCY |
|
|
|
|
|
Borrowing Ratio |
67,19 |
52,87 |
65,86 |
75,83 |
|
Own / Permanent Funds |
81,88 |
60,26 |
75,86 |
90,37 |
|
Payback Capacity |
0,57 |
0,40 |
0,59 |
0,78 |
|
Long term Indebtedness |
5,90 |
4,16 |
9,62 |
14,86 |
|
Gearing |
315,56 |
212,43 |
292,98 |
413,73 |
|
Financing Basic Ratio |
1,00 |
1,00 |
1,00 |
1,06 |
|
Assets Guarantee |
1,49 |
1,30 |
1,47 |
1,87 |
|
LIQUIDITY |
|
|
|
|
|
General Liquidity |
1,09 |
0,97 |
1,20 |
1,63 |
|
Immediate Liquidity |
0,04 |
0,02 |
0,06 |
0,43 |
RATING EXPLANATIONS
|
RATING |
STATUS |
PROPOSED CREDIT LINE |
|
|
>86 |
Aaa |
Possesses an extremely sound financial
base with the strongest capability for timely payment of interest and
principal sums |
Unlimited |
|
71-85 |
Aa |
Possesses adequate working capital. No
caution needed for credit transaction. It has above average (strong)
capability for payment of interest and principal sums |
Large |
|
56-70 |
A |
Financial & operational base are
regarded healthy. General unfavourable factors will not cause fatal effect.
Satisfactory capability for payment of interest and principal sums |
Fairly Large |
|
41-55 |
Ba |
Overall operation is considered normal.
Capable to meet normal commitments. |
Satisfactory |
|
26-40 |
B |
Unfavourable & favourable factors
carry similar weight in credit consideration. Capability to overcome
financial difficulties seems comparatively below average/normal. |
Small |
|
11-25 |
Ca |
Adverse factors are apparent. Repayment of
interest and principal sums in default or expected to be in default upon
maturity |
Limited with full security |
|
<10 |
C |
Absolute credit risk exists. Caution needed
to be exercised |
Credit not recommended |
|
NR |
In view of the lack of information, we
have no basis upon which to recommend credit dealings |
No Rating |
|