
MIRA
INFORM REPORT
|
Report Date : |
17.01.2007 |
IDENTIFICATION DETAILS
|
Name : |
RAY
EUROPA S.L. |
|
|
|
|
Registered Office : |
Carretera
De Mislata A Montroy Km 1, 46192 Monserrat ( |
|
|
|
|
Country : |
|
|
|
|
|
Financials (as on) : |
31.12.2005 |
|
|
|
|
Date of Incorporation : |
10/11/1997 |
|
|
|
|
Legal Form : |
Limited
Liability Company |
|
|
|
|
Line of Business : |
Wholesale
of construction materials : glass |
RATING & COMMENTS
|
MIRA’s Rating : |
Ba |
|
RATING |
STATUS |
PROPOSED CREDIT LINE |
|
|
41-55 |
Ba |
Overall operation is considered normal.
Capable to meet normal commitments. |
Satisfactory |
|
Status : |
Satisfactory
|
|
|
|
|
Payment Behaviour : |
Usually
correct |
|
|
|
|
Litigation : |
Clear |
Identification and
Characteristics
|
Tax Number |
B35495340 |
|
NAME |
RAY EUROPA S.L. |
|
FORMER NAME |
RAY CANARY |
|
BUSINESS
ADDRESS |
CARRETERA DE MISLATA A MONTROY KM 1 |
|
Postcode |
46192 MONSERRAT ( |
|
FORMER
ADDRESS |
PARTIDA DE. CR. DE MONSERRAT A MONTROY |
|
Postcode |
46192 MONSERRAT ( |
|
URL |
http://www.ray.logistic.com |
|
TELEPHONE |
961300768 |
|
FAX |
961300768 |
|
LEGAL FORM |
LIMITED LIABILITY COMPANY |
|
DATE FOUNDED |
10/11/1997 |
|
CAPITAL |
211.708,26 Euros |
|
NUMBER OF
EMPLOYEES |
2 |
|
ACTIVITY |
1617400 - Wholesale of
construction materials : glass |
|
CNAE |
5153 - Wholesale of wood,
construction materials and sanitary equipment |
|
EXPORT COMPANY |
YES |
|
* Characteristics of the main address |
|
|
According to our investigations
dated 21/01/2005 it is a/an office, warehouse
property rented and it is located in an area main Clarifications: Domicilio Social |
|
Synthesis
|
FINANCIAL SITUATION (Year
ending: 31/12/2005) |
||
|
|
|
|
|
PROFITABILITY |
|
1/9 Negative |
|
TREASURY |
|
8/9 Very
good |
|
BALANCE SHEET |
|
9/9 Excellent |
|
DEBT |
|
6/9 Medium |
|
INCIDENTS |
||
|
|
|
|
|
COMMITMENTS |
|
9/9 Respected |
|
INCIDENTS |
|
9/9 None
or Negligible |
|
PREVIOUS EXPERIENCE |
||
|
|
|
|
|
PREVIOUS
EXPERIENCE |
|
7/9 |
Credit Appraisal
|
CREDIT ACCORDING TO OBJECTIVE DATA (From 0
to 6.000.000,00 Euros): |
|
FAVOURABLE TOWARDS 8.997,15
Max. |
|
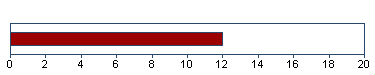
SOLVENCY RATING: |
|
12/20 (BASED ON HOMOGENEOUS
FORMULATION) |
|
|
|
|
Financial Elements
Figures given in
Euros
|
|
Balance
sheet 2.003 (12) |
Balance sheet 2.004
(12) |
Balance sheet 2.005
(12) |
% Sales |
|
|
SALES |
439.959,57 |
288.954,85 |
98.595,96 |
|
|
|
ADDED VALUE |
19.699,86 |
39.891,26 |
-8.595,01 |
-8,71 |
|
|
BUSINESS RESULT |
-23.070,38 |
14.948,34 |
-19.384,35 |
-19,66 |
|
|
OWN FUNDS |
189.813,69 |
204.762,03 |
185.377,68 |
|
|
|
DEBT |
502.777,90 |
550.573,08 |
480.832,25 |
|
|
|
TOTAL ASSET |
692.591,59 |
755.335,11 |
666.209,93 |
|
|
|
The sales of 98.595,96
Euros show a change of -65,88% compared with
2.004 . Between 2.003 and 2.004 , this
change was -34,32% . |
|||||
|
Added value grew by -121,55%
compared with the previous year. Shareholders equity are 185.377,68
Euros for an indebtedness of 480.832,25 Euros . |
|||||
|
The result -19.384,35
Euros means financial profitability of -10,46% and
economic profitability of -2,91% . This result means growth of
-229,68% compared with the 2.004 . |
|||||
|
|
|||||
|
THE FIGURES FOR THE LAST BALANCE SHEET ARE
RELEVANT: |
|||||
|
SOURCE: FROM THE MERCANTILE REGISTER |
|||||
|
DATE: 09/01/2007 |
|||||
|
|
|
||||
|
Results Distribution |
|||||
|
Annual Report Year Source: 2.005 |
|||||
|
Figures given in Euros |
|||||
|
Distribution Base |
|||||
|
Profit and Loss |
-19.384 |
||||
|
Total of Amounts to be
distributed |
-19.384 |
||||
|
Distribution a |
|||||
|
Prior years losses |
-19.384 |
||||
Comparative Sector
Analysis
|
|
Company |
Sector |
Difference |
|
|
(2.005) |
|
|
|
% of PRODUCTION VALUE |
|
|
|
|
SALES |
100,00 |
99,12 |
0,88 |
|
ADDED
VALUE |
-8,72 |
18,98 |
-27,70 |
|
BUSINESS
RESULT |
-19,66 |
2,52 |
-22,18 |
|
% OF TOTAL ASSETS |
|
|
|
|
OWN
FUNDS |
27,83 |
36,90 |
-9,07 |
|
DEBT |
72,17 |
63,10 |
9,07 |
Compared sector (CNAE): 515 - Comercio al por mayor de
productos no agrarios semielaborados, chatarra y productos de desecho
Number of companies: 3.993
Size (Sales Figure): 0 - 2.800.000,00 Euros
The turnover of the company is 0,88%
above the mean for the sector.
The company’s added value was -8,72%
s/ the production value, and 27,70% below the mean for the sector.
The company’s business result was
-19,66% of the PV, 22,18% below the mean for the sector.
The company’s own resources are 27,83%
, 9,07% below the mean for the sector.
The company’s outside resources are
72,17% , 9,07% above the mean for the sector.
Legal Actions
No legal
incidences registered for this company in the official source
No claims
registered for this company in the official sources
AFFECTED BY:
No significant elemento
Main Board members,
Directors and Auditor
|
Position |
Surname and name |
Date of appointment |
|
ADMINISTRATOR |
MOTIRAM DAYALANI RAJESH |
05/11/2003 |
|
ADMINISTRATOR |
POOJA DAYALANI EVELYN |
05/11/2003 |
Financial Links
|
Shareholders |
||||
|
Company Name |
|
|
Source |
Information Date |
|
DAYALANI RAJESH MOTIRAM |
|
100,00% |
OWN SOURCES |
16/01/2007 |
Proceedings published
in the B.O.R.M.E. (Official Mercantile Register Gazette)
|
Proceedings |
Date |
Notice Num. |
Mercantile Reg. |
|
Registration of accounts
(2005) |
16/10/2006 |
759977 |
|
|
Registration of accounts
(2004) |
11/10/2005 |
702193 |
|
|
Registration of accounts
(2003) |
12/11/2004 |
800185 |
|
|
Resignations |
05/11/2003 |
418496 |
|
|
Appointments |
05/11/2003 |
418496 |
|
Complementary
Information
|
16/01/07 BLOQUE DE INVESTIGACION |
|
- Su actividad concreta es la exportacion
de materiales de construc- |
|
cion. |
|
- La cifra maxima de empleados que se
alcanza por necesidades de pro- |
|
duccion es de 10. |
|
- Exporta a |
|
- Proveedores: “EMIGRES SL”, “JOFER
INDUSTRIAL”. |
|
- Cuenta con una cartera aproximada de 30
clientes. |
|
---------------------------------------------------------------------- |
|
El Bloque de Investigacion no esta sujeto
a actualizaciones sistema |
|
ticas.Los datos mostrados fueron aportados
por las fuentes consultadas |
|
en la fecha de encabezamiento. |
Remarks for customer
The activity center is in: c/157 N-24
Masias, Moncada 46.116 (
|
|
|
Commercial Experience |
Branches
|
Road |
Postal Code |
Town |
Province |
|
157 |
46116 |
MONCADA |
|
Bank Entities
|
Entity |
Branch |
Branch Address |
Town |
Province |
|
BANCO ESPAÑOL DE CREDITO, S.A. |
3224 |
CL ISAAC PERAL 6 |
MONSERRAT |
|
The information on the last account
contained in this report is extracted from the Mercantile Register file of the
legal address of the Company and dated 09/01/2007
Balance Sheet
(ASSETS)
|
(Figures given in Euros) |
31/12/2003 (12) |
31/12/2004 (12) |
31/12/2005 (12) |
|
|
|
A) DUE FROM SHAREHOLDERS FOR UNCALLED
CAPITAL |
|
|
|
|
|
B) FIXED ASSETS |
83.315,61 |
72.522,07 |
78.576,52 |
|
|
I. Establishment expenses |
241,37 |
160,10 |
78,83 |
|
|
II. Intangible assets |
|
|
|
|
|
III. Tangible assets |
83.074,24 |
72.361,97 |
78.497,69 |
|
|
IV. Financial assets |
|
|
|
|
|
V. Owners equity |
|
|
|
|
|
VI. Long term trade liabilities |
|
|
|
|
|
C) DEFERRED EXPENSES |
|
|
|
|
|
D) CURRENT ASSETS |
609.275,98 |
682.813,04 |
587.633,41 |
|
|
I. Not paid in shareholder capital |
|
|
|
|
|
II. Inventory |
51.425,56 |
38.817,55 |
38.905,25 |
|
|
III. Debtors |
552.107,16 |
643.595,36 |
547.879,73 |
|
|
IV. Short term financial assets |
500,51 |
300,51 |
300,51 |
|
|
V. Short term owners equity |
|
|
|
|
|
VI. Cash |
5.242,75 |
99,62 |
547,92 |
|
|
VII. Prepaid expenses and accrued income |
|
|
|
|
|
ASSETS (A + B + C + D) |
692.591,59 |
755.335,11 |
666.209,93 |
Balance Sheet
(LIABILITIES)
|
(Figures given in Euros) |
31/12/2003 (12) |
31/12/2004 (12) |
31/12/2005 (12) |
|
|
|
A) SHAREHOLDERS EQUITY |
189.813,69 |
204.762,03 |
185.377,68 |
|
|
I. Capital |
211.708,26 |
211.708,26 |
211.708,26 |
|
|
II. Premium share account |
|
|
|
|
|
III. Revaluation reserve |
|
|
|
|
|
IV. Reserves |
1.318,92 |
1.318,92 |
1.318,92 |
|
|
Capital adjustments in Euros |
0,07 |
0,07 |
0,07 |
|
|
Sundry reserves |
1.318,85 |
1.318,85 |
1.318,85 |
|
|
V. Prior year earnings |
-143,11 |
-23.213,49 |
-8.265,15 |
|
|
VI. Prior year profit or losses |
-23.070,38 |
14.948,34 |
-19.384,35 |
|
|
VII. Dividend paid during the year |
|
|
|
|
|
VIII. Own shares for change in capital |
|
|
|
|
|
B) DEFERRED INCOME |
|
|
|
|
|
C) PROVISIONS FOR LIABILITIES AND EXPENSES |
|
|
|
|
|
D) LONG TERM LIABILITIES |
|
|
|
|
|
E) SHORT TERM LIABILITIES |
502.777,90 |
550.573,08 |
480.832,25 |
|
|
F) SHORT TERM PROVISIONS FOR LIABILITIES
AND EXPENSES |
|
|
|
|
|
LIABILITIES (A + B + C + D + E + F) |
692.591,59 |
755.335,11 |
666.209,93 |
Profit and Loss
Account
|
(Figures given in Euros) |
31/12/2003 (12) |
31/12/2004 (12) |
31/12/2005 (12) |
|
|
|
A) EXPENSES (A.1 a A.15) |
|
|
|
|
|
A.1 Operating Expenses |
302.038,24 |
174.346,40 |
43.862,48 |
|
|
A.3. Labor cost |
39.877,37 |
9.549,57 |
8.224,56 |
|
|
Wages |
31.028,62 |
5.049,91 |
5.469,60 |
|
|
Social security expenses |
8.848,75 |
4.499,66 |
2.754,96 |
|
|
A.3. Assets depreciation |
10.682,83 |
8.924,84 |
10.474,00 |
|
|
A.4. Variance in provision for current
assets |
|
|
|
|
|
A.5. Other operating costs |
118.221,47 |
74.717,19 |
63.328,49 |
|
|
A.I. OPERATING RESULT
(B.1-A.1-A.2-A.3-A.4-A.5) |
|
21.416,85 |
|
|
|
A.6. Financial expenses |
2.251,88 |
1.124,95 |
398,41 |
|
|
Other companies debts |
2.251,88 |
1.124,95 |
398,41 |
|
|
A.7. Variation in financial investments
provision |
|
|
|
|
|
A.8. Exchange losses |
|
|
|
|
|
A.II. POSITIVE FINANCIAL RESULTS
(B.2+B.3-A.6-A.7-A.8) |
|
|
|
|
|
A.III. PROFIT FROM ORDINARY ACTIVITIES
(A.I+A.II-B.I-B.II) |
|
20.292,44 |
|
|
|
A.9. Variation in provision in fixed
assets |
|
|
|
|
|
A.10. Losses in fixed assets |
|
|
|
|
|
A.11. Losses from shares and bonds |
|
|
|
|
|
A.12. Extraordinary charges |
|
|
0,04 |
|
|
A.13. Prior year’s expenses and losses |
|
|
|
|
|
A.IV. POSITIVE EXTRAORDINARY RESULT (B.4+B.5+B.6+B.7+B.8-A.9-A.10-A.11-A.12-A.13) |
154,48 |
1.062,33 |
|
|
|
A.V. EARNINGS / LOSS BEFORE TAXES
(A.III+A.IV-B.III-B.IV) |
|
21.354,77 |
|
|
|
A.14. Corporate Taxes |
-9.887,31 |
6.406,43 |
-8.307,58 |
|
|
A.15. Other taxes |
|
|
|
|
|
A.VI. YEAR END RESULT (PROFIT)
(A.V-A.14-A.15) |
|
14.948,34 |
|
|
|
B) INCOMES (B.1 a B.8) |
|
|
|
|
|
B.1. Operating income |
439.959,57 |
288.954,85 |
98.595,96 |
|
|
Turnover |
439.959,57 |
288.954,85 |
98.595,96 |
|
|
B.I. OPERATING LOSSES
(A.1+A.2+A.3+A.4+A.5-B.1) |
30.860,34 |
|
27.293,57 |
|
|
B.2. Financial Income |
0,05 |
0,54 |
0,05 |
|
|
Other |
0,05 |
0,54 |
0,05 |
|
|
B.3. Gains on exchange |
|
|
|
|
|
B.II. FINANCIAL LOSSES
(A.6+A.7+A.8-B.2-B.3) |
2.251,83 |
1.124,41 |
398,36 |
|
|
B.III. LOSSES FROM ORDINARY ACTIVITIES
(B.I+B.II-A.I-A.II) |
33.112,17 |
|
27.691,93 |
|
|
B.4. Gains from disposal of fixed assets |
|
1.062,33 |
|
|
|
B.5. Gains from dealing in own shares |
|
|
|
|
|
B.6. Paid in surplus |
|
|
|
|
|
B.7. Extraordinary income |
154,48 |
|
0,04 |
|
|
B.8. Prior year’s income and profits |
|
|
|
|
|
B.IV. EXTRAORDINARY LOSSES (A.9+A.10+A.11+A.12+A.13-B.4-B.5-B.6-B.7-B.8) |
|
|
|
|
|
B.V. LOSS BEFORE TAXES
(B.III+B.IV-A.III-A.IV) |
32.957,69 |
|
27.691,93 |
|
|
B.VI. NET LOSS (B.V+A.14+A.15) |
23.070,38 |
|
19.384,35 |
Main Ratios
|
(Figures given in Euros) |
2.003 (12) |
2.004 (12) |
2.005 (12) |
|
|
|
ACTIVITY |
|
|
|
|
|
Increase of the Sales Figures |
-42,64 |
-34,32 |
-65,88 |
|
|
Assets Turnover |
0,64 |
0,38 |
0,15 |
|
|
Productivity |
0,49 |
4,18 |
-1,04 |
|
|
Increase of the Added Value |
-65,21 |
102,50 |
-121,55 |
|
|
PROFITABILITY |
|
|
|
|
|
Economic Profitability |
-3,33 |
1,98 |
-2,91 |
|
|
Financial Profitability |
-12,15 |
7,30 |
-10,46 |
|
|
Financial Expenses |
0,51 |
0,39 |
0,40 |
|
|
BALANCE (IN DAYS OF SALES) |
|
|
|
|
|
Customers’ Credit (In days of sales) |
452,00 |
802,00 |
2.000,00 |
|
|
Suppliers’ Credit (In days of sales) |
|
|
|
|
|
Working Capital (In days of sales) |
87,00 |
165,00 |
390,00 |
|
|
Working Capital Requirement (In days of
sales) |
82,00 |
164,00 |
387,00 |
|
|
Treasury (In days of sales) |
5,00 |
0,00 |
3,00 |
|
|
BALANCE |
|
|
|
|
|
Working Capital |
106.498,08 |
132.239,96 |
106.801,16 |
|
|
Working Capital Requirement |
100.754,82 |
131.839,83 |
105.952,73 |
|
|
Treasury |
5.743,26 |
400,13 |
848,43 |
|
|
Balance Ratio |
2,28 |
2,82 |
2,36 |
|
|
SOLVENCY |
|
|
|
|
|
Borrowing Ratio |
72,59 |
72,89 |
72,17 |
|
|
Own / Permanent Funds |
100,00 |
100,00 |
100,00 |
|
|
Payback Capacity |
1,12 |
1,85 |
4,41 |
|
|
LIQUIDITY |
|
|
|
|
|
General Liquidity |
1,21 |
1,24 |
1,22 |
|
|
Immediate Liquidity |
0,01 |
0,00 |
0,00 |
Sectorial Analysis
Summary of Assets, Liability & Equity
|
(Figures given in Percentages) |
Company |
Sector |
Company |
|
|
2.005 |
|
|
|
Assets |
|||
|
DUE FROM SHAREHOLDERS
FOR UNCALLED CAPITAL |
0,00 |
0,06 |
-0,06 |
|
FIXED ASSETS |
11,79 |
30,00 |
-18,21 |
|
ACCRUED EXPENSES |
0,00 |
0,41 |
-0,41 |
|
CURRENT ASSETS |
88,21 |
69,53 |
18,68 |
|
TOTAL ASSETS |
100,00 |
100,00 |
0,00 |
|
Liabilities |
|||
|
SHAREHOLDERS EQUITY |
27,83 |
36,90 |
-9,07 |
|
ACCRUED INCOME |
0,00 |
0,31 |
-0,31 |
|
RISK AND EXPENDITURE
COVER |
0,00 |
0,06 |
-0,06 |
|
LONG-TERM CREDITORS |
0,00 |
12,75 |
-12,75 |
|
SHORT-TERM CREDITORS |
72,17 |
49,93 |
22,24 |
|
SHORT-TERM RISK AND
EXPENDITURE COVER |
0,00 |
0,05 |
-0,05 |
|
TOTAL LIABILITIES |
100,00 |
100,00 |
0,00 |
Analytical Account of
Results
|
(Figures given in Percentages) |
Company |
Sector |
Company |
|
|
2.005 |
|
|
|
Net turnover |
100,00 |
99,12 |
0,88 |
|
Other operating income |
0,00 |
0,88 |
-0,88 |
|
Production Value |
100,00 |
100,00 |
0,00 |
|
Operating expenses |
44,49 |
70,92 |
-26,43 |
|
Other operation expenses |
64,23 |
10,10 |
54,13 |
|
Added value |
-8,72 |
18,98 |
-27,70 |
|
Labor cost |
8,34 |
12,61 |
-4,27 |
|
Gross Economic Result |
-17,06 |
6,37 |
-23,43 |
|
Assets depreciation |
10,62 |
1,94 |
8,68 |
|
Variation in provision
for current assets |
0,00 |
0,23 |
-0,23 |
|
Net Economic Result |
-27,68 |
4,20 |
-31,88 |
|
Financial income |
0,00 |
0,27 |
-0,27 |
|
Financial expenses |
0,40 |
1,14 |
-0,74 |
|
Variation in financial
investment provision |
0,00 |
-0,00 |
0,00 |
|
Ordinary Activities
Result |
-28,09 |
3,33 |
-31,42 |
|
Extraordinary income |
0,00 |
0,37 |
-0,37 |
|
Extraordinary expenses |
0,00 |
0,14 |
-0,14 |
|
Variation in provision
in fixed assets |
0,00 |
0,00 |
-0,00 |
|
Results before Taxes |
-28,09 |
3,56 |
-31,64 |
|
Corporaye taxes |
-8,43 |
1,04 |
-9,46 |
|
Net Result |
-19,66 |
2,52 |
-22,18 |
|
Assets depreciation |
10,62 |
1,94 |
8,68 |
|
Provisions fund
variation |
0,00 |
0,23 |
-0,23 |
|
Net Self-Financing |
-9,04 |
4,69 |
-13,72 |
Ratios
|
(Figures given in ) |
Company |
Ptile25 |
Medium |
Ptile75 |
|
|
2.005 |
|
|
|
|
ACTIVITY |
|
|
|
|
|
Increase of the Sales
Figures |
-65,88 |
-5,88 |
3,79 |
13,98 |
|
Assets Turnover |
0,15 |
1,15 |
1,61 |
2,18 |
|
Fixed Assets Turnover |
1,26 |
3,53 |
7,71 |
18,95 |
|
Increase of the Added
Value |
-121,55 |
-6,40 |
3,87 |
15,46 |
|
PRODUCTIVITY |
|
|
|
|
|
Productivity |
-1,04 |
1,24 |
1,45 |
1,78 |
|
Change of Personnel
Costs |
-13,88 |
0,00 |
7,01 |
17,89 |
|
Average Personnel Costs |
|
15.516,10 |
19.634,65 |
25.980,58 |
|
Value Added by Employees |
|
22.091,79 |
29.840,75 |
41.784,07 |
|
CASH FLOW |
|
|
|
|
|
Cash Flow |
-8.910,35 |
13.464,62 |
31.246,29 |
66.577,95 |
|
Operating Cash Flow |
-16.819,57 |
19.674,33 |
44.982,88 |
89.997,28 |
|
Change in Cash Flow |
-137,32 |
-23,95 |
-0,42 |
21,09 |
|
PROFITABILITY |
|
|
|
|
|
Economic Profitability |
-2,91 |
1,07 |
2,56 |
5,57 |
|
Financial Profitability |
-10,46 |
4,36 |
9,83 |
18,04 |
|
Financial Expenses |
0,40 |
0,24 |
0,75 |
1,59 |
|
Gross Economic
Profitability |
-2,52 |
5,38 |
8,69 |
13,47 |
|
Gross Financial
Profitability |
-9,07 |
16,97 |
31,71 |
55,37 |
|
BALANCE (IN DAYS OF SALES) |
|
|
|
|
|
Customers’ Credit (In
days of sales) |
2.000,00 |
42,69 |
74,10 |
112,17 |
|
Suppliers’ Credit (In
days of sales) |
|
0,00 |
0,00 |
0,00 |
|
Working Capital (In days
of sales) |
389,00 |
6,90 |
35,76 |
82,30 |
|
Working Capital
Requirement (In days of sales) |
386,00 |
-16,74 |
12,78 |
47,85 |
|
Treasury (In days of
sales) |
3,00 |
5,35 |
17,04 |
43,20 |
|
Operating Current Assets |
2.145,00 |
117,91 |
161,95 |
222,75 |
|
BALANCE |
|
|
|
|
|
Working Capital |
106.801,16 |
9.668,64 |
73.548,89 |
198.215,76 |
|
Working Capital
Requirement |
105.952,73 |
-29.567,40 |
21.892,86 |
110.152,78 |
|
Treasury |
848,43 |
9.469,31 |
36.568,14 |
101.519,67 |
|
Balance Ratio |
2,36 |
1,11 |
1,83 |
3,97 |
|
SOLVENCY |
|
|
|
|
|
Borrowing Ratio |
72,17 |
51,40 |
70,31 |
84,03 |
|
Own / Permanent Funds |
100,00 |
56,88 |
86,07 |
100,00 |
|
Payback Capacity |
4,41 |
0,25 |
0,38 |
0,57 |
|
Long term Indebtedness |
|
0,00 |
4,99 |
17,40 |
|
Gearing |
359,38 |
205,75 |
336,83 |
626,00 |
|
Financing Basic Ratio |
1,00 |
0,99 |
1,00 |
1,00 |
|
Assets Guarantee |
1,38 |
1,14 |
1,38 |
1,90 |
|
LIQUIDITY |
|
|
|
|
|
General Liquidity |
1,22 |
1,05 |
1,30 |
1,84 |
|
Immediate Liquidity |
0,00 |
0,04 |
0,15 |
0,41 |
RATING EXPLANATIONS
|
RATING |
STATUS |
PROPOSED CREDIT LINE |
|
|
>86 |
Aaa |
Possesses an extremely sound financial
base with the strongest capability for timely payment of interest and
principal sums |
Unlimited |
|
71-85 |
Aa |
Possesses adequate working capital. No
caution needed for credit transaction. It has above average (strong)
capability for payment of interest and principal sums |
Large |
|
56-70 |
A |
Financial & operational base are
regarded healthy. General unfavourable factors will not cause fatal effect.
Satisfactory capability for payment of interest and principal sums |
Fairly Large |
|
41-55 |
Ba |
Overall operation is considered normal.
Capable to meet normal commitments. |
Satisfactory |
|
26-40 |
B |
Unfavourable & favourable factors
carry similar weight in credit consideration. Capability to overcome
financial difficulties seems comparatively below average/normal. |
Small |
|
11-25 |
Ca |
Adverse factors are apparent. Repayment of
interest and principal sums in default or expected to be in default upon
maturity |
Limited with full security |
|
<10 |
C |
Absolute credit risk exists. Caution
needed to be exercised |
Credit not recommended |
|
NR |
In view of the lack of information, we
have no basis upon which to recommend credit dealings |
No Rating |
|