
MIRA
INFORM REPORT
|
Report Date : |
22nd
January, 2007 |
IDENTIFICATION
DETAILS
|
Name : |
PRODIGIOS INTERACTIVOS S.A. |
|
|
|
|
Formerly Known As : |
AOL SPAIN S.A. |
|
|
|
|
Registered Office : |
Camino Can
Manuel - Par Bit, S/N 07120 Palma De Mallorca (Baleares), |
|
|
|
|
Country : |
Spain |
|
|
|
|
Financials (as on) : |
31.12.2004 |
|
|
|
|
Date of Incorporation : |
03.02.2000 |
|
|
|
|
Legal Form : |
Joint Stock Company |
|
|
|
|
Line of Business : |
Telecommunications |
RATING & COMMENTS
|
MIRA’s Rating : |
Ba |
|
RATING |
STATUS |
PROPOSED CREDIT LINE |
|
|
41-55 |
Ba |
Overall operation is considered normal.
Capable to meet normal commitments. |
Satisfactory |
|
Status : |
Satisfactory |
|
|
|
|
Payment Behaviour : |
Usually
Correct |
|
|
|
|
Litigation : |
Clear |
Identification and
Characteristics
Tax Number A07995434
NAME PRODIGIOS
INTERACTIVOS S.A.
ANAGRAM PRODIGIOS
FORMER NAME AOL
SPAIN S.A.
BUSINESS ADDRESS CAMINO
CAN MANUEL - PAR BIT, S/N
Postcode 07120
PALMA DE MALLORCA (BALEARES )
FORMER ADDRESS POLIGONO
DE SON CASTEL GREMIO DE TEJEDORES, 22
Postcode 07120
PALMA DE MALLORCA (BALEARES )
URL http://www.prodiges.com
TELEPHONE 971435121
FAX 971435135
LEGAL FORM JOINT
STOCK COMPANY
DATE FOUNDED 03/02/2000
CAPITAL 176.235,00 Euros
NUMBER OF EMPLOYEES 20
ACTIVITY 1760000 - Telecommunications
CNAE 6420 - Telecommunications
* Characteristics
of the main address
According to our researches
dated 02/05/2005 these are it is a/an office used as rented
located in a industrial area and it is located in an area main.
Clarifications:
Domicilio Social
Synthesis
FINANCIAL SITUATION
(Year ending: 31/12/2004)
![]()
PROFITABILITY ![]() 1/9 Negative
1/9 Negative
TREASURY ![]() 9/9 Excellent
9/9 Excellent
BALANCE SHEET ![]() 9/9 Excellent
9/9 Excellent
DEBT ![]() 7/9 Low
7/9 Low
INCIDENTS
![]()
COMMITMENTS ![]() 9/9 Respected
9/9 Respected
INCIDENTS ![]() 9/9 None
or Negligible
9/9 None
or Negligible
PREVIOUS EXPERIENCE
![]()
PREVIOUS EXPERIENCE ![]() 8/9 Favourable
8/9 Favourable
Credit Appraisal
CREDIT ACCORDING TO
OBJECTIVE DATA (From 0 to 6.000.000,00 Euros):
FAVOURABLE
TOWARDS 153.000,00 Max. Euros
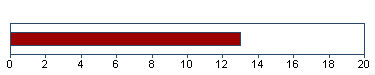
SOLVENCY RATING:
13/20 (BASED ON
HOMOGENEOUS FORMULATION)
Analysis made
on 02/01/2007
Financial Elements
Figures given in Euros
|
|
Balance sheet 2.002 (12) |
Balance sheet 2.003 (12) |
Balance sheet 2.004 (12) |
% Sales
|
|
SALES |
13.443.722,00 |
5.956.695,40 |
3.382.656,32 |
|
|
ADDED VALUE |
3.438.922,00 |
-954.089,96 |
-597.477,70 |
-17,66 |
|
BUSINESS RESULT |
-125.674.580,00 |
-9.656.622,46 |
-3.195.792,35 |
-94,47 |
|
OWN FUNDS |
16.206.914,00 |
6.550.291,55 |
3.354.499,20 |
|
|
DEBT |
4.441.496,00 |
2.656.468,22 |
2.300.027,03 |
|
|
TOTAL ASSET |
20.778.146,00 |
9.206.759,77 |
5.654.526,23 |
|
The sales of 3.382.656,32
Euros show a change of -43,21% compared with
2.003 . Between 2.002 and 2.003 , this change
was -55,69% .
Added value grew by
37,38% compared with the previous year. Shareholders equity are
3.354.499,20 Euros for an indebtedness of 2.300.027,03
Euros .
The result -3.195.792,35
Euros means financial profitability of -95,27% and
economic profitability of -56,52% . This result means growth of
66,91% compared with the 2.003 .
THE FIGURES FOR THE LAST BALANCE
SHEET ARE RELEVANT:
SOURCE: FROM THE MERCANTILE
REGISTER
DATE: 25/01/2006
Results Distribution
Annual Report Year Source:
2.004
Figures given in Euros
Distribution Base
Profit and Loss -3.195.792
Total of Amounts to
be distributed -3.195.792
Distribution a
Prior years losses -3.195.792
Auditors’ opinion:
FAVOURABLE (2.004)
Auditors:
AUDESTFIN GRUP SL
Comparative Sector Analysis
|
|
Company |
Sector |
Difference |
|
|
(2.004)
|
|
|
|
% of
PRODUCTION VALUE |
|
|
|
|
SALES |
97,82 |
96,60 |
1,22 |
|
ADDED
VALUE |
-17,28 |
37,81 |
-55,09 |
|
BUSINESS
RESULT |
-92,42 |
3,41 |
-95,83 |
|
% OF TOTAL
ASSETS |
|
|
|
|
OWN
FUNDS |
59,32 |
47,31 |
12,01 |
|
DEBT |
40,68 |
52,69 |
-12,01 |
Compared sector (CNAE): 642 -
Telecomunicaciones
Number of companies: 24
Size (Sales Figure): 2.800.000,00 -
7.000.000,00 Euros
The turnover of the company is
1,22% above the mean for the sector.
The company’s added value was
-17,28% s/ the production value, and 55,09% below the mean for the
sector.
The company’s business result
was -92,42% of the PV, 95,83% below the mean for the sector.
The company’s own resources are
59,32% , 12,01% above the mean for the sector.
The company’s outside resources
are 40,68% , 12,01% below the mean for the sector.
Legal Actions
LEGAL ACTIONS: 1 (
Last 06/10/2005 )
![]() Insolvency Proceeding: 0
Insolvency Proceeding: 0
![]() Civil Court: 0
Civil Court: 0
![]() Social Court/ Industrial Tribunal: 1
Social Court/ Industrial Tribunal: 1
No claims registered
for this company in the official sources
AFFECTED BY: No
significant elemento
Last Legal Actions
(Figures given
in Euros)
|
|||||
|
|
|||||
|
|
Information
Date |
Incidence
Status |
Actor |
Amount |
|
|
|
06/10/2005 |
SOCIAL LEGAL
ACTION |
POL DEL RIO
JESUS |
4.852,10 |
|
|
Total: 1 |
|||||
|
|
|||||
Main Board members, Directors and
Auditor
|
Position |
Surname and name |
Date of appointment |
|
CHAIRMAN |
DUBOIS GUINEA ALBERTO |
20/12/2002 |
|
VICE-PRESIDENT |
RUIZ DEL RIO OSCAR AURELIO |
11/06/2001 |
|
BOARD MEMBER |
PERSA SAENZ DE BURUAGA JUAN |
11/06/2001 |
|
BOARD MEMBER |
ALBRIT INVERSIONES SL |
20/12/2002 |
|
BOARD MEMBER |
NARVARTE ICHAZO IGNACIO |
20/12/2002 |
|
BOARD MEMBER |
SOL MELIA SA |
20/12/2002 |
|
BOARD MEMBER |
GARI EGUILLOR MANUEL |
20/12/2002 |
|
BOARD MEMBER |
PLANETA CORPORACION SL |
20/12/2002 |
|
BOARD MEMBER |
HOTELES SOL S L |
20/12/2002 |
|
AUDITOR |
ERNST YOUNG S L |
11/06/2001 |
Functional Managers
|
Position |
Surname and name |
|
FINANCIAL MANAGER |
TAPIA RAQUEL |
|
HUMAN RESOURCES MANAGER |
GARRIDO FELICIANO |
|
COMMERCIAL MANAGER |
TAPIA RAQUEL |
|
GENERAL MANAGER |
DUBOIS GUINEA ALBERTO |
|
MANAGER |
RUIZ DEL RIO OSCAR AURELIO |
Financial Links
|
Shareholders |
||||
|
Company Name |
CIF/Country |
|
Source |
Information Date |
|
PLANETA 2010 S.L. |
B61962544 |
40,00% |
M.REGISTER |
30/09/2002 |
|
RUIZ DEL RIO OSCAR |
|
38,00% |
M.REGISTER |
31/12/2004 |
|
EDITORIAL PLANETA SA |
A08186249 |
6,17% |
GACETA NEG |
04/08/2001 |
|
PRODIGIOS INTERACTIVOS S.A. |
A07995434 |
2,00% |
M.REGISTER |
31/12/2004 |
|
COMITIA S.A. |
A82698713 |
1,00% |
GACETA NEG |
04/08/2001 |
|
PALOMINO ANGEL |
|
Indet. |
CINCO DIAS |
11/12/2000 |
|
Shareholdings |
||||
|
Company Name |
CIF/Country |
Percent. |
Source |
Information Date |
|
PRODIGIOS INTERACTIVOS S.A. |
A07995434 |
2,00% |
M.REGISTER |
31/12/2004 |
Proceedings published in the
B.O.R.M.E. (Official Mercantile Register Gazette)
|
Proceedings |
Date |
Notice Num. |
Mercantile Reg. |
|
Capital decrease |
17/07/2006 |
366703 |
BALEARES |
|
Registration of accounts
(2004) |
20/12/2005 |
041761 |
BALEARES |
|
Resignations |
16/11/2005 |
479310 |
BALEARES |
|
Appointments |
16/11/2005 |
479310 |
BALEARES |
|
Re-elections |
08/03/2005 |
106855 |
BALEARES |
Press articles
09/05/2006 DIARIO
DE MALLORCA LEGAL ANNOUNCE
EN JUNTA GRAL.
EXTRAORDINARIA Y UNIVERSAL CELEBRADA EL 20/04/06 SE ACORDO, POR UNANIMIDAD,
REDUCIR EL CAPITAL SOCIAL EN LA CANTIDAD DE 10.722 EUROS, MEDIANTE LA
AMORTIZACION DE ACCIONES EN AUTOCARTERA. EL CAPITAL SOCIAL QUEDA CIFRADO TRAS
LA REDUCCION EN 176.235 EUROS.
12/08/2004 EL MUNDO
BALEARES LEGAL ANNOUNCE
LA JUNTA GRAL. DE ACCIONISTAS
DE ESTA SDAD., CELEBRADA EL 30/06/04, ACORDO REDUCIR EL CAPITAL SOCIAL EN
763.079 EUROS, DEJANDOLO CIFRADO EN 186.957 EU ROS.
Commercial Experience
SALES
Collection (estimated)
Credit sales percentage 100 %
Suppliers International
SOL MELIA SA
Total 1
Bank Entities
|
Entity |
Branch |
Branch Address |
Town |
Province |
|
BANCO DE SABADELL, S.A. |
|
|
PALMA DE MALLORCA |
|
|
BANCO SANTANDER CENTRAL
HISPANO, S.A. |
5250 |
AV. ALEXANDRE
ROSSELLO, 11 |
PALMA |
BALEARES |
The information on the last
account contained in this report is extracted from the Mercantile Register file
of the legal address of the Company and dated 25/01/2006
Balance Sheet (ASSETS)
|
(Figures given in Euros)
|
31/12/2002 (12)
|
31/12/2003 (12)
|
31/12/2004 (12)
|
|
|
|
A) DUE FROM SHAREHOLDERS FOR
UNCALLED CAPITAL |
|
|
|
|
|
B) FIXED ASSETS |
4.069.462,00 |
918.867,69 |
372.309,66 |
|
|
I. Establishment expenses |
|
|
|
|
|
II. Intangible assets |
2.924.802,00 |
207.887,91 |
106.335,52 |
|
|
Software |
2.478.083,00 |
507.761,89 |
507.761,89 |
|
|
Leasing |
2.729.867,00 |
|
|
|
|
Amortization |
-2.283.148,00 |
-299.873,98 |
-401.426,37 |
|
|
III. Tangible assets |
1.063.377,00 |
680.232,28 |
202.076,78 |
|
|
Machinery, equipment and other |
82.192,00 |
|
|
|
|
Other property plant and
equipement |
795.856,00 |
984.596,69 |
697.292,12 |
|
|
Prepaid expenses on fixed assets |
765,00 |
2.003,51 |
3.475,36 |
|
|
Other assets |
670.933,00 |
689.985,16 |
689.985,16 |
|
|
Depreciation |
-486.369,00 |
-996.353,08 |
-1.188.675,86 |
|
|
IV. Financial assets |
81.283,00 |
30.745,50 |
36.737,50 |
|
|
Long term deposits and
guarantees |
81.283,00 |
30.745,50 |
36.737,50 |
|
|
V. Owners equity |
|
2,00 |
27.159,86 |
|
|
VI. Long term trade
liabilities |
|
|
|
|
|
C) DEFERRED EXPENSES |
15.480,00 |
|
|
|
|
D) CURRENT ASSETS |
16.693.204,00 |
8.287.892,08 |
5.282.216,57 |
|
|
I. Not paid in shareholder
capital |
|
|
|
|
|
II. Inventory |
6.189.106,00 |
1.408.376,38 |
564.078,46 |
|
|
Goods available for sale |
6.114.520,00 |
5.448.960,00 |
4.951.920,00 |
|
|
Cash advance |
74.586,00 |
|
|
|
|
Provisions |
|
-4.040.583,62 |
-4.387.841,54 |
|
|
III. Debtors |
3.032.406,00 |
1.253.725,39 |
706.027,81 |
|
|
Clients |
3.887.830,00 |
2.267.105,04 |
1.581.619,18 |
|
|
Other debts |
49.232,00 |
123.555,34 |
|
|
|
Labor costs |
35.415,00 |
|
9.218,77 |
|
|
Taxes refunds |
1.507.601,00 |
149.753,51 |
309.718,45 |
|
|
Provisions |
-2.447.672,00 |
-1.286.688,50 |
-1.194.528,59 |
|
|
IV. Short term financial
assets |
3.470.600,00 |
281.180,00 |
2.879.212,45 |
|
|
Short term investment |
3.464.560,00 |
281.180,00 |
2.879.032,45 |
|
|
Other loans |
6.040,00 |
|
|
|
|
Short Term Deposit and
guarantees |
|
|
180,00 |
|
|
V. Short term owners equity |
|
|
|
|
|
VI. Cash |
4.001.092,00 |
5.344.610,31 |
1.132.897,85 |
|
|
VII. Prepaid expenses and
accrued income |
|
|
|
|
|
ASSETS (A + B + C + D) |
20.778.146,00 |
9.206.759,77 |
5.654.526,23 |
Balance Sheet (LIABILITIES)
|
(Figures given in Euros)
|
31/12/2002 (12)
|
31/12/2003 (12)
|
31/12/2004 (12)
|
|
|
|
A) SHAREHOLDERS EQUITY |
16.206.914,00 |
6.550.291,55 |
3.354.499,20 |
|
|
I. Capital |
950.036,00 |
950.036,01 |
186.957,01 |
|
|
II. Premium share account |
407.263.799,00 |
407.263.797,22 |
407.236.639,36 |
|
|
III. Revaluation reserve |
|
|
|
|
|
IV. Reserves |
|
2,00 |
790.238,86 |
|
|
Sinking fund from owner equity |
|
2,00 |
27.159,86 |
|
|
Other funds |
|
|
763.079,00 |
|
|
V. Prior year earnings |
-266.332.341,00 |
-392.006.921,22 |
-401.663.543,68 |
|
|
Prior years losses |
-266.332.341,00 |
-392.006.921,22 |
-401.663.543,68 |
|
|
VI. Prior year profit or
losses |
-125.674.580,00 |
-9.656.622,46 |
-3.195.792,35 |
|
|
VII. Dividend paid during the
year |
|
|
|
|
|
VIII. Own shares for change in
capital |
|
|
|
|
|
B) DEFERRED INCOME |
65.328,00 |
|
|
|
|
Rate difference |
65.328,00 |
|
|
|
|
C) PROVISIONS FOR LIABILITIES
AND EXPENSES |
64.408,00 |
|
|
|
|
Other provisions |
64.408,00 |
|
|
|
|
D) LONG TERM LIABILITIES |
|
|
22.500,00 |
|
|
I. Bonds |
|
|
|
|
|
II. Bank loans |
|
|
|
|
|
III. Debts with associed and
affiliated companies |
|
|
|
|
|
IV. Other creditors |
|
|
|
|
|
V. Deferred debts on shares |
|
|
22.500,00 |
|
|
Affiliated companies |
|
|
22.500,00 |
|
|
VI. Long term debt with
creditor |
|
|
|
|
|
E) SHORT TERM LIABILITIES |
4.441.496,00 |
2.656.468,22 |
2.277.527,03 |
|
|
I. Negotiable bonds |
|
|
|
|
|
II. Bank loans |
806.446,00 |
|
|
|
|
Leasing |
806.446,00 |
|
|
|
|
III. Short term debts with
associated and affiliated companies |
8.635,00 |
|
|
|
|
Associeted companies |
8.635,00 |
|
|
|
|
IV. Trade creditors |
2.114.782,00 |
1.357.575,03 |
858.570,41 |
|
|
Accounts payable |
295.097,00 |
205.762,08 |
29.017,14 |
|
|
Expenses |
1.752.136,00 |
1.015.333,87 |
829.553,27 |
|
|
Bills payable |
67.549,00 |
136.479,08 |
|
|
|
V. Other non trade payables |
1.511.633,00 |
1.298.893,19 |
1.418.956,62 |
|
|
Government |
146.113,00 |
97.514,96 |
127.190,98 |
|
|
Other debts |
679.744,00 |
493.793,23 |
466.751,07 |
|
|
Accounts receivable |
685.776,00 |
707.585,00 |
825.014,57 |
|
|
VI. Provisions for current
assets |
|
|
|
|
|
VII. Accruals and deferred
incomes |
|
|
|
|
|
F) SHORT TERM PROVISIONS FOR
LIABILITIES AND EXPENSES |
|
|
|
|
|
LIABILITIES (A + B + C + D + E
+ F) |
20.778.146,00 |
9.206.759,77 |
5.654.526,23 |
Profit and Loss Account
|
(Figures given in Euros)
|
31/12/2002 (12)
|
31/12/2003 (12)
|
31/12/2004 (12)
|
|
|
|
A) EXPENSES (A.1 a A.15) |
|
|
|
|
|
A.1 Operating Expenses |
|
665.559,99 |
497.218,80 |
|
|
A.3. Labor cost |
7.601.201,00 |
2.155.213,12 |
1.505.838,68 |
|
|
Wages |
6.665.390,00 |
1.937.548,11 |
1.362.484,84 |
|
|
Social security expenses |
935.811,00 |
217.665,01 |
143.353,84 |
|
|
A.3. Assets depreciation |
9.053.106,00 |
1.275.171,74 |
464.632,30 |
|
|
A.4. Variance in provision for
current assets |
2.208.073,00 |
5.268.174,14 |
428.630,19 |
|
|
A.5. Other operating costs |
10.671.961,00 |
6.287.236,93 |
3.558.259,04 |
|
|
A.I. OPERATING RESULT
(B.1-A.1-A.2-A.3-A.4-A.5) |
|
|
|
|
|
A.6. Financial expenses |
603.845,00 |
11.828,85 |
|
|
|
Debts with associated
companies |
433.288,00 |
|
|
|
|
Other companies debts |
170.557,00 |
11.828,85 |
|
|
|
A.7. Variation in financial
investments provision |
|
|
|
|
|
A.8. Exchange losses |
|
23.889,17 |
57.456,60 |
|
|
A.II. POSITIVE FINANCIAL
RESULTS (B.2+B.3-A.6-A.7-A.8) |
509.997,00 |
92.779,35 |
14.606,46 |
|
|
A.III. PROFIT FROM ORDINARY
ACTIVITIES (A.I+A.II-B.I-B.II) |
|
|
|
|
|
A.9. Variation in provision in
fixed assets |
150.586.025,00 |
|
|
|
|
A.10. Losses in fixed assets |
|
1.021.650,47 |
15.898,40 |
|
|
A.11. Losses from shares and bonds |
|
|
121.998,00 |
|
|
A.12. Extraordinary charges |
48.192,00 |
33,56 |
31.799,65 |
|
|
A.13. Prior year’s expenses
and losses |
2.789.863,00 |
125.527,55 |
166.432,53 |
|
|
A.IV. POSITIVE EXTRAORDINARY
RESULT (B.4+B.5+B.6+B.7+B.8-A.9-A.10-A.11-A.12-A.13) |
|
|
|
|
|
A.V. EARNINGS / LOSS BEFORE
TAXES (A.III+A.IV-B.III-B.IV) |
|
|
|
|
|
A.14. Corporate Taxes |
|
|
|
|
|
A.15. Other taxes |
|
|
|
|
|
A.VI. YEAR END RESULT (PROFIT)
(A.V-A.14-A.15) |
|
|
|
|
|
B) INCOMES (B.1 a B.8) |
|
|
|
|
|
B.1. Operating income |
14.110.883,00 |
5.998.706,96 |
3.458.000,14 |
|
|
Turnover |
13.443.722,00 |
5.956.695,40 |
3.382.656,32 |
|
|
Other operating income |
667.161,00 |
42.011,56 |
75.343,82 |
|
|
B.I. OPERATING LOSSES
(A.1+A.2+A.3+A.4+A.5-B.1) |
15.423.458,00 |
9.652.648,96 |
2.996.578,87 |
|
|
B.2. Financial Income |
487.928,00 |
128.218,25 |
68.384,61 |
|
|
Other |
487.928,00 |
128.218,25 |
68.384,61 |
|
|
B.3. Gains on exchange |
625.914,00 |
279,12 |
3.678,45 |
|
|
B.II. FINANCIAL LOSSES
(A.6+A.7+A.8-B.2-B.3) |
|
|
|
|
|
B.III. LOSSES FROM ORDINARY
ACTIVITIES (B.I+B.II-A.I-A.II) |
14.913.461,00 |
9.559.869,61 |
2.981.972,41 |
|
|
B.4. Gains from disposal of
fixed assets |
88.146,00 |
143.483,68 |
16.250,00 |
|
|
B.5. Gains from dealing in own
shares |
|
|
|
|
|
B.6. Paid in surplus |
|
|
|
|
|
B.7. Extraordinary income |
8.491.694,00 |
170.629,09 |
15.826,86 |
|
|
B.8. Prior year’s income and
profits |
34.083.121,00 |
736.345,96 |
90.231,78 |
|
|
B.IV. EXTRAORDINARY LOSSES
(A.9+A.10+A.11+A.12+A.13-B.4-B.5-B.6-B.7-B.8) |
110.761.119,00 |
96.752,85 |
213.819,94 |
|
|
B.V. LOSS BEFORE TAXES
(B.III+B.IV-A.III-A.IV) |
125.674.580,00 |
9.656.622,46 |
3.195.792,35 |
|
|
B.VI. NET LOSS (B.V+A.14+A.15) |
125.674.580,00 |
9.656.622,46 |
3.195.792,35 |
Main Ratios
|
(Figures given in Euros)
|
2.002 (12) |
2.003 (12) |
2.004 (12) |
|
|
|
ACTIVITY |
|
|
|
|
|
Increase of the Sales Figures |
216,17 |
-55,69 |
-43,21 |
|
|
Assets Turnover |
0,65 |
0,65 |
0,60 |
|
|
Productivity |
0,45 |
-0,44 |
-0,40 |
|
|
Increase of the Added Value |
114,18 |
-127,74 |
37,38 |
|
|
PROFITABILITY |
|
|
|
|
|
Economic Profitability |
-604,84 |
-104,89 |
-56,52 |
|
|
Financial Profitability |
-775,44 |
-147,42 |
-95,27 |
|
|
Financial Expenses |
4,49 |
0,20 |
|
|
|
BALANCE (IN DAYS OF SALES) |
|
|
|
|
|
Customers’ Credit (In days of
sales) |
81,00 |
76,00 |
75,00 |
|
|
Suppliers’ Credit (In days of
sales) |
|
734,00 |
622,00 |
|
|
Working Capital (In days of
sales) |
328,00 |
340,00 |
320,00 |
|
|
Working Capital Requirement
(In days of sales) |
150,00 |
0,00 |
0,00 |
|
|
Treasury (In days of sales) |
178,00 |
340,00 |
427,00 |
|
|
BALANCE |
|
|
|
|
|
Working Capital |
12.251.708,00 |
5.631.423,86 |
3.004.689,54 |
|
|
Working Capital Requirement |
5.586.462,00 |
5.633,55 |
-1.007.420,76 |
|
|
Treasury |
6.665.246,00 |
5.625.790,31 |
4.012.110,30 |
|
|
Balance Ratio |
4,00 |
7,13 |
9,07 |
|
|
SOLVENCY |
|
|
|
|
|
Borrowing Ratio |
21,38 |
28,85 |
40,68 |
|
|
Own / Permanent Funds |
99,21 |
100,00 |
99,33 |
|
|
Payback Capacity |
0,03 |
0,21 |
0,54 |
|
|
LIQUIDITY |
|
|
|
|
|
General Liquidity |
3,76 |
3,12 |
2,32 |
|
|
Immediate Liquidity |
1,68 |
2,12 |
1,76 |
Sectorial Analysis
Summary of Assets, Liability
& Equity
|
(Figures given in Percentages)
|
Company |
Sector |
Company |
|
|
2.004 |
|
|
|
Assets |
|||
|
DUE FROM
SHAREHOLDERS FOR UNCALLED CAPITAL |
0,00 |
0,00 |
0,00 |
|
FIXED ASSETS |
6,58 |
30,16 |
-23,58 |
|
ACCRUED
EXPENSES |
0,00 |
0,15 |
-0,15 |
|
CURRENT
ASSETS |
93,42 |
69,69 |
23,73 |
|
TOTAL ASSETS |
100,00 |
100,00 |
0,00 |
|
Liabilities |
|||
|
SHAREHOLDERS
EQUITY |
59,32 |
47,31 |
12,01 |
|
ACCRUED
INCOME |
0,00 |
1,22 |
-1,22 |
|
RISK AND
EXPENDITURE COVER |
0,00 |
0,73 |
-0,73 |
|
LONG-TERM
CREDITORS |
0,40 |
11,28 |
-10,88 |
|
SHORT-TERM
CREDITORS |
40,28 |
39,46 |
0,82 |
|
SHORT-TERM
RISK AND EXPENDITURE COVER |
0,00 |
0,00 |
0,00 |
|
TOTAL
LIABILITIES |
100,00 |
100,00 |
0,00 |
Analytical Account of Results
|
(Figures given in Percentages)
|
Company |
Sector |
Company |
|
|
2.004 |
|
|
|
Net turnover |
97,82 |
96,60 |
1,22 |
|
Other
operating income |
2,18 |
3,40 |
-1,22 |
|
Production
Value |
100,00 |
100,00 |
0,00 |
|
Operating
expenses |
14,38 |
43,90 |
-29,52 |
|
Other
operation expenses |
102,90 |
18,29 |
84,60 |
|
Added value |
-17,28 |
37,81 |
-55,09 |
|
Labor cost |
43,55 |
26,81 |
16,74 |
|
Gross
Economic Result |
-60,82 |
11,00 |
-71,82 |
|
Assets
depreciation |
13,44 |
5,54 |
7,90 |
|
Variation in
provision for current assets |
12,40 |
0,51 |
11,88 |
|
Net Economic
Result |
-86,66 |
4,94 |
-91,60 |
|
Financial
income |
2,08 |
0,54 |
1,54 |
|
Financial
expenses |
1,66 |
0,70 |
0,96 |
|
Variation in
financial investment provision |
0,00 |
0,37 |
-0,37 |
|
Ordinary
Activities Result |
-86,23 |
4,41 |
-90,64 |
|
Extraordinary
income |
3,54 |
0,91 |
2,62 |
|
Extraordinary
expenses |
9,72 |
0,54 |
9,18 |
|
Variation in
provision in fixed assets |
0,00 |
0,20 |
-0,20 |
|
Results
before Taxes |
-92,42 |
4,58 |
-96,99 |
|
Corporaye
taxes |
0,00 |
1,16 |
-1,16 |
|
Net Result |
-92,42 |
3,41 |
-95,83 |
|
Assets
depreciation |
13,44 |
5,54 |
7,90 |
|
Provisions
fund variation |
12,40 |
1,09 |
11,31 |
|
Net
Self-Financing |
-66,59 |
10,04 |
-76,63 |
Ratios
|
(Figures given in ) |
Company |
Ptile25 |
Medium |
Ptile75 |
|
|
2.004 |
|
|
|
|
ACTIVITY |
|
|
|
|
|
Increase of
the Sales Figures |
-43,21 |
-17,03 |
11,44 |
24,09 |
|
Assets
Turnover |
0,60 |
0,90 |
1,43 |
1,70 |
|
Fixed Assets
Turnover |
9,09 |
3,62 |
12,12 |
27,24 |
|
Increase of
the Added Value |
37,38 |
-5,96 |
16,47 |
31,86 |
|
PRODUCTIVITY |
|
|
|
|
|
Productivity |
-0,40 |
1,10 |
1,36 |
1,51 |
|
Change of
Personnel Costs |
-30,13 |
5,01 |
9,41 |
28,24 |
|
Average
Personnel Costs |
75.291,93 |
24.065,56 |
28.433,16 |
40.033,50 |
|
Value Added
by Employees |
-29.873,88 |
28.991,44 |
39.345,04 |
58.748,02 |
|
CASH FLOW |
|
|
|
|
|
Cash Flow |
-2.302.529,86 |
113.887,65 |
338.764,00 |
724.190,65 |
|
Operating
Cash Flow |
-2.103.316,38 |
97.918,00 |
327.889,33 |
678.200,53 |
|
Change in
Cash Flow |
26,04 |
-30,52 |
16,58 |
38,29 |
|
PROFITABILITY |
|
|
|
|
|
Economic
Profitability |
-56,52 |
1,31 |
3,05 |
6,51 |
|
Financial
Profitability |
-95,27 |
2,86 |
7,56 |
17,37 |
|
Financial
Expenses |
|
0,05 |
0,26 |
1,09 |
|
Gross
Economic Profitability |
-37,20 |
3,36 |
12,93 |
17,56 |
|
Gross
Financial Profitability |
-62,70 |
12,25 |
33,24 |
55,91 |
|
BALANCE (IN DAYS OF SALES) |
|
|
|
|
|
Customers’
Credit (In days of sales) |
75,00 |
86,15 |
148,56 |
189,60 |
|
Suppliers’
Credit (In days of sales) |
621,00 |
0,00 |
0,00 |
97,04 |
|
Working
Capital (In days of sales) |
319,00 |
25,18 |
47,13 |
123,00 |
|
Working
Capital Requirement (In days of sales) |
0,00 |
-4,43 |
33,70 |
59,65 |
|
Treasury (In
days of sales) |
426,00 |
6,32 |
31,21 |
69,46 |
|
Operating
Current Assets |
562,00 |
148,32 |
206,63 |
262,17 |
|
BALANCE |
|
|
|
|
|
Working
Capital |
3.004.689,54 |
250.865,86 |
517.374,06 |
1.436.418,13 |
|
Working
Capital Requirement |
-1.007.420,76 |
-48.117,48 |
250.030,38 |
693.145,87 |
|
Treasury |
4.012.110,30 |
61.059,61 |
387.990,52 |
664.792,73 |
|
Balance
Ratio |
9,07 |
1,50 |
2,70 |
4,34 |
|
SOLVENCY |
|
|
|
|
|
Borrowing
Ratio |
40,68 |
47,49 |
62,26 |
73,68 |
|
Own /
Permanent Funds |
99,33 |
72,51 |
94,96 |
99,88 |
|
Payback
Capacity |
0,54 |
0,30 |
0,42 |
0,54 |
|
Long term
Indebtedness |
0,40 |
0,00 |
0,65 |
5,01 |
|
Gearing |
168,56 |
190,62 |
265,36 |
380,00 |
|
Financing
Basic Ratio |
1,00 |
1,00 |
1,00 |
1,00 |
|
Assets
Guarantee |
2,46 |
1,28 |
1,45 |
1,96 |
|
LIQUIDITY |
|
|
|
|
|
General
Liquidity |
2,32 |
1,24 |
1,35 |
2,08 |
|
Immediate
Liquidity |
1,76 |
0,10 |
0,25 |
0,38 |
RATING EXPLANATIONS
|
RATING |
STATUS |
PROPOSED CREDIT LINE |
|
|
>86 |
Aaa |
Possesses an extremely sound financial
base with the strongest capability for timely payment of interest and
principal sums |
Unlimited |
|
71-85 |
Aa |
Possesses adequate working capital. No
caution needed for credit transaction. It has above average (strong)
capability for payment of interest and principal sums |
Large |
|
56-70 |
A |
Financial & operational base are
regarded healthy. General unfavourable factors will not cause fatal effect.
Satisfactory capability for payment of interest and principal sums |
Fairly Large |
|
41-55 |
Ba |
Overall operation is considered normal.
Capable to meet normal commitments. |
Satisfactory |
|
26-40 |
B |
Unfavourable & favourable factors
carry similar weight in credit consideration. Capability to overcome
financial difficulties seems comparatively below average/normal. |
Small |
|
11-25 |
Ca |
Adverse factors are apparent. Repayment of
interest and principal sums in default or expected to be in default upon
maturity |
Limited with full security |
|
<10 |
C |
Absolute credit risk exists. Caution
needed to be exercised |
Credit not recommended |
|
NR |
In view of the lack of information, we
have no basis upon which to recommend credit dealings |
No Rating |
|