
MIRA
INFORM REPORT
|
Report Date : |
23rd
January, 2007 |
IDENTIFICATION DETAILS
|
Name : |
INOX
IBERICA SA |
|
|
|
|
Registered Office : |
Calle Solsona - |
|
|
|
|
Country : |
|
|
|
|
|
Financials (as on) : |
31.12.2005 |
|
|
|
|
Date of Incorporation : |
01.12.1971 |
|
|
|
|
Legal Form : |
Joint Stock Company |
|
|
|
|
Line of Business : |
Wholesale of hardware, plumbing and heating equipment and
supplies |
RATING & COMMENTS
|
MIRA’s Rating : |
Aa |
|
RATING |
STATUS |
PROPOSED CREDIT LINE |
|
|
71-85 |
Aa |
Possesses adequate working capital. No
caution needed for credit transaction. It has above average (strong)
capability for payment of interest and principal sums |
Large |
|
Status : |
Good |
|
|
|
|
Payment Behaviour : |
Regular |
|
|
|
|
Litigation : |
Clear |
Identification and
Characteristics
Tax Number A08280323
NAME INOX
IBERICA SA
TRADE NAME NOX
IBERICA, S.A.
BUSINESS ADDRESS CALLE
SOLSONA - PG
Postcode 08130
SANTA PERPETUA DE MOGODA (
FORMER ADDRESS CALLE
Postcode 08120
LA LLAGOSTA (
URL http://www.inoxiberica.com
TELEPHONE 935653001
FAX 935653010
LEGAL FORM JOINT
STOCK COMPANY
DATE FOUNDED 01/12/1971
CAPITAL 60.200,00 Euros
PAID-UP CAPITAL 60.200,00 Euros
NUMBER OF EMPLOYEES 32
ACTIVITY 1615700 - Comercio
al por mayor de ferreteria, fontaneria y
calefaccion
CNAE 5154 - Wholesale
of hardware, plumbing and heating equipment
and
supplies
EXPORT COMPANY YES
IMPORT COMPANY YES
* Characteristics
of the main address
According to our researches
dated 22/09/2003 these are it is
a/an office, warehouse used as shared premises
located in a industrial area and it is located in an
area main .
Clarifications:
Domicilio Social Terreno de
23.500 m2 construidos 8.264 m2 propiedad de Hastinik
Hastinik SA, Tubasol
S.A, Cuic
Synthesis
FINANCIAL SITUATION
(Year ending: 31/12/2005)
![]()
PROFITABILITY ![]() 5/9 Medium
5/9 Medium
TREASURY ![]() 9/9 Excellent
9/9 Excellent
BALANCE SHEET ![]() 9/9 Excellent
9/9 Excellent
DEBT ![]() 8/9 Very
low
8/9 Very
low
INCIDENTS
![]()
COMMITMENTS ![]() 9/9 Respected
9/9 Respected
INCIDENTS ![]() 9/9 None
or Negligible
9/9 None
or Negligible
PREVIOUS EXPERIENCE
![]()
PREVIOUS EXPERIENCE ![]() 8/9 Favourable
8/9 Favourable
Credit Appraisal
CREDIT ACCORDING TO
OBJECTIVE DATA (From 0 to 6.000.000,00 Euros):
FAVOURABLE
TOWARDS 329.997,72 Max.
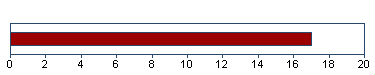
SOLVENCY RATING:
17/20 (BASED ON
HOMOGENEOUS FORMULATION)
Financial Elements
Figures given in Euros
|
|
Balance sheet 2.003 (12) |
Balance sheet 2.004 (12) |
Balance sheet 2.005 (12) |
% Sales
|
|
SALES |
5.380.187,74 |
5.771.400,81 |
6.677.247,97 |
|
|
ADDED VALUE |
1.062.082,34 |
1.450.089,34 |
1.468.310,14 |
21,99 |
|
BUSINESS RESULT |
126.894,89 |
320.607,61 |
320.437,11 |
4,80 |
|
OWN FUNDS |
3.635.205,80 |
3.955.813,41 |
4.276.250,52 |
|
|
DEBT |
1.217.757,68 |
1.288.035,39 |
1.530.065,20 |
|
|
TOTAL ASSET |
4.852.963,48 |
5.243.848,80 |
5.806.315,72 |
|
The sales of
6.677.247,97 Euros show a change of 15,70%
compared with 2.004 . Between 2.003 and
2.004 , this change was 7,27% .
Added value grew by
1,26% compared with the previous year. Shareholders equity are
4.276.250,52 Euros for an indebtedness of 1.530.065,20
Euros .
The result
320.437,11 Euros means financial profitability of
7,49% and economic profitability of 5,52% . This result
means growth of -0,05% compared with the 2.004 .
THE FIGURES FOR THE
LAST BALANCE SHEET ARE RELEVANT:
SOURCE: FROM THE
MERCANTILE REGISTER
DATE: 12/12/2006
Results Distribution
Annual Report Year
Source: 2.005
Figures given in
Euros
Distribution Base
Profit
and Loss 320.437
Total
of Amounts to be distributed 320.437
Distribution a
Voluntary
Reserve 320.437
Auditors’ opinion:
FAVOURABLE (2.005)
Auditors:
GASSO AUDITORES SL
Comparative Sector Analysis
|
|
Company |
Sector |
Difference |
|
|
(2.005)
|
|
|
|
% of
PRODUCTION VALUE |
|
|
|
|
SALES |
97,68 |
99,35 |
-1,67 |
|
ADDED
VALUE |
21,48 |
15,73 |
5,75 |
|
BUSINESS
RESULT |
4,69 |
2,83 |
1,86 |
|
% OF TOTAL
ASSETS |
|
|
|
|
OWN
FUNDS |
73,65 |
36,86 |
36,79 |
|
DEBT |
26,35 |
63,14 |
-36,79 |
Compared sector (CNAE): 515 - Comercio al por
mayor de productos no agrarios semielaborados, chatarra y productos de desecho
Number of companies: 1.353
Size (Sales Figure): 2.800.000,00 -
7.000.000,00 Euros
The turnover of the company is
1,67% below the mean for the sector.
The company’s added value was
21,48% s/ the production value, and 5,75% above the mean for the
sector.
The company’s business result
was 4,69% of the PV, 1,86% above the mean for the sector.
The company’s own resources are
73,65% , 36,79% above the mean for the sector.
The company’s outside resources
are 26,35% , 36,79% below the mean for the sector.
Legal Actions
No legal incidences
registered for this company in the official source
No claims registered
for this company in the official sources
AFFECTED BY: No
significant elemento
Main Board members, Directors and
Auditor
|
Position |
Surname and name |
Date of appointment |
|
ADMINISTRATOR |
GIRONES TEIXIDOR CARLOS |
12/04/2002 |
|
AUDITOR |
GASSO Y CIA AUDITORES CENSORES
JURADOS DE CUENTAS |
19/01/2004 |
Functional Managers
|
Position |
Surname and name |
|
FINANCIAL MANAGER |
CASES GONZALEZ JUAN MIGUEL |
|
PURCHASES MANAGER |
CUFFI ROVIRA ORIOL |
|
COMPUTING MANAGER |
GUARDIOLA GUERRERO JAIME |
|
MANAGER |
GIRONES TEIXIDOR CARLOS |
Financial Links
|
Shareholders |
||||
|
Company Name |
|
|
Source |
Information Date |
|
GIRONES TEIXIDOR CARLOS |
|
100,00% |
OWN SOURCES |
11/01/2007 |
|
Shareholdings |
|||||
|
Company Name |
CIF/Country |
Percent. |
Source |
Information Date |
|
|
CUIC |
A08870958 |
97,70% |
M.REGISTER |
31/12/2005 |
|
|
FABRINU S.L. |
B08857443 |
80,40% |
M.REGISTER |
31/12/2005 |
|
|
|
A58887951 |
65,00% |
M.REGISTER |
31/12/2005 |
|
|
AEROTECNICA SDAD ANMA |
A08425662 |
6,00% |
ANNUAL REP. |
31/12/2005 |
|
|
|
Company with
solvency rating below 7 |
||||
Proceedings published in the
B.O.R.M.E. (Official Mercantile Register Gazette)
|
Proceedings |
Date |
Notice Num. |
Mercantile Reg. |
|
Registration of accounts
(2005) |
05/01/2007 |
018402 |
|
|
Appointments |
01/02/2006 |
052730 |
|
|
Registration of accounts
(2004) |
28/11/2005 |
990945 |
|
|
Appointments |
15/07/2005 |
320726 |
|
|
Appointments |
29/03/2005 |
140329 |
|
Press articles
16/01/1999 EL P.
CATALUNYA LEGAL ANNOUNCE
EN LA JUNTA GRAL.
EXTRAORDINARIA Y UNIVERSAL DE ACCIONISTAS, CELEBRADA EL 31/12/98, SE ACORDO
TRASLADAR EL DOMICILIO SOCIAL DE ESTA CIA. SITO EN LA C/ BARCELONA, 22, DE LA
LLAGOSTA (BARCELONA), A LA C/ SOLSONA, 3, DEL POLIGONO INDUSTRIAL LA FLORIDA,
DE SANTA PERPETUA DE MOGODA (BARCELONA).
Complementary Information
11/02/03 BLOQUE DE
INVESTIGACION:
- Su actividad
concreta es el comercio al mayor de tornilleria.
- realiza operaciones
intracomunitarias de inportacion y exportacion
----------------------------------------------------------------------
El Bloque de
Investigacion no esta sujeto a actualizaciones sistemati-
cas. Los datos
mostrados fueron aportados por las fuentes consultadas
en la fecha
Brands, Signs and Commercial
Names
|
Prevailing
Commercial Names |
|||||
|
Name: |
NOX
IBERICA, S.A. |
||||
|
Kind of
Brand: |
JOINT |
File: |
N207659 |
||
|
Request Date: |
07/03/1996 |
Bulletin
Date: |
Bulletin
Date: |
Current
situation: |
RENEWED REGISTER
|
|
Types: 6
7 8 35 39 42 |
|
||||
Total Marcas: 1
Branches
|
Road |
Postal Code |
Town |
Province |
|
INDUSTRIAL AYALA |
01476 |
AYALA / AIARA |
ALAVA |
|
SOLSONA |
08130 |
SANTA PERPETUA DE
MOGODA |
|
|
INDUSTRIAL LA CHAPARRILLA |
41016 |
SEVILLA |
SEVILLA |
Commercial Experience
PURCHASES
Import Percentage: 70%
Imports::
Italia, Alemania, Francia y otros paises europeos
SALES
Collection (estimated)
Credit sales percentage 100 %
Export Percentage: 5%
Exports::
Bank Entities
|
Entity |
Branch |
Branch Address |
Town |
Province |
|
BANCO SANTANDER CENTRAL
HISPANO, S.A. |
1819 |
URGEL, 257 |
|
|
|
BANCO DE SABADELL, S.A. |
|
|
GRANOLLERS |
|
|
BANCO BILBAO VIZCAYA
ARGENTARIA, S.A. |
4330 |
BALMES, 1 |
MOLLET |
|
|
BANCO DE SABADELL, S.A. |
|
|
|
|
|
CAJA DE AHORROS Y M.P. |
|
|
|
|
The information on the last
account contained in this report is extracted from the Mercantile Register file
of the legal address of the Company and dated 12/12/2006
Balance Sheet (ASSETS)
|
(Figures given in Euros)
|
31/12/2003 (12)
|
31/12/2004 (12)
|
31/12/2005 (12)
|
|
|
|
A) DUE FROM SHAREHOLDERS FOR
UNCALLED CAPITAL |
|
|
|
|
|
B) FIXED ASSETS |
753.918,10 |
699.377,21 |
674.390,76 |
|
|
I. Establishment expenses |
|
|
|
|
|
II. Intangible assets |
70.772,43 |
34.664,38 |
15.640,16 |
|
|
Concessions, patents,licences
, trademarks |
102,77 |
102,77 |
102,77 |
|
|
Software |
54.151,19 |
54.151,19 |
54.151,19 |
|
|
Leasing |
149.473,20 |
115.170,27 |
31.000,01 |
|
|
Amortization |
-132.954,73 |
-134.759,85 |
-69.613,81 |
|
|
III. Tangible assets |
274.762,30 |
269.155,77 |
262.876,84 |
|
|
Property, plant and equipment |
278.228,94 |
278.228,94 |
278.228,94 |
|
|
Machinery, equipment and other |
119.394,89 |
137.117,40 |
154.246,25 |
|
|
Other property plant and
equipement |
143.223,58 |
143.223,58 |
143.223,58 |
|
|
Other assets |
76.093,46 |
75.532,75 |
125.201,74 |
|
|
Depreciation |
-342.178,57 |
-364.946,90 |
-438.023,67 |
|
|
IV. Financial assets |
408.383,37 |
395.557,06 |
395.873,76 |
|
|
Shares in affiliated companies |
432.739,87 |
432.739,87 |
432.739,87 |
|
|
Long term deposits and
guarantees |
1.486,02 |
1.883,71 |
2.200,41 |
|
|
Provisions |
-25.842,52 |
-39.066,52 |
-39.066,52 |
|
|
V. Owners equity |
|
|
|
|
|
VI. Long term trade
liabilities |
|
|
|
|
|
C) DEFERRED EXPENSES |
4.827,34 |
1.758,61 |
458,28 |
|
|
D) CURRENT ASSETS |
4.094.218,04 |
4.542.712,98 |
5.131.466,68 |
|
|
I. Not paid in shareholder
capital |
|
|
|
|
|
II. Inventory |
1.434.392,42 |
1.564.195,37 |
1.843.494,63 |
|
|
Goods available for sale |
1.434.392,42 |
1.564.195,37 |
1.843.494,63 |
|
|
III. Debtors |
1.858.646,28 |
2.041.820,88 |
2.366.772,81 |
|
|
Clients |
2.486.865,58 |
2.467.565,05 |
2.806.522,24 |
|
|
Amounts owned by affiliated
companies |
|
193.842,00 |
187.361,00 |
|
|
Taxes refunds |
4.158,44 |
17.376,31 |
21.933,55 |
|
|
Provisions |
-632.377,74 |
-636.962,48 |
-649.043,98 |
|
|
IV. Short term financial
assets |
607.226,89 |
818.967,70 |
672.933,58 |
|
|
Loans to associated companies |
|
|
120.225,00 |
|
|
Short term investment |
607.226,89 |
818.967,70 |
552.708,58 |
|
|
V. Short term owners equity |
|
|
|
|
|
VI. Cash |
193.952,45 |
117.729,03 |
240.343,66 |
|
|
VII. Prepaid expenses and
accrued income |
|
|
7.922,00 |
|
|
ASSETS (A + B + C + D) |
4.852.963,48 |
5.243.848,80 |
5.806.315,72 |
Balance Sheet (LIABILITIES)
|
(Figures given in Euros)
|
31/12/2003 (12)
|
31/12/2004 (12)
|
31/12/2005 (12)
|
|
|
|
A) SHAREHOLDERS EQUITY |
3.635.205,80 |
3.955.813,41 |
4.276.250,52 |
|
|
I. Capital |
60.200,00 |
60.200,00 |
60.200,00 |
|
|
II. Premium share account |
31.002,61 |
31.002,61 |
31.002,61 |
|
|
III. Revaluation reserve |
|
|
|
|
|
IV. Reserves |
3.417.108,30 |
3.544.003,19 |
3.864.610,80 |
|
|
Retained earnings |
12.020,24 |
12.020,24 |
12.020,24 |
|
|
Statuatory reserve |
1.039.044,93 |
1.039.044,93 |
1.039.044,93 |
|
|
Other funds |
2.366.043,13 |
|
2.813.545,63 |
|
|
Capital adjustments in Euros |
|
2.492.938,02 |
|
|
|
V. Prior year earnings |
|
|
|
|
|
VI. Prior year profit or
losses |
126.894,89 |
320.607,61 |
320.437,11 |
|
|
VII. Dividend paid during the
year |
|
|
|
|
|
VIII. Own shares for change in
capital |
|
|
|
|
|
B) DEFERRED INCOME |
|
|
|
|
|
C) PROVISIONS FOR LIABILITIES
AND EXPENSES |
|
|
|
|
|
D) LONG TERM LIABILITIES |
60.676,72 |
29.131,91 |
8.043,45 |
|
|
I. Bonds |
|
|
|
|
|
II. Bank loans |
60.676,72 |
29.131,91 |
8.043,45 |
|
|
Leasing |
60.676,72 |
29.131,91 |
8.043,45 |
|
|
III. Debts with associed and
affiliated companies |
|
|
|
|
|
IV. Other creditors |
|
|
|
|
|
V. Deferred debts on shares |
|
|
|
|
|
VI. Long term debt with
creditor |
|
|
|
|
|
E) SHORT TERM LIABILITIES |
1.157.080,96 |
1.258.903,48 |
1.522.021,75 |
|
|
I. Negotiable bonds |
|
|
|
|
|
II. Bank loans |
419.267,54 |
206.935,74 |
290.268,79 |
|
|
Loans and other debts |
382.038,54 |
188.062,74 |
282.213,79 |
|
|
Leasing |
37.229,00 |
18.873,00 |
8.055,00 |
|
|
III. Short term debts with
associated and affiliated companies |
|
132.593,00 |
142.232,00 |
|
|
With affiliated companies |
|
132.593,00 |
142.232,00 |
|
|
IV. Trade creditors |
609.922,73 |
564.135,07 |
757.330,96 |
|
|
Expenses |
609.922,73 |
564.135,07 |
757.330,96 |
|
|
V. Other non trade payables |
127.890,69 |
355.239,67 |
332.190,00 |
|
|
Government |
102.971,54 |
305.178,14 |
277.102,00 |
|
|
Other debts |
119,15 |
161,53 |
288,00 |
|
|
Accounts receivable |
24.800,00 |
49.900,00 |
54.800,00 |
|
|
VI. Provisions for current
assets |
|
|
|
|
|
VII. Accruals and deferred
incomes |
|
|
|
|
|
F) SHORT TERM PROVISIONS FOR
LIABILITIES AND EXPENSES |
|
|
|
|
|
LIABILITIES (A + B + C + D + E
+ F) |
4.852.963,48 |
5.243.848,80 |
5.806.315,72 |
Profit and Loss Account
|
(Figures given in Euros)
|
31/12/2003 (12)
|
31/12/2004 (12)
|
31/12/2005 (12)
|
|
|
|
A) EXPENSES (A.1 a A.16) |
|
|
|
|
|
A.1. Change in stocks of
finished goods and work in progress |
|
|
|
|
|
A.2. Supplies |
3.713.500,90 |
3.829.218,72 |
4.658.399,12 |
|
|
Material consumed |
3.666.842,92 |
3.789.423,94 |
4.598.910,66 |
|
|
Raw materials consumed |
12.538,80 |
10.497,67 |
24.555,03 |
|
|
Other expenses |
34.119,18 |
29.297,11 |
34.933,43 |
|
|
A.3. Labor cost |
829.694,27 |
917.089,67 |
977.107,38 |
|
|
Wages |
647.585,51 |
723.692,76 |
772.222,49 |
|
|
Social security expenses |
182.108,76 |
193.396,91 |
204.884,89 |
|
|
A.4. Assets depreciation |
44.641,52 |
42.506,58 |
25.303,15 |
|
|
A.5 Variance in provision for
current assets |
36.918,65 |
4.584,74 |
12.081,50 |
|
|
Variance in provision for bad
debts |
36.918,65 |
4.584,74 |
12.081,50 |
|
|
A.6. Other operating costs |
766.209,66 |
668.910,62 |
709.266,38 |
|
|
External costs |
755.142,89 |
657.544,66 |
700.307,61 |
|
|
Taxes |
11.066,77 |
11.365,96 |
8.958,77 |
|
|
A.I. OPERATING RESULT
(B.1+B.2+B.3+B.4-A.1-A.2-A.3-A.4-A.5-A.6) |
150.827,90 |
485.908,35 |
453.818,11 |
|
|
A.7. Financial expenses |
40.123,98 |
22.805,73 |
29.599,02 |
|
|
Other companies debts |
40.123,98 |
22.805,73 |
29.599,02 |
|
|
A.8. Variation in financial
investments provision |
|
13.224,00 |
|
|
|
A.9. Exchange losses |
15.068,75 |
15.414,49 |
|
|
|
A.II. POSITIVE FINANCIAL RESULTS
(B.5+B.6+B.7+B.8-A.7-A.8-A.9) |
26.747,86 |
|
22.474,65 |
|
|
A.III. PROFIT FROM ORDINARY
ACTIVITIES (A.I+A.II-B.I-B.II) |
177.575,76 |
484.332,26 |
476.292,76 |
|
|
A.10. Variation in provision
in fixed assets |
|
|
|
|
|
A.11. Losses in fixed assets |
|
|
|
|
|
A.12. Losses from shares and
bonds |
|
|
|
|
|
A.13. Extraordinary charges |
692,10 |
405,77 |
125,70 |
|
|
A.14. Prior year’s expenses
and losses |
2.508,00 |
|
|
|
|
A.IV. POSITIVE EXTRAORDINARY
RESULT (B.9+B.10+B.11+B.12+B.13-A.10-A.11-A.12-A.13-A.14) |
17.647,14 |
1.975,45 |
7.441,06 |
|
|
A.V. EARNINGS / LOSS BEFORE
TAXES (A.III+A.IV-B.III-B.IV) |
195.222,90 |
486.307,71 |
483.733,82 |
|
|
A.15. Corporate Taxes |
68.328,01 |
165.700,10 |
163.296,71 |
|
|
A.16. Other taxes |
|
|
|
|
|
A.VI. YEAR END RESULT (PROFIT)
(A.V-A.15-A.16) |
126.894,89 |
320.607,61 |
320.437,11 |
|
|
B) INCOMES (B.1 a B13) |
|
|
|
|
|
B.1. Turnover |
5.380.187,74 |
5.771.400,81 |
6.677.247,97 |
|
|
Sales |
5.380.187,74 |
5.775.649,81 |
6.677.247,97 |
|
|
Services provided |
|
-4.249,00 |
|
|
|
B.2. Increase in inventory of
finished goods |
|
|
|
|
|
B.3. Expenses capitalized |
|
|
|
|
|
B.4. Other operating income |
161.605,16 |
176.817,87 |
158.727,67 |
|
|
Other incomes |
161.605,16 |
176.817,87 |
158.727,67 |
|
|
B.I. OPERATING LOSSES
(A.1+A.2+A.3+A.4+A.5+A.6-B.1-B.2-B.3-B.4) |
|
|
|
|
|
B.5. Incomes from share |
|
|
|
|
|
B.6. Income from securities |
|
|
|
|
|
B.7. Other income from interrest |
53.526,62 |
44.407,19 |
52.073,67 |
|
|
From other companies |
53.526,62 |
44.407,19 |
52.073,67 |
|
|
B.8. Gains on exchange |
28.413,97 |
5.460,94 |
|
|
|
B.II. FINANCIAL LOSSES
(A.7+A.8+A.9-B.5-B.6-B.7-B.8) |
|
1.576,09 |
|
|
|
B.III. LOSSES FROM ORDINARY
ACTIVITIES (B.I+B.II-A.I-A.II) |
|
|
|
|
|
B.9. Gains from disposal of
fixed assets |
|
862,00 |
4.500,00 |
|
|
B.10. Gains from dealing in
own shares |
|
|
|
|
|
B.11. Paid in surplus |
|
|
|
|
|
B.12. Extraordinary income |
20.847,24 |
1.519,22 |
3.066,76 |
|
|
B.13. Prior year’s income and
profits |
|
|
|
|
|
B.IV. EXTRAORDINARY LOSSES
(A.10+A.11+A.12+A.13+A.14-B.9-B.10-B.11-B.12-B.13) |
|
|
|
|
|
B.V. LOSS BEFORE TAXES
(B.III+B.IV-A.III-A.IV) |
|
|
|
|
|
B.VI. NET LOSS (B.V+A.15+A.16) |
|
|
|
Main Ratios
|
(Figures given in Euros)
|
2.003 (12) |
2.004 (12) |
2.005 (12) |
|
|
|
ACTIVITY |
|
|
|
|
|
Increase of the Sales Figures |
-7,46 |
7,27 |
15,70 |
|
|
Assets Turnover |
1,11 |
1,10 |
1,15 |
|
|
Productivity |
1,28 |
1,58 |
1,50 |
|
|
Increase of the Added Value |
-11,38 |
36,53 |
1,26 |
|
|
PROFITABILITY |
|
|
|
|
|
Economic Profitability |
2,62 |
6,11 |
5,52 |
|
|
Financial Profitability |
3,49 |
8,11 |
7,49 |
|
|
Financial Expenses |
0,75 |
0,40 |
0,44 |
|
|
BALANCE (IN DAYS OF SALES) |
|
|
|
|
|
Customers’ Credit (In days of
sales) |
124,00 |
127,00 |
128,00 |
|
|
Suppliers’ Credit (In days of
sales) |
59,00 |
53,00 |
59,00 |
|
|
Working Capital (In days of
sales) |
197,00 |
205,00 |
195,00 |
|
|
Working Capital Requirement
(In days of sales) |
171,00 |
159,00 |
161,00 |
|
|
Treasury (In days of sales) |
26,00 |
46,00 |
34,00 |
|
|
BALANCE |
|
|
|
|
|
Working Capital |
2.937.137,08 |
3.283.809,50 |
3.609.444,93 |
|
|
Working Capital Requirement |
2.555.225,28 |
2.554.048,51 |
2.986.436,48 |
|
|
Treasury |
381.911,80 |
729.760,99 |
623.008,45 |
|
|
Balance Ratio |
4,87 |
5,68 |
6,35 |
|
|
SOLVENCY |
|
|
|
|
|
Borrowing Ratio |
25,09 |
24,56 |
26,35 |
|
|
Own / Permanent Funds |
98,36 |
99,27 |
99,81 |
|
|
Payback Capacity |
0,22 |
0,22 |
0,23 |
|
|
LIQUIDITY |
|
|
|
|
|
General Liquidity |
3,54 |
3,61 |
3,37 |
|
|
Immediate Liquidity |
0,69 |
0,74 |
0,60 |
Sectorial Analysis
Summary of Assets, Liability
& Equity
|
(Figures given in Percentages)
|
Company |
Sector |
Company |
|
|
2.005 |
|
|
|
Assets |
|||
|
DUE FROM
SHAREHOLDERS FOR UNCALLED CAPITAL |
0,00 |
0,16 |
-0,16 |
|
FIXED ASSETS |
11,61 |
26,46 |
-14,85 |
|
ACCRUED
EXPENSES |
0,01 |
0,38 |
-0,37 |
|
CURRENT
ASSETS |
88,38 |
72,99 |
15,39 |
|
TOTAL ASSETS |
100,00 |
100,00 |
0,00 |
|
Liabilities |
|||
|
SHAREHOLDERS
EQUITY |
73,65 |
36,86 |
36,79 |
|
ACCRUED
INCOME |
0,00 |
0,27 |
-0,27 |
|
RISK AND
EXPENDITURE COVER |
0,00 |
0,11 |
-0,11 |
|
LONG-TERM
CREDITORS |
0,14 |
9,60 |
-9,46 |
|
SHORT-TERM
CREDITORS |
26,21 |
53,14 |
-26,93 |
|
SHORT-TERM
RISK AND EXPENDITURE COVER |
0,00 |
0,02 |
-0,02 |
|
TOTAL
LIABILITIES |
100,00 |
100,00 |
0,00 |
Analytical Account of Results
|
(Figures given in Percentages)
|
Company |
Sector |
Company |
|
|
2.005 |
|
|
|
Net turnover |
97,68 |
99,35 |
-1,68 |
|
Other
operating income |
2,32 |
0,65 |
1,68 |
|
Production
Value |
100,00 |
100,00 |
0,00 |
|
Operating
expenses |
68,15 |
75,71 |
-7,57 |
|
Other
operation expenses |
10,38 |
8,55 |
1,82 |
|
Added value |
21,48 |
15,73 |
5,75 |
|
Labor cost |
14,29 |
9,25 |
5,05 |
|
Gross
Economic Result |
7,19 |
6,48 |
0,70 |
|
Assets
depreciation |
0,37 |
1,54 |
-1,17 |
|
Variation in
provision for current assets |
0,18 |
0,32 |
-0,15 |
|
Net Economic
Result |
6,64 |
4,62 |
2,02 |
|
Financial
income |
0,76 |
0,36 |
0,40 |
|
Financial
expenses |
0,43 |
1,06 |
-0,63 |
|
Variation in
financial investment provision |
0,00 |
-0,00 |
0,00 |
|
Ordinary
Activities Result |
6,97 |
3,92 |
3,05 |
|
Extraordinary
income |
0,11 |
0,35 |
-0,24 |
|
Extraordinary
expenses |
0,00 |
0,18 |
-0,18 |
|
Variation in
provision in fixed assets |
0,00 |
-0,01 |
0,01 |
|
Results
before Taxes |
7,08 |
4,10 |
2,97 |
|
Corporaye
taxes |
2,39 |
1,27 |
1,12 |
|
Net Result |
4,69 |
2,83 |
1,86 |
|
Assets
depreciation |
0,37 |
1,54 |
-1,17 |
|
Provisions
fund variation |
0,18 |
0,31 |
-0,14 |
|
Net
Self-Financing |
5,23 |
4,68 |
0,55 |
Ratios
|
(Figures given in ) |
Company |
Ptile25 |
Medium |
Ptile75 |
|
|
2.005 |
|
|
|
|
ACTIVITY |
|
|
|
|
|
Increase of
the Sales Figures |
15,70 |
-2,54 |
4,81 |
14,02 |
|
Assets
Turnover |
1,15 |
1,32 |
1,71 |
2,19 |
|
Fixed Assets
Turnover |
9,89 |
4,49 |
8,42 |
19,09 |
|
Increase of
the Added Value |
1,26 |
-5,50 |
4,97 |
16,49 |
|
PRODUCTIVITY |
|
|
|
|
|
Productivity |
1,50 |
1,40 |
1,64 |
2,04 |
|
Change of
Personnel Costs |
6,54 |
2,34 |
8,67 |
17,78 |
|
Average
Personnel Costs |
31.519,59 |
18.634,23 |
23.415,17 |
30.196,35 |
|
Value Added
by Employees |
47.364,84 |
30.556,31 |
40.196,12 |
55.735,89 |
|
CASH FLOW |
|
|
|
|
|
Cash Flow |
357.821,76 |
85.486,06 |
147.999,40 |
238.928,91 |
|
Operating
Cash Flow |
491.202,76 |
131.456,00 |
207.933,15 |
323.838,89 |
|
Change in
Cash Flow |
-6,06 |
-19,19 |
3,62 |
23,20 |
|
PROFITABILITY |
|
|
|
|
|
Economic
Profitability |
5,52 |
1,53 |
3,38 |
6,57 |
|
Financial
Profitability |
7,49 |
6,07 |
11,23 |
17,87 |
|
Financial
Expenses |
0,44 |
0,33 |
0,75 |
1,44 |
|
Gross
Economic Profitability |
8,46 |
5,99 |
9,24 |
13,53 |
|
Gross
Financial Profitability |
11,49 |
19,09 |
30,60 |
47,04 |
|
BALANCE (IN DAYS OF SALES) |
|
|
|
|
|
Customers’
Credit (In days of sales) |
127,00 |
55,57 |
85,53 |
117,82 |
|
Suppliers’
Credit (In days of sales) |
58,00 |
0,00 |
0,00 |
0,00 |
|
Working
Capital (In days of sales) |
194,00 |
11,30 |
35,54 |
73,21 |
|
Working
Capital Requirement (In days of sales) |
161,00 |
-7,36 |
18,90 |
51,19 |
|
Treasury (In
days of sales) |
33,00 |
3,52 |
12,39 |
32,65 |
|
Operating
Current Assets |
276,00 |
121,38 |
157,57 |
202,35 |
|
BALANCE |
|
|
|
|
|
Working
Capital |
3.609.444,93 |
126.312,60 |
378.173,88 |
789.961,18 |
|
Working
Capital Requirement |
2.986.436,48 |
-74.165,12 |
195.291,60 |
541.398,97 |
|
Treasury |
623.008,45 |
36.733,58 |
132.800,87 |
356.377,23 |
|
Balance
Ratio |
6,35 |
1,23 |
1,89 |
3,68 |
|
SOLVENCY |
|
|
|
|
|
Borrowing
Ratio |
26,35 |
50,35 |
66,84 |
80,32 |
|
Own /
Permanent Funds |
99,81 |
67,97 |
89,88 |
99,66 |
|
Payback
Capacity |
0,23 |
0,24 |
0,34 |
0,49 |
|
Long term
Indebtedness |
0,14 |
0,07 |
3,58 |
12,12 |
|
Gearing |
135,78 |
201,40 |
301,54 |
508,20 |
|
Financing
Basic Ratio |
1,00 |
1,00 |
1,00 |
1,00 |
|
Assets
Guarantee |
3,80 |
1,21 |
1,46 |
1,95 |
|
LIQUIDITY |
|
|
|
|
|
General
Liquidity |
3,37 |
1,09 |
1,30 |
1,77 |
|
Immediate
Liquidity |
0,60 |
0,04 |
0,12 |
0,34 |
RATING EXPLANATIONS
|
RATING |
STATUS |
PROPOSED CREDIT LINE |
|
|
>86 |
Aaa |
Possesses an extremely sound financial
base with the strongest capability for timely payment of interest and
principal sums |
Unlimited |
|
71-85 |
Aa |
Possesses adequate working capital. No
caution needed for credit transaction. It has above average (strong)
capability for payment of interest and principal sums |
Large |
|
56-70 |
A |
Financial & operational base are
regarded healthy. General unfavourable factors will not cause fatal effect.
Satisfactory capability for payment of interest and principal sums |
Fairly Large |
|
41-55 |
Ba |
Overall operation is considered normal.
Capable to meet normal commitments. |
Satisfactory |
|
26-40 |
B |
Unfavourable & favourable factors
carry similar weight in credit consideration. Capability to overcome
financial difficulties seems comparatively below average/normal. |
Small |
|
11-25 |
Ca |
Adverse factors are apparent. Repayment of
interest and principal sums in default or expected to be in default upon
maturity |
Limited with full security |
|
<10 |
C |
Absolute credit risk exists. Caution
needed to be exercised |
Credit not recommended |
|
NR |
In view of the lack of information, we
have no basis upon which to recommend credit dealings |
No Rating |
|