![]()
MIRA
INFORM REPORT
|
Report Date : |
01.11.2007 |
IDENTIFICATION
DETAILS
|
Name : |
JAPAN MEDIAL DYNAMIC MARKETING INC |
|
|
|
|
Registered Office : |
12-2 Ichigaya-Daimachi Shinjukuku Tokyo 162-0066 |
|
|
|
|
Country : |
Japan |
|
|
|
|
Financials (as on) : |
31.05.2007 |
|
|
|
|
Date of Incorporation : |
May 1973 |
|
|
|
|
Legal Form : |
Limited Company (Kabushiki Kaisha) |
|
|
|
|
Line of Business : |
Manufacturing, import, wholesale of
orthopedic devices |
RATING &
COMMENTS
|
MIRA’s Rating : |
B |
|
RATING |
STATUS |
PROPOSED CREDIT LINE |
|
|
26-40 |
B |
Unfavourable & favourable factors carry similar weight in credit
consideration. Capability to overcome financial difficulties seems comparatively
below average. |
Small |
|
Maximum Credit Limit : |
Yen 209.8 millions |
|
|
|
|
Status : |
Moderate |
|
|
|
|
Payment Behaviour : |
Regular |
name
JAPAN MEDIAL DYNAMIC MARKETING INC
REGD NAME
KK Nippon M D M
MAIN OFFICE
12-2 Ichigaya-Daimachi Shinjukuku Tokyo 162-0066 JAPAN
Tel : 03-3341-6545
URL : http://www.jmdm.co.jp/
E-Mail address: info@jmdm.co.jp
ACTIVITIES
Mfg, import, wholesale of orthopedic devices
BRANCH(ES)
Sapporo, Sendai, Nagoya, Osaka, Fukuoka, other (Tot 18)
FACTORY(IES)
Chiba, other (--subsidiary makers)
CHIEF EXEC
ITSURO NUMATA, PRES
Yen Amount: In
million Yen, unless otherwise stated
SUMMARY
FINANCES FAIR A/SALES Yen 11,462 M
PAYMENTS REGULAR CAPITAL Yen 1,826 M
TREND SLOW WORTH Yen 11,883 M
STARTED 1973 EMPLOYES 420
COMMENT
MFR,
IMPORTER AND WHOLESALER OF ORTHOPEDICS DEVICES. FINANCIAL SITUATION COSIDERED FAIR AND GOOD FOR ORDINARY BUSINESS
ENGAGEMENTS.
MAX CREDIT LIMIT: YEN 209.8 MILLION, 30 DAYS NORMAL TERMS.
Forecast
(or estimated) figures for 31/05/2008 fiscal term
HIGHLIGHTS
This is importer and wholesaler of orthopedics medical appliances. Top-ranked in bone joining materials. Emphasizing in artificial joints. Also makes electric scalps in-house. Has a subsidiary maker in US for making medical appliances. Fostering power beds to make it next profit earner after electric scalps.
FINANCIAL INFORMATION
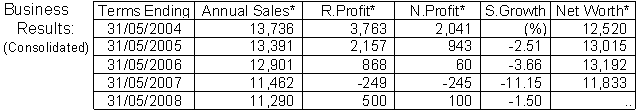
The sales volume for May/2007 fiscal term amounted to Yen
11,462 million, an 11% down from Yen 12,901 million in the previous term. The operations plunged into the red to
register Yen 249 million recurring loss and Yen 245 million net losses, respectively,
for the term, compared with Yen 868 million recurring profit and Yen 50 million
net profit, respectively, a year ago.
Profits deteriorated due to the rising R/D costs.
For the current term ending May 2008 the recurring profit is
projected at Yen 520 million and the net profit at Yen 100 million, on a 1.5%
decline in turnover, to Yen 11,290 million
The financial situation is considered FAIR and good for
ORDINARY business engagements. Max
credit limit is estimated at Yen 209.8 million, on 30 days normal terms.
REGISTRATION
Date Registered: May
1973
Legal Status: Limited
Company (Kabushiki Kaisha)
Authorized: 37,728,000
shares
Issued: 18,533,116
shares
Sum: Yen
1,826 million
Major shareholders (%): Takashi Watanabe (7.7), Yasuo Watanabe (5.4), Master Trust Bank of Japan T (5.2),
Japan
Trustee Services (4.8), Motohiro Shimazaki (4.8), ITT Co (2.1), Hiroshi
Kusakabe
(2.1),
Ranko Watanabe (1.0); foreign owners (3.9)
No. of shareholders: 5,284
Listed on the S/Exchange (s) of: Tokyo
Managements: Itsuro Numata, pres & CEO; Masao Okawa, dir, Katsuhiko Seshita, dir; Koichi Kondo, dir;
Hideki
Kuwabara, dir
Nothing detrimental is known as to the commercial morality of
executives.
Related companies
Ortho Development Corp (USA)
OPERATION
Activities: Import, wholesale and mfg of bone joining materials
(59%), artificial joints (30%), other medical appliances, others (11%)
Clients: [Hospitals, traders] ME System, Mutow, Kawanishi,
other.
No. of accounts: 800
Domestic areas of activities: Nationwide
Suppliers: [Mfrs, wholesalers] Abott Spine Inc, De Puy
Orthopedics, Cincinnati Sub-Zero Products Inc, Ortho Development (--USA),
other.
Payment record: Regular
Location: Business area in Tokyo. Office premises at the caption address are leased and maintained
satisfactorily.
Bank References
Mizuho Bank (Shinjuku-Chuo)
MUFG (Shinjukudori)
Relations: Satisfactory
Financials
|
FINANCES: (Consolidated
in million yen) |
|
|||||
|
|
|
Terms Ending: |
31/05/2007 |
31/05/2006 |
||
|
INCOME STATEMENT |
|
|
||||
|
|
Annual Sales |
|
11,462 |
12,901 |
||
|
|
Cost of Sales |
4,196 |
3,367 |
|||
|
|
GROSS PROFIT |
7,265 |
9,534 |
|||
|
|
Selling & Adm Costs |
8,314 |
8,402 |
|||
|
|
OPERATING PROFIT |
-1,049 |
1,132 |
|||
|
|
Non-Operating P/L |
800 |
-264 |
|||
|
|
RECURRING PROFIT |
-249 |
868 |
|||
|
|
NET PROFIT |
-245 |
60 |
|||
|
BALANCE SHEET |
|
|
|
|||
|
|
Cash |
|
1,185 |
1,057 |
||
|
|
Receivables |
|
1,434 |
1,725 |
||
|
|
Inventory |
|
15,933 |
15,034 |
||
|
|
Securities, Marketable |
|
|
|||
|
|
Other Current Assets |
1,982 |
1,388 |
|||
|
|
TOTAL CURRENT ASSETS |
20,534 |
19,204 |
|||
|
|
Property & Equipment |
8,010 |
8,699 |
|||
|
|
Intangibles |
|
234 |
242 |
||
|
|
Investments, Other Fixed Assets |
940 |
1,160 |
|||
|
|
TOTAL ASSETS |
29,718 |
29,305 |
|||
|
|
Payables |
|
283 |
779 |
||
|
|
Short-Term Bank Loans |
6,173 |
5,562 |
|||
|
|
|
|
|
|
||
|
|
Other Current Liabs |
2,882 |
1,188 |
|||
|
|
TOTAL CURRENT LIABS |
9,338 |
7,529 |
|||
|
|
Debentures |
|
|
|
||
|
|
Long-Term Bank Loans |
4,205 |
7,711 |
|||
|
|
Reserve for Retirement Allw |
550 |
571 |
|||
|
|
Other Debts |
|
3,741 |
301 |
||
|
|
TOTAL LIABILITIES |
17,834 |
16,112 |
|||
|
|
MINORITY INTERESTS |
|
|
|||
|
|
Common
stock |
1,826 |
1,826 |
|||
|
|
Additional
paid-in capital |
1,411 |
1,411 |
|||
|
|
Retained
earnings |
8,519 |
9,228 |
|||
|
|
Evaluation
p/l on investments/securities |
16 |
17 |
|||
|
|
Others |
|
86 |
735 |
||
|
|
Treasury
stock, at cost |
(25) |
(25) |
|||
|
|
TOTAL S/HOLDERS` EQUITY |
11,833 |
13,192 |
|||
|
|
TOTAL EQUITIES |
19,718 |
29,305 |
|||
|
CONSOLIDATED CASH FLOWS |
|
|
||||
|
|
|
Terms ending: |
31/05/2007 |
31/05/2006 |
||
|
|
Cash
Flows from Operating Activities |
|
624 |
1,745 |
||
|
|
Cash
Flows from Investment Activities |
-2,175 |
-3,414 |
|||
|
|
Cash
Flows from Financing Activities |
1,429 |
1,857 |
|||
|
|
Cash,
Bank Deposits at the Term End |
|
970 |
842 |
||
|
ANALYTICAL RATIOS Terms
ending: |
31/05/2007 |
31/05/2006 |
||||
|
|
|
Net
Worth (S/Holders' Equity) |
11,833 |
13,192 |
||
|
|
|
Current
Ratio (%) |
219.90 |
255.07 |
||
|
|
|
Net
Worth Ratio (%) |
60.01 |
45.02 |
||
|
|
|
Recurring
Profit Ratio (%) |
-2.17 |
6.73 |
||
|
|
|
Net
Profit Ratio (%) |
-2.14 |
0.47 |
||
|
|
|
Return
On Equity (%) |
-2.07 |
0.45 |
||
RATING
EXPLANATIONS
|
RATING |
STATUS |
PROPOSED CREDIT LINE |
|
|
>86 |
Aaa |
Possesses an extremely sound financial base with the strongest capability
for timely payment of interest and principal sums |
Unlimited |
|
71-85 |
Aa |
Possesses adequate working capital. No caution needed for credit
transaction. It has above average (strong) capability for payment of interest
and principal sums |
Large |
|
56-70 |
A |
Financial & operational base are regarded healthy. General
unfavourable factors will not cause fatal effect. Satisfactory capability for
payment of interest and principal sums |
Fairly Large |
|
41-55 |
Ba |
Overall operation is considered normal. Capable to meet normal
commitments. |
Satisfactory |
|
26-40 |
B |
Unfavourable & favourable factors carry similar weight in credit
consideration. Capability to overcome financial difficulties seems comparatively
below average. |
Small |
|
11-25 |
Ca |
Adverse factors are apparent. Repayment of interest and principal sums
in default or expected to be in default upon maturity |
Limited with
full security |
|
<10 |
C |
Absolute credit risk exists. Caution needed to be exercised |
Credit not
recommended |
|
NR |
In view of the lack of information, we have no basis upon which to
recommend credit dealings |
No Rating |
|
This score serves as a reference to assess SC’s credit risk
and to set the amount of credit to be extended. It is calculated from a
composite of weighted scores obtained from each of the major sections of this
report. The assessed factors and their relative weights (as indicated through
%) are as follows:
Financial
condition (40%) Ownership
background (20%) Payment
record (10%)
Credit history
(10%) Market trend
(10%) Operational
size (10%)