![]()
MIRA
INFORM REPORT
|
Report Date : |
26.11.2007 |
IDENTIFICATION
DETAILS
|
Name : |
PINYO PHARMACY LIMITED PARTNERSHIP |
|
|
|
|
Registered Office : |
238
Charoenrat Road, Klongtonsai, Klongsarn, Bangkok
10600 |
|
|
|
|
Country : |
Thailand |
|
|
|
|
Financials (as on) : |
31.12.2006 |
|
|
|
|
Date of Incorporation : |
1978 |
|
|
|
|
Com. Reg. No.: |
0103521008575 |
|
|
|
|
Legal Form : |
Limited Partnership |
|
|
|
|
Line of Business : |
Engaged in distributing wide range of
pharmaceutical products. |
RATING &
COMMENTS
|
MIRA’s Rating : |
Ba |
|
RATING |
STATUS |
PROPOSED CREDIT LINE |
|
|
41-55 |
Ba |
Overall operation is considered normal. Capable to meet normal
commitments. |
Satisfactory |
|
Status : |
Satisfactory |
|
|
|
|
Payment Behaviour : |
Regular |
|
|
|
|
Litigation : |
Clear |
name
PINYO PHARMACY LIMITED PARTNERSHIP
SUMMARY
BUSINESS ADDRESS : 238
CHAROENRAT ROAD, KLONGTONSAI,
KLONGSARN, BANGKOK
10600
TELEPHONE : [66] 2438-5379,
2438-2432, 2438-7472
FAX : [66] 2438-7471
REGISTRATION ADDRESS : 1078/175 PRANNOK ROAD, BANCHANGLOR,
BANGKOKNOI, BANGKOK
10700
ESTABLISHED : 1978
REGISTRATION NO.
: 0103521008575
CAPITAL
REGISTERED : BHT. 800,000
CAPITAL
PAID-UP : BHT. 800,000
FISCAL
YEAR CLOSING DATE : DECEMBER 31
LEGAL STATUS : LIMITED PARTNERSHIP
EXECUTIVE : MR. SUJIN KORWANICH, THAI
MANAGING PARTNER
NO. OF
STAFF : 12
LINES OF
BUSINESS : PHARMACEUTICAL PRODUCTS
IMPORTER AND
DISTRIBUTOR
CORPORATE PROFILE
OPERATING TREND : STABLE
PRESENT SITUATION : OPERATING NORMALLY
REPUTATION : GOOD
WITH NORMAL BUSINESS
ENGAGEMENT
MANAGEMENT STANDARD : MANAGEMENT WITH FAIR PERFORMANCE
HISTORY
The
subject was established
on May 1, 1978 as
a limited partnership under the registered name
PINYO PHARMACY LIMITED
PARTNERSHIP, by Thai
partners, in order
to distribute and
supply wide range
of pharmaceutical products
to domestic market.
It currently employs
12 staff.
The
subject’s registered address
is 1078/175 Prannok
Rd., Banchanglor, Bangkoknoi,
Bangkok 10700, while
the current operation
address is at
238 Charoenrat Rd.,
Klongtonsai, Klongsarn, Bangkok
10600.
AUTHORIZED PERSON
Mr. Sujin Korwanich can
sign on behalf
of the subject with seal
affixed. He also
bears full financial
responsibility by law.
MANAGEMENT
Mr. Sujin Korwanich
is the Managing Partner.
He is Thai nationality.
BUSINESS OPERATIONS
The subject is
engaged in distributing wide range of
pharmaceutical products.
PURCHASE
Most of the
products are purchased
from local suppliers,
the remaining is
imported from U.S.A.,
United Kingdom and Germany.
SALES
100% of the
products is sold
locally to wholesalers, retailers and end-users.
SUBSIDIARY AND
AFFILIATED COMPANY
The subject is
not found to
have any subsidiary
nor affiliated company
here in Thailand.
LITIGATION
Bankruptcy and Receivership
There are no
litigation on bankruptcy
and receivership cases
filed against the
subject found at
Legal Execution Department
for the past
five years.
Others
There are no
legal suits filed
against the subject
for the past
two years.
CREDIT
Sales are by
cash or on
the credit term
of 30 days.
Local bills are
paid by cash
or on the credits term
of 30-60 days.
Imports are by
L/C at sight or T/T.
BANKING
Krung Thai
Bank Public Co.,
Ltd.
[Yaowaraj Branch,
Yaowaraj Rd., Samphantawong, Bangkok]
EMPLOYMENT
The
subject employs 12
staff.
LOCATION DETAILS
The
premise is owned
for administrative office
and drug store
at the heading address. Premise
is located in
commercial/residential area.
The
subject has branch
office, which is
located at 647/5
Soi Sarapee 3,
Charoenrat Rd., Klongtonsai, Klongsarn, Bangkok 10600.
COMMENT
The
subject is doing
good business and has
steady growth. Demand
of pharmaceutical products
both prescription and
over counter drug remains
strong.
FINANCIAL INFORMATION
The
capital was registered
at Bht. 700,000 which
was carried by 4 persons
as followed:
Mr. Sujin
Korwanich Bht. 500,000 [unlimited partner]
Mrs. Ratchanee Korwanich Bht. 199,500
Mrs. Sumon
Bualian Bht. 250
Ms. Ratana
Techochawalit Bht. 250
In
2007 the capital
was increased to
Bht. 800,000 which was
carried by 4
persons as followed:
Mr. Sujin
Korwanich Bht. 600,000 [unlimited partner]
Mrs. Ratchanee Korwanich Bht. 199,500
Mrs. Sumon
Bualian Bht. 250
Ms. Ratana
Techochawalit Bht. 250
NAME OF AUDITOR &
CERTIFIED PUBLIC
ACCOUNTANT NO. :
Mrs. Renu Buakerd No.
1034
BALANCE SHEET [BAHT]
The
latest financial figures
published for December
31, 2006 &
2005 were:
ASSETS
|
Current Assets |
2006 |
2005 |
|
|
|
|
|
Cash in hand
& at Bank
|
24,347.92 |
157,298.01 |
|
Trade Accts. & Notes Receivable |
25,921,179.56 |
15,554,963.05 |
|
Inventories |
5,494,303.59 |
7,780,935.00 |
|
Other Current Assets
|
3,373,126.74 |
946,841.95 |
|
Total Current
Assets |
34,812,957.81 |
24,440,038.01 |
|
|
|
|
|
Fixed Assets |
1,523,709.84 |
73,889.15 |
|
Total Assets |
36,336,667.65 |
24,513,927.16 |
LIABILITIES & SHAREHOLDERS'
EQUITY [BAHT]
|
Current Liabilities |
2006 |
2005 |
|
|
|
|
|
Bank Overdraft &
Short Term Loan
from Financial Institute |
54,468.33 |
8,268.34 |
|
Trade Accts. & Notes Payable |
2,727,359.02 |
1,264,391.71 |
|
Short Term Loan from
Partner |
28,162,665.08 |
20,200,000.00 |
|
Other Current Liabilities |
969,532.28 |
188,195.95 |
|
Total Current
Liabilities |
31,914,024.71 |
21,660,856.00 |
|
Total Liabilities |
31,914,024.71 |
21,660,856.00 |
|
|
|
|
|
Shareholders'
Equity |
|
|
|
Capital Paid |
700,000.00 |
700,000.00 |
|
Retained Earning -
Unappropriated |
3,722,642.94 |
2,153,071.16 |
|
Total
Shareholders' Equity |
4,422,642.94 |
2,853,071.16 |
|
Total
Liabilities & Shareholders' Equity |
36,336,667.65 |
24,513,927.16 |
PROFIT & LOSS ACCOUNT
|
Revenue |
2006 |
2005 |
|
|
|
|
|
Sales |
62,990,399.38 |
33,454,548.16 |
|
Other Income |
489,757.35 |
747.80 |
|
Total Revenues
|
63,480,156.73 |
33,455,295.96 |
|
Expenses |
|
|
|
|
|
|
|
Cost of Goods
Sold |
49,526,259.78 |
26,852,849.46 |
|
Selling & Administrative Expenses |
11,718,307.78 |
4,924,779.52 |
|
Total Expenses |
61,244,567.56 |
31,777,628.98 |
|
Profit / [Loss] Before Interest
Expenses & Income Tax |
2,235,589.17 |
1,677,666.98 |
|
Interest Expenses |
[6,212.69] |
[5,454.23] |
|
Income Tax |
[659,804.70] |
[341,948.84] |
|
Net Profit / [Loss] |
1,569,571.78 |
1,330,263.91 |
|
Retained Earning,
Beginning of Year |
2,153,071.16 |
822,807.25 |
|
Retained Earning,
End of Year |
3,722,642.94 |
2,153,071.16 |
FINANCIAL ANALYSIS
Annual Growth
& Profitability
|
Annual Growth |
2006 |
2005 |
|
Net Sales |
88.29 |
|
|
Operating Profit |
[29.23] |
|
|
Net Profit |
17.99 |
|
|
Fixed Assets |
1,962.16 |
|
|
Total Assets |
48.23 |
|
|
Profitability |
|
|
|
Cost of Good
Sold |
78.63 |
80.27 |
|
Operating Profit Margin |
3.55 |
5.01 |
|
S & A
Expenses |
18.60 |
14.72 |
|
Interest Paid |
0.01 |
0.02 |
|
Other Revenues |
0.78 |
0.00 |
|
Net Profit Margin |
2.49 |
3.98 |
Net Sales was
increased by 88.29%,
Operating Profit was
decreased by 29.23%,
Net Profit was
increased by 17.99%,
Fixed Assets was
increased by 1,962.16%,
Total Assets was
increased by 48.23%.
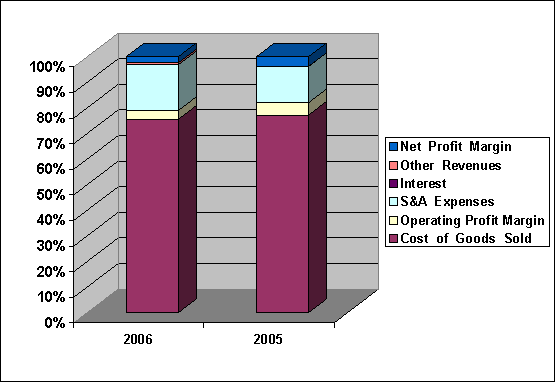
Compare each cost
with sales, Cost of
Good Sold was
decreased from 80.27%
to 78.63%, Operating
Profit Margin was
decreased from 5.01%
to 3.55%, S
& A Expenses
was increased from
14.72% to 18.60%,
Interest Paid was decreased
from 0.02% to
0.01%, Other Revenues
was increased from
0.00% to 0.78%,
Net Profit Margin
was decreased from
3.98% to 2.49%.
Liquidity
|
Liquidity |
2006 |
2005 |
|
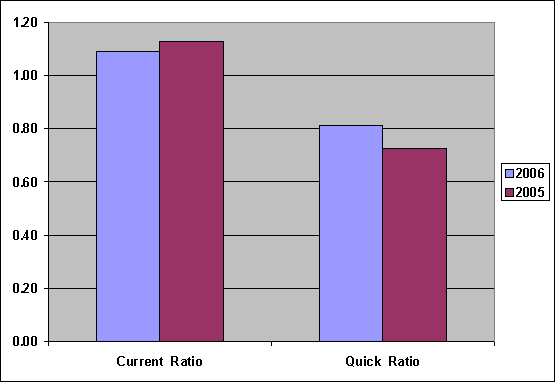
Current Ratio |
1.09 |
1.13 |
|
Quick-Assets Ratio |
0.81 |
0.73 |
Current Ratio was
decreased from 1.13
to 1.09, show
Current Assets can
cover Current Liabilities, Liquidity Ratio of
the company was
good, Quick-Assets Ratio
was increased from
0.73 to 0.81,
capacity to pay
Short Term Loan
was not good,
because Current Assets
without Inventory can
not cover Current
Liabilities.
Leverage
|
Leverage |
2006 |
2005 |
|
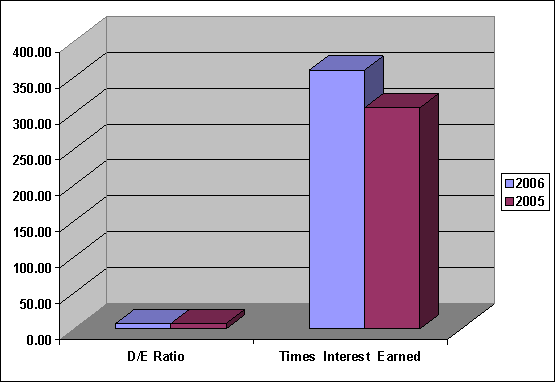
D/E Ratio |
7.22 |
7.59 |
|
Times Interest Earned |
359.84 |
307.59 |
D/E Ratio was
decreased from 7.59
to 7.22, show
the company had
fund from Loan
more than fund
from Equity, investment
risked of the
company is high,
Times Interest Earned
was increased from
307.59 to 359.84,
capacity to pay
interest paid was
good.
Efficiency
|
Efficiency |
2006 |
2005 |
|
Fixed Assets Turnover |
41.34 |
452.77 |
|
Total Assets Turnover |
1.73 |
1.36 |
|
Return on Assets |
4.32 |
5.43 |
|
Return on Equity |
35.49 |
46.63 |
|
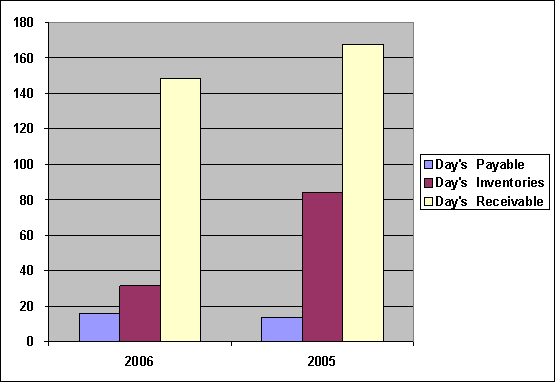
Day's Payable |
15.59 |
13.61 |
|
Day’s Inventories |
31.40 |
83.73 |
|
Day’s Receivables |
148.14 |
167.38 |
Fixed Assets Turnover
was decreased from
452.77 times to
41.34 times, Total
Assets Turnover was
increased from 1.36
times to 1.73
times, show the
company could use
Assets so efficiently, Return on Assets
was decreased from
5.43 to 4.32,
Return on Equity
was decreased from
46.63 to 35.49,
capacity to use
Assets to make
profit was good.
Day's Payable was
increased from 14
days to 16
days, while Day’s
Inventories was decreased
from 84 days
to 32 days, and Day’s
Receivables was decreased
from 168 days
to 149 days.
RATING
EXPLANATIONS
|
RATING |
STATUS |
PROPOSED CREDIT LINE |
|
|
>86 |
Aaa |
Possesses an extremely sound financial base with the strongest
capability for timely payment of interest and principal sums |
Unlimited |
|
71-85 |
Aa |
Possesses adequate working capital. No caution needed for credit
transaction. It has above average (strong) capability for payment of interest
and principal sums |
Large |
|
56-70 |
A |
Financial & operational base are regarded healthy. General
unfavourable factors will not cause fatal effect. Satisfactory capability for
payment of interest and principal sums |
Fairly Large |
|
41-55 |
Ba |
Overall operation is considered normal. Capable to meet normal
commitments. |
Satisfactory |
|
26-40 |
B |
Unfavourable & favourable factors carry similar weight in credit
consideration. Capability to overcome financial difficulties seems
comparatively below average. |
Small |
|
11-25 |
Ca |
Adverse factors are apparent. Repayment of interest and principal sums
in default or expected to be in default upon maturity |
Limited with
full security |
|
<10 |
C |
Absolute credit risk exists. Caution needed to be exercised |
Credit not
recommended |
|
NR |
In view of the lack of information, we have no basis upon which to
recommend credit dealings |
No Rating |
|
This score serves as a reference to assess SC’s credit risk
and to set the amount of credit to be extended. It is calculated from a
composite of weighted scores obtained from each of the major sections of this
report. The assessed factors and their relative weights (as indicated through
%) are as follows:
Financial
condition (40%) Ownership
background (20%) Payment
record (10%)
Credit history
(10%) Market trend
(10%) Operational
size (10%)