![]()
MIRA
INFORM REPORT
|
Report Date : |
22.04.2008 |
IDENTIFICATION
DETAILS
|
Name : |
MARMOL COMPAC SA |
|
|
|
|
Registered Office : |
Carretera Almansa
Km 96.300, Cp 46727, Real De Gandia Valencia |
|
|
|
|
Country : |
Spain |
|
|
|
|
Financials (as on) : |
31.12.2006 |
|
|
|
|
Date of Incorporation : |
02.07.1975 |
|
|
|
|
Legal Form : |
Joint Stock Company |
|
|
|
|
Line of Business : |
RATING &
COMMENTS
|
MIRA’s Rating : |
A |
|
RATING |
STATUS |
PROPOSED CREDIT LINE |
|
|
56-70 |
A |
Financial & operational base are regarded healthy. General
unfavourable factors will not cause fatal effect. Satisfactory capability for
payment of interest and principal sums |
Fairly Large |
|
Maximum Credit Limit : |
898.002,24 € |
|
|
|
|
Status : |
Good |
|
|
|
|
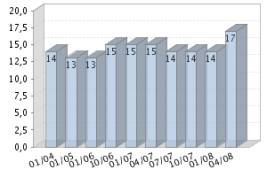
Payment Behaviour : |
Slow by 14 days |
|
|
|
|
Litigation : |
Clear |
name of the company
TAX NUMBER: A46079869
Identification
Current Business Name: MARMOL COMPAC SA
Commercial Name: MARMOL COMPAC,
S.A.
Other names: YES
Current Address: CARRETERA ALMANSA
KM 96.300, CP 46727, REAL DE GANDIA VALENCIA
Telephone number: 962954053 Fax: 962954151
URL: www.compacmq.com
Corporate e-mail: info@compacmq.com
Commercial Risk
Credit Appraisal: 898.002,24 €
Payment Delay Days: 14
Legal Actions: NO
Financial Information
Latest Balance sheet sales (2006): 59.408.000,00 €
(MERCANTILE REGISTER)
Result: 2.249.000 €
Total Assets: 44.506.000 €
Social Capital: 4.768.000,00 €
Employees: 191
Commercial Information
Constitution Date: 02/07/1975
Business activity: Cutting,
shaping & finishing of natural stone industry
NACE Code: 2670
International Operations: Imports and
Exports
Corporate Structure
President:
Parent Company:
Other Complementary Information
Latest proceeding published in BORME: 28/02/2008 Registration
of accounts
Latest press article: 28/12/2006 LAS
PROVINCIAS (BRANCHES INFORMATION)
Bank Entities: Yes
Credit Appraisal
Maximum Credit (from 0 a 6,000,000 €):
898.002,24 €
Rating Evolution
Financial Situation
Fiscal year2006
|
Treasury |
Very good |
|
Indebtedness |
Average |
|
Profitability |
Average |
|
Balance |
Excellent |
Performance
|
Legal Actions |
None or Negligible |
|
Business
Trajectory |
Excellent |
PAYMENT BEHAVIOUR
Summary 
Network collects more than 100 payment experiences per year, clients are
the only ones who could consult this exclusive information in Spain.
Average Delay Days: 14
Payment experiences (last 12 months): 12
Total experiences amount: 45.316 €
Average experiences amount: 3.776 €
Payment Experiences Analysis
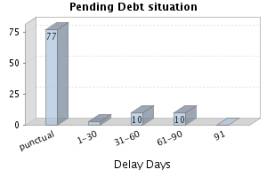
Total payment experiences amount:45.316€
23% of the delayed total amount
Payment Experiences
|
VALUE RANGES |
EXP. |
TOTAL |
PUCNT. |
1-30 |
31-60 |
61-90 |
+91 DAYS |
|
> 100.000 |
|
|
|
|
|
|
|
|
75.000 - 99.999 |
|
|
|
|
|
|
|
|
50.000 - 74.999 |
|
|
|
|
|
|
|
|
25.000 - 49.999 |
|
|
|
|
|
|
|
|
10.000 - 24.999 |
1 |
24.040 |
100 % |
|
|
|
|
|
<10.000 |
11 |
21.276 |
51 % |
7 % |
21 % |
21 % |
- |
|
Total |
12 |
45.316 |
|
|
|
|
|
In some cases the delay days could be due to oversight or delayed
invoices.
INCIDENTS

Summary
LEGAL ACTIONS: No legal
incidences registered
CLAIM FILED AGAINST THE ADMINISTRATION: No administrative
claims registered
AFFECTED BY:
2 Company / Companies in Insolvency Proceedings.
FINANCIAL ELEMENTS AND SECTORIAL
COMPARATIVE
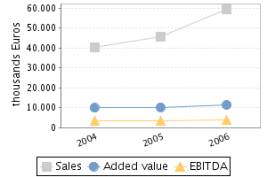
FINANCIAL ELEMENTS
Figures given in thousands €
|
|
2004 (12) |
2005 (12) |
2006 (12) |
% ASSETS |
|
|
|
|
|
|
BALANCE SHEET ANALYSIS |
|
|
|
|
|
|
|
|
|
|
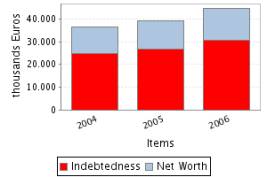
OWN FUNDS |
11.546,00 |
12.350,00 |
13.931,00 |
31,30 |
|
|
|
|
|
|
DEBT |
24.734,00 |
26.866,00 |
30.575,00 |
68,70 |
|
|
|
|
|
|
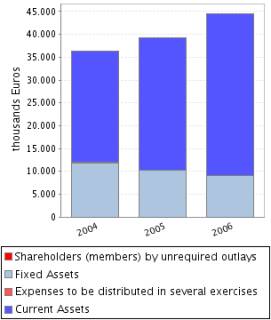
FIXED ASSETS |
11.902,00 |
10.159,00 |
9.134,00 |
20,52 |
|
|
|
|
|
|
TOTAL ASSETS |
36.280,00 |
39.216,00 |
44.506,00 |
|
|
|
|
|
|
|
|
|
|
|
|
|
|
|
|
|
|
|
2004 (12) |
2005 (12) |
2006 (12) |
% SALES |
|
|
|
|
|
|
PROFIT AND LOSS ACCOUNT ANALYSIS |
|
|
|
|
|
|
|
|
|
|
SALES |
40.186,00 |
45.794,00 |
59.408,00 |
|
|
|
|
|
|
|
ADDED VALUE |
9.891,00 |
10.188,00 |
11.365,00 |
19,13 |
|
|
|
|
|
|
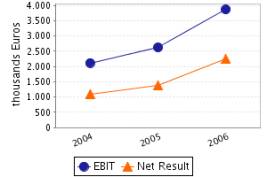
EBITDA |
3.308,00 |
3.301,00 |
3.672,00 |
6,18 |
|
|
|
|
|
|
EBIT |
2.119,00 |
2.624,00 |
3.868,00 |
6,51 |
|
|
|
|
|
|
NET RESULT |
1.104,00 |
1.374,00 |
2.249,00 |
3,79 |
|
|
|
|
|
Balance Sheets Items Analysis
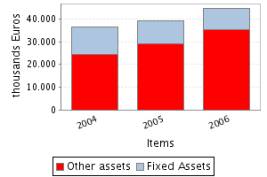
Balance Sheet Comments
Total assets of the company grew 8,09% between 2004 and 2005.
In spite of the assets’ growth, the fixed assets decreased 14,64%.
This growth has been mainly financed with a debt increase of 8,62%.
Nevertheless the net worth increased 6,96%.
Total assets of the company grew 13,49% between 2005 and 2006.
In spite of the assets’ growth, the fixed assets decreased 10,09%.
This growth has been mainly financed with a debt increase of 13,81%.
Nevertheless the net worth increased 12,80%.
Profit and Loss Account Analysis
Profit and Loss Account Comments
The company’s sales figure grew 13,96% between 2004 and 2005.
The company’s EBIT grew 23,83% between 2004 and 2005.
This evolution implies an increase in the company’s operating
profitability.
The result of these variations is an increase of the company’s Economic
Profitability of 14,56% in the analysed period, being this profitability of
6,69% in the year 2005.
The company’s Net Result grew 24,46% between 2004 and 2005.
This evolution, compared to the EBIT’s performance, implies that the
financial and extraordinary activities have had a positive effect in the
company’s Financial Profitability.
The result of these variations is an increase of the company’s Economic
Profitability of 16,35% in the analysed period, being equal to % in the year
2005.
The company’s sales figure grew 29,73% between 2005 and 2006.
The company’s EBIT grew 47,41% between 2005 and 2006.
This evolution implies an increase in the company’s operating
profitability.
The result of these variations is an increase of the company’s Economic
Profitability of 29,89% in the analysed period, being this profitability of
8,69% in the year 2006.
The company’s Net Result grew 63,68% between 2005 and 2006.
This evolution, compared to the EBIT’s performance, implies that the
financial and extraordinary activities have had a positive effect in the
company’s Financial Profitability.
The result of these variations is an increase of the company’s Economic
Profitability of 45,11% in the analysed period, being equal to 16,14% in the
year 2006.
ANNUAL FINANCIAL REPORT
ADDITIONAL DATA
Source: annual financial report 2006
Results Distribution
Figures given in €
|
DISTRIBUTION
BASE |
DISTRIBUTION TO |
||
|
Profit and Loss |
2.249.000,00 |
Retained earnings |
0,00 |
|
Carry Over |
0,00 |
Voluntary Reserve |
504.000,00 |
|
Voluntary reserves |
0,00 |
Prior years losses |
0,00 |
|
Reserves |
0,00 |
Carry Over |
0,00 |
|
Other concepts |
0,00 |
Other funds |
0,00 |
|
Total of Amounts to be distributed |
2.249.000,00 |
Dividends |
1.745.000,00 |
|
|
|
Other Applications |
0,00 |
Auditing
Auditors’ opinion: FAVOURABLE WITH
RESERVATIONS
Auditor: BDO-AUDIBERIA AUDITORES S.L.
COMPARATIVE SECTOR ANALYSIS
Values table
Figures expressed in %
|
|
COMPANY (2006) |
SECTOR |
DIFFERENCE |
DIFFERENCE RELATIVE |
|
|
|
|
|
|
BALANCE SHEET
ANALYSIS: % on the total assets |
|
|
|
|
|
|
|
|
|
|
OWN FUNDS |
31,30 |
39,36 |
-8,06 |
-0,20 |
|
|
|
|
|
|
DEBT |
68,70 |
60,64 |
8,06 |
0,13 |
|
|
|
|
|
|
FIXED ASSETS |
20,52 |
41,06 |
-20,53 |
-0,50 |
|
|
|
|
|
|
|
|
|
|
|
|
|
|
|
|
|
|
COMPANY (2006) |
SECTOR |
DIFFERENCE |
DIFFERENCE RELATIVE |
|
|
|
|
|
|
PROFIT AND LOSS
ACCOUNT ANALYSIS: % on the total operating income |
|
|
|
|
|
|
|
|
|
|
SALES |
99,42 |
98,99 |
0,43 |
0,00 |
|
|
|
|
|
|
ADDED VALUE |
19,02 |
30,02 |
-11,00 |
-0,37 |
|
|
|
|
|
|
EBIT |
6,47 |
11,77 |
-5,30 |
-0,45 |
|
|
|
|
|
|
NET RESULT |
3,76 |
7,56 |
-3,79 |
-0,50 |
|
|
|
|
|
Sector Composition
Compared sector (NACE): 267
Number of companies: 39
Size (Sales Figure) : > 7.000.000,00
Euros
Comments on the
sectorial comparative
Compared to its sector the assets of the companies show an inferior
proportion of fixed assets. Specifically the difference with the sector average
is -20,53% , which means a relative difference of -0,50% .
In liabilities composition the company appeals on a wider scale to self
financing, being the proportion of net worth of 8,06% inferior, which means a
relative difference of 0,20% 8,06% more than the sector, which means a
difference of 0,13% .
The proportion that the sales mean to the company’s total ordinary
income is 99,42%, 0,43% higher than in the sector, which means a relative
difference of 0,00% .
The company’s EBIT was positive and was 6,47% with regard to the total
ordinary income, 5,30% less than the sector, which means a relative difference
of 0,45% .
The company’s capacity to generate operating income is equal to that of
the sector as its ratio EBIT/Sales is also equal.
The company’s net result was positive and equal to 3,76% with regard to
the total ordinary income, 3,79% less than the sector, which means a relative
difference of 0,50% .
The financial and extraordinary results and the tax impact have had a
negative impact on the Net result in the company with a worse behaviour than in
the sector; as a consequence, the company shows a worse Net Result/EBIT ratio
(REBEmpresa vs. REBSector).
ADDRESSES
Current Legal Seat Address:
CARRETERA ALMANSA KM 96.300
46727
REAL DE GANDIA VALENCIA
Characteristics of
the current address
Type of premises: office, factory,
warehouse
Property: owned; with no official confirmation
Local Situation: secondary
CORPORATE STRUCTURE
ADMINISTRATIVE LINKS
Main Board members,
Directors and Auditor ![]() :
:
|
POSITION |
SURNAMES AND
NAME |
APPOINTMENT DATE |
|
|
PRESIDENT |
BRINES GRAU CARMEN |
03/01/2008 |
|
|
MANAGING DIRECTOR |
SANCHIS BRINES CARMEN |
03/01/2008 |
|
|
MANAGING DIRECTOR |
SANCHIS BRINES FRANCISCO |
03/01/2008 |
|
|
AUDITOR |
APPOINTMENT DATE |
||
|
SANJUAN PEDRAZA MANUEL |
08/01/2008 |
||
Functional Managers
|
POSITION |
SURNAMES AND
NAME |
|
Financial Manager |
PICOT CALATAYUD VICENTE |
|
Commercial Manager |
ZAPATERO RINCON JOSE LUIS |
|
Exports Manager |
ZAPATERO RINCON JOSE LUIS |
FINANCIAL LINKS
Shareholders

|
|
BUSINESS NAME |
CIF / COUNTRY |
% |
SOURCE |
DATA INF. |
|
|
SILICALIA SOCIEDAD LIMITADA. |
B96925342 |
94,95 |
TRADE REG. |
31/12/2006 |
|
|
SANCHIS BEL LAN FRANCISCO |
|
5,05 |
TRADE REG. |
31/12/2006 |
CREDIT INFORMATION
Constitution Date: 02/07/1975
Business activity 
Code: 1244200Activity: Cutting, shaping & finishing of natural stone
industry
NACE Code: 2670
NACE Activity: Cutting, shaping
and finishing of stone
Business: FABRICACION Y
VENTA DE TODA CLASE DE PIEZAS DE AGLOMERADO DE MARMOL Y SIMILARES
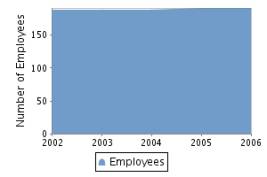
Employees 
Number of total employees: 191 (2006)
Number of fixed employees: 100,00%
Number of temporary employees: 0,00%
Employees evolution
COMMERCIAL OPERATIONS 
SUPPLIERS
|
BUSINESS NAME |
INTERNATIONAL |
|
TECNOSTONE
CASTILLA SL |
NO |
|
SILICALIA
PORTUGAL ICAP SA |
YES |
2 proveedores
SALES
Collection (estimated):
Cash sales percentage: 40%
On a credit basis: 60%
Export Percentage: 60%
Exports to: U.E, JAPON, EXTREMO ORIENTE, USA, CHINA, EMIRATOS
ARABES, AUSTRALIA, FRANCIA Y FILIPINAS
National Distribution: 40%
CLIENTS
|
BUSINESS NAME |
INTERNATIONAL |
|
COMPAC USA INC |
YES |
|
COMPACSTONE USA
INC |
YES |
|
SICALIA PORTUGAL
ICAP SA |
YES |
3 clientes
Banks 
|
ENTITY |
BRANCH |
ADDRESS |
TOWN OR CITY |
PROVINCE |
|
BANCO DE SABADELL, S.A. |
7340 |
PASSEIG DE LES GERMANIES 000046 |
GANDIA |
Valencia |
|
BANCO DE VALENCIA, S.A. |
0332 |
PASEO DE GERMANIAS, 9 |
GANDIA |
Valencia |
|
BANCO GUIPUZCOANO, S.A. |
0154 |
PASSEIG GERMANIES, 35 |
GANDIA |
Valencia |
|
BANKINTER, S.A. |
9469 |
PLAZA DE CRISTO REY S/N |
GANDIA |
Valencia |
|
BANCO SANTANDER, S.A. |
0061 |
PS DE GERMANIAS 11 APDO. 00002 |
GANDIA |
Valencia |
8 bank entities registered
Brands, Signs and Commercial
Names 
Brand name: MCC COMPAC STONE (Valid)
Type: JOINT Date: 04/05/2001
Brand name: MARFIL STONE DE MCC MARMOL COMPAC (Valid)
Type: JOINT Date: 01/02/2001
Brand name: MARFIL STONE DE MCC MARMOL COMPACT (Valid)
Type: JOINT Date: 01/02/2001
Brand name: M CC MARMOL COMPAC (Valid)
Type: JOINT Date: 27/07/2000
Brand name: PERLATO (Valid)
Type: DENOMINATIVE Date: 26/07/2000
LEGAL STRUCTURE
Constitution Data
Register Date: 02/07/1975
Current Legal Form: JOINT STOCK
COMPANY
Current Capital:
4.768.000,00 €
Legal Aspects
Obligation to fill in Financial
Statements: YES
Chamber census: YES (2006)
Listed on a Stock Exchange: NO
B.O.R.M.E.(Official Companies
Registry Gazette) 
Registered Proceedings
|
PROCEEDINGS |
DATE |
NOTICE NUM. |
TRADE REG. |
|
Appointments |
08/01/2008 |
8722 |
Valencia |
|
Resignations |
03/01/2008 |
3673 |
Valencia |
|
Appointments |
03/01/2008 |
3673 |
Valencia |
Other Proceedings published
|
PROCEEDINGS |
DATE |
NOTICE NUM. |
TRADE REG. |
|
Registration of accounts (2006) Individual |
28/02/2008 |
87683 |
Valencia |
|
Registration of accounts (2005) Individual |
28/12/2007 |
1213360 |
Valencia |
Press articles

28/12/2006 LAS PROVINCIAS (BRANCHES INFORMATION)
LA EMPRESA VALENCIANA DE MARMOL COMPAC, QUE PERTENECE A SILICALIA,
INSTALARA EN BAZA UNA INDUSTRIA DE RECUBRIMIENTOS DECORATIVOS QUE CREARA 40
PUESTOS DE TRABAJO EN EL PRIMER AÑO DE FUNCIONAMIENTO Y HASTA 200 UNA VEZ
CULMINADA LA SEGUNDA FASE DE SU INSTALACION. LA CIA. INVERTIRA 23 MM. DE EUROS
EN 2 AÑOS.
08/11/2006 LEVANTE (PRODUCTION DATA INFORMATION)
LA EMPRESA VALENCIANA COMPAC MARMOL & QUARTZ PRODUCE AL AÑO MAS DE
2,5 MM DE MTS. CUADRADOS DE SUPERFICIES DE MARMOL Y CUARZO. CON CENTROS DE
PRODUCCION EN GANDIA (VALENCIA) Y PORTUGAL, LA CIA. ES UN REFERENTE MUNDIAL EN
ESTAS SUPERFICIES, EXPORTANDO SUS PRODUCTOS A PAISES COMO U.S.A., CHINA, JAPON,
EMIRATOS ARABES, AUSTRALIA, FRANCIA O FILIPINAS.
FINANCIAL INFORMATION
The information on the last account contained in this report is
extracted from the Mercantile Register file of the legal address of the Company
and dated 17/03/2008.
BALANCE SHEET
Assets
Figures given in thousands €
|
|
31/12/2004 (12) |
31/12/2005 (12) |
31/12/2006 (12) |
|
A) DUE FROM SHAREHOLDERS FOR UNCALLED CAPITAL |
|
|
|
|
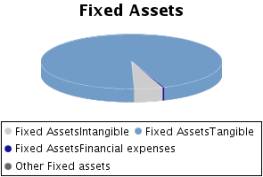
B) FIXED ASSETS |
11.902,00 |
10.159,00 |
9.134,00 |
|
I. Incorporation costs |
|
|
|
|
II. Intangible fixed assets |
1.268,00 |
853,00 |
462,00 |
|
R & D expenses |
504,00 |
504,00 |
504,00 |
|
Concessions, patents, licences , trademarks |
2,00 |
2,00 |
2,00 |
|
Goodwill |
|
|
|
|
Acquired rights from finance leases |
|
|
|
|
Software |
139,00 |
143,00 |
143,00 |
|
Leasing |
2.033,00 |
2.033,00 |
2.007,00 |
|
Cash advance |
|
|
|
|
Provisions |
|
|
|
|
Depreciation |
-1.410,00 |
-1.829,00 |
-2.194,00 |
|
III. Tangible fixed assets |
8.832,00 |
8.391,00 |
8.637,00 |
|
Property, plant and equipment |
5.053,00 |
5.157,00 |
5.340,00 |
|
Machinery, equipment and other |
16.536,00 |
16.392,00 |
17.469,00 |
|
Other property plant and equipment |
435,00 |
490,00 |
567,00 |
|
Prepaid expenses on fixed assets |
|
|
|
|
Other assets |
680,00 |
756,00 |
694,00 |
|
Provisions |
|
|
|
|
Depreciation |
-13.872,00 |
-14.404,00 |
-15.433,00 |
|
IV. Financial fixed assets |
1.802,00 |
915,00 |
35,00 |
|
Shares in affiliated companies |
|
|
|
|
Receivables in affiliated companies |
1.782,00 |
891,00 |
|
|
Shares in associated companies |
|
|
|
|
Loans to associated companies |
|
|
|
|
Securities |
|
|
|
|
Other loans |
|
|
|
|
Long term deposits and guarantees |
20,00 |
24,00 |
35,00 |
|
Provisions |
|
|
|
|
Taxes receivable |
|
|
|
|
V.Owners equity |
|
|
|
|
VI.Long term trade liabilities |
|
|
|
|
C) DEFERRED EXPENSES |
40,00 |
10,00 |
8,00 |
|
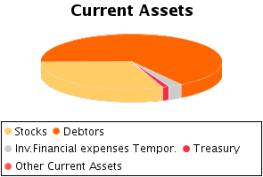
D) CURRENT ASSETS |
24.338,00 |
29.047,00 |
35.364,00 |
|
I. Shareholders by required outlays |
|
|
|
|
II. Stocks |
7.249,00 |
10.024,00 |
10.753,00 |
|
Goods available for sale |
3.498,00 |
5.439,00 |
6.338,00 |
|
Raw material inventory |
1.099,00 |
1.422,00 |
1.587,00 |
|
Work in Progress |
993,00 |
1.334,00 |
1.001,00 |
|
Finished goods |
1.659,00 |
1.829,00 |
1.827,00 |
|
Subproducts and recycled materials |
|
|
|
|
Cash advance |
|
|
|
|
Provisions |
|
|
|
|
III. Debtors |
16.121,00 |
17.847,00 |
23.312,00 |
|
Clients |
14.435,00 |
16.719,00 |
22.286,00 |
|
Amounts owned by affiliated companies |
1.716,00 |
1.800,00 |
1.578,00 |
|
Amounts owned by associated companies |
|
|
|
|
Other debts |
240,00 |
68,00 |
129,00 |
|
Staff Expenses |
|
|
23,00 |
|
Government |
278,00 |
138,00 |
139,00 |
|
Provisions |
-548,00 |
-878,00 |
-843,00 |
|
IV. Temporary financial investment |
906,00 |
894,00 |
891,00 |
|
Shares in affiliated companies |
|
|
|
|
Receivables in affiliated companies |
891,00 |
891,00 |
888,00 |
|
Shares in associated companies |
|
|
|
|
Loans to associated companies |
|
|
|
|
Short term investment |
6,00 |
3,00 |
3,00 |
|
Other loans |
|
|
|
|
Short Term Deposit and guarantees |
9,00 |
|
|
|
Provisions |
|
|
|
|
V. Short-term own shares |
|
|
|
|
VI. Treasury |
18,00 |
194,00 |
371,00 |
|
VII. Periodification adjustments |
44,00 |
88,00 |
37,00 |
|
ASSETS (A + B + C + D) |
36.280,00 |
39.216,00 |
44.506,00 |
Assets composition
Liabilities
Figures given in thousands €
|
|
31/12/2004 (12) |
31/12/2005 (12) |
31/12/2006 (12) |
|
A) SHAREHOLDERS EQUITY |
11.497,00 |
12.268,00 |
13.914,00 |
|
I. Share capital |
4.768,00 |
4.768,00 |
4.768,00 |
|
II. Issue bonus |
|
|
|
|
III.Revaluation reserve |
|
|
|
|
IV.Reserves |
5.625,00 |
6.126,00 |
6.897,00 |
|
Retained earnings |
739,00 |
849,00 |
953,00 |
|
Sinking fund from owner equity |
|
|
|
|
Reserve for the parent company capital |
|
|
|
|
Statutory reserve |
|
|
|
|
Other funds |
4.885,00 |
5.276,00 |
5.943,00 |
|
Capital adjustments in Euros |
1,00 |
1,00 |
1,00 |
|
V.Results from previous years |
|
|
|
|
Carry Over |
|
|
|
|
Prior years losses |
|
|
|
|
Loans from partners for losses compensation |
|
|
|
|
VI.Profit and Losses |
1.104,00 |
1.374,00 |
2.249,00 |
|
VII.Dividend paid during the year |
|
|
|
|
VIII.Own shares for capital reduction |
|
|
|
|
B) DEFERRED INCOME |
49,00 |
82,00 |
17,00 |
|
Capital grants |
49,00 |
19,00 |
17,00 |
|
Positive change difference |
|
63,00 |
|
|
Other deferred income |
|
|
|
|
Fiscal deferred income |
|
|
|
|
C) PROVISIONS FOR LIABILITIES AND EXPENSES |
356,00 |
356,00 |
356,00 |
|
Provision for pensions plans |
|
|
|
|
Provision for taxes |
|
|
|
|
Other provisions |
356,00 |
356,00 |
356,00 |
|
Reversion fund |
|
|
|
|
D) LONG TERM LIABILITIES |
2.139,00 |
1.611,00 |
2.189,00 |
|
I.Negotiable bonds and other negotiable values |
|
|
|
|
Non convertible securities |
|
|
|
|
Convertible securities |
|
|
|
|
Other convertible debentures |
|
|
|
|
II.Debt with bank entities |
1.742,00 |
1.611,00 |
2.189,00 |
|
Long term bank loans |
1.077,00 |
1.391,00 |
2.114,00 |
|
Leasing |
665,00 |
220,00 |
75,00 |
|
III.Debts with associated and affiliated
companies |
|
|
|
|
With affiliated companies |
|
|
|
|
Associated companies |
|
|
|
|
IV. Other creditors |
397,00 |
|
|
|
Bills payable |
|
|
|
|
Other debts |
397,00 |
|
|
|
Long term deposit and guaranties |
|
|
|
|
Taxes receivable |
|
|
|
|
V. Deferred debts on shares |
|
|
|
|
From affiliated companies |
|
|
|
|
From associated companies |
|
|
|
|
Other companies |
|
|
|
|
VI. Long term debt with creditor |
|
|
|
|
E) SHORT TERM LIABILITIES |
22.239,00 |
24.899,00 |
28.030,00 |
|
I.Negotiable bonds and other negotiable values |
|
|
|
|
Non convertible securities |
|
|
|
|
Convertible securities |
|
|
|
|
Other convertible debentures |
|
|
|
|
Interests from bonds |
|
|
|
|
II.Debt with bank entities |
10.194,00 |
7.951,00 |
8.443,00 |
|
Loans and other debts |
9.744,00 |
7.513,00 |
8.261,00 |
|
Debt interest |
|
|
|
|
Leasing |
450,00 |
438,00 |
182,00 |
|
III. Short term debts with associated and
affiliated companies |
2.363,00 |
5.836,00 |
7.854,00 |
|
With affiliated companies |
2.363,00 |
5.836,00 |
7.854,00 |
|
Associated companies |
|
|
|
|
IV. Commercial creditors |
8.392,00 |
9.936,00 |
10.476,00 |
|
Accounts payable |
|
|
|
|
Expenses |
6.722,00 |
7.814,00 |
7.664,00 |
|
Bills payable |
1.670,00 |
2.122,00 |
2.812,00 |
|
V. Other non-commercial debt |
1.290,00 |
1.176,00 |
1.257,00 |
|
Government |
428,00 |
334,00 |
853,00 |
|
Bills payable |
|
|
|
|
Other debts |
508,00 |
466,00 |
5,00 |
|
Accounts receivable |
354,00 |
376,00 |
399,00 |
|
Short term deposits and guarantees |
|
|
|
|
VI. Provisions for current assets |
|
|
|
|
VII. Periodification adjustments |
|
|
|
|
F) SHORT TERM PROVISIONS FOR LIABILITIES AND
EXPENSES |
|
|
|
|
LIABILITIES (A + B + C + D + E + F) |
36.280,00 |
39.216,00 |
44.506,00 |
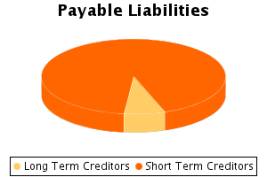
Liabilities
Composition
PROFIT AND LOSS ACCOUNT
Itams of the Profit
and Loss Account
Figures given in thousands €
|
|
31/12/2004 (12) |
31/12/2005 (12) |
31/12/2006 (12) |
|
A) EXPENSES (A.1 a A.16) |
40.572,00 |
45.850,00 |
57.687,00 |
|
A.1.Reduction in stocks of finished goods and
work in progress |
1.592,00 |
|
335,00 |
|
A.2.Supplies |
22.651,00 |
28.637,00 |
37.966,00 |
|
Material consumed |
10.070,00 |
15.336,00 |
23.036,00 |
|
Raw materials consumed |
11.137,00 |
12.056,00 |
13.605,00 |
|
Other expenses |
1.444,00 |
1.245,00 |
1.325,00 |
|
A.3. Labour cost |
5.204,00 |
5.341,00 |
5.891,00 |
|
Wages |
3.935,00 |
4.036,00 |
4.422,00 |
|
Social security expenses |
1.269,00 |
1.305,00 |
1.469,00 |
|
A.4. Assets depreciation |
2.038,00 |
1.647,00 |
1.504,00 |
|
A.5.Variance in the traffic provisions |
530,00 |
576,00 |
102,00 |
|
Variance in provision for inventory |
|
|
|
|
Variance in provision for bad debts |
324,00 |
576,00 |
102,00 |
|
Variance in provision for other current assets |
206,00 |
|
|
|
A.6. Other operating costs |
7.178,00 |
8.103,00 |
10.087,00 |
|
External costs |
7.098,00 |
7.988,00 |
10.010,00 |
|
Taxes |
80,00 |
115,00 |
77,00 |
|
Other day to day expenses |
|
|
|
|
Allowance to reversion fund |
|
|
|
|
A.I.OPERATING RESULT
(B.1+B.2+B.3+B.4-A.1-A.2-A.3-A.4-A.5-A.6) |
2.119,00 |
2.624,00 |
3.868,00 |
|
A.7.Financial expenses and similar |
694,00 |
687,00 |
704,00 |
|
Debts with related companies |
|
|
|
|
Debts with associated companies |
|
|
|
|
By debts with third parties and similar expenses |
694,00 |
687,00 |
704,00 |
|
Losses from financial investments |
|
|
|
|
A.8. Variation in financial investment provision |
|
|
|
|
A.9.Negative exchange difference |
167,00 |
65,00 |
137,00 |
|
A.II.POSITIVE FINANCIAL RESULTS
(B.5+B.6+B.7+B.8-A.7-A.8-A.9) |
|
|
|
|
A.III.PROFIT FROM ORDINARY ACTIVITIES
(A.I+A.II-B.I-B.II) |
1.525,00 |
2.115,00 |
3.158,00 |
|
A.10. Variation in provision in fixed assets |
|
|
|
|
A.11. Losses in fixed assets |
|
230,00 |
|
|
A.12. Losses from own shares and bonds |
|
|
|
|
A.13. Extraordinary charges |
211,00 |
87,00 |
84,00 |
|
A.14.Other exercises’ expenses and losses |
|
|
2,00 |
|
A.IV.POSITIVE EXTRAORDINARY RESULT
(B.9+B.10+B.11+B.12+B.13-A.10-A.11-A.12-A.13-A.14) |
|
|
|
|
A.V.PROFIT BEFORE TAXES (A.III+A.IV-B.III-B.IV) |
1.411,00 |
1.851,00 |
3.124,00 |
|
A.15.Corporate Taxes |
307,00 |
477,00 |
875,00 |
|
A.16. Other taxes |
|
|
|
|
A.VI.EXERCISE RESULT (PROFIT) (A.V-A.14-A.15) |
1.104,00 |
1.374,00 |
2.249,00 |
|
B) INCOMES (B.1 a B13) |
41.676,00 |
47.224,00 |
59.936,00 |
|
B.1. Turnover |
40.186,00 |
45.794,00 |
59.408,00 |
|
Sales |
39.219,00 |
45.205,00 |
59.137,00 |
|
Services provided |
1.392,00 |
1.362,00 |
899,00 |
|
Refunds and sale reminders |
-425,00 |
-773,00 |
-628,00 |
|
B.2.Increase in inventory of finished goods and
works in progress |
|
511,00 |
|
|
B.3.Expenses capitalized |
43,00 |
|
|
|
B.4. Other operating income |
1.083,00 |
623,00 |
345,00 |
|
Other incomes |
1.083,00 |
570,00 |
332,00 |
|
Grants |
|
53,00 |
13,00 |
|
Excess in provision for liabilities and charges |
|
|
|
|
B.I.OPERATING LOSSES
(A.1+A.2+A.3+A.4+A.5+A.6-B.1-B.2-B.3-B.4) |
|
|
|
|
B.5.Incomes from share participations |
|
|
|
|
From affiliated companies |
|
|
|
|
From associated companies |
|
|
|
|
From other companies |
|
|
|
|
B.6.Income from other securities and credits to
fixed assets |
|
|
|
|
From affiliated companies |
|
|
|
|
From associated companies |
|
|
|
|
Other companies |
|
|
|
|
B.7.Other interests and similar |
186,00 |
107,00 |
90,00 |
|
From affiliated companies |
98,00 |
|
|
|
From associated companies |
|
|
|
|
Other Interests |
88,00 |
15,00 |
10,00 |
|
Profits from investments |
|
92,00 |
80,00 |
|
B.8. Positive change difference |
81,00 |
136,00 |
41,00 |
|
B.II. NEGATIVE FINANCIAL RESULTS
(A.7+A.8+A.9-B.5-B.6-B.7-B.8) |
594,00 |
509,00 |
710,00 |
|
B.III.LOSSES FROM ORDINARY ACTIVITIES
(B.I+B.II-A.I-A.II) |
|
|
|
|
B.9.B.9. Gains from disposal of fixed assets |
|
12,00 |
|
|
B.10.Gains from dealing in own shares |
|
|
|
|
B.11. Paid in surplus |
20,00 |
4,00 |
2,00 |
|
B.12. Extraordinary income |
77,00 |
20,00 |
41,00 |
|
B.13.Other year’s income and profits |
|
17,00 |
9,00 |
|
B.IV.NEGATIVE EXTRAORDINARY LOSSES (A.10+A.11+A.12+A.13+A.14-B.9-B.10-B.11-B.12-B.13) |
114,00 |
264,00 |
34,00 |
|
B.V.LOSS BEFORE TAXES (B.III+B.IV-A.III-A.IV) |
|
|
|
|
B.VI.EXERCISE RESULTS (LOSS) (B.V+A.14+A.15) |
|
|
|
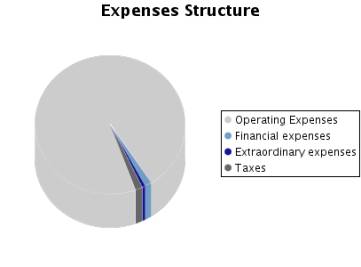
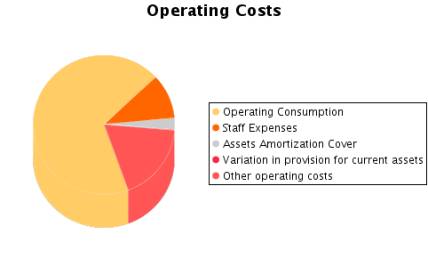
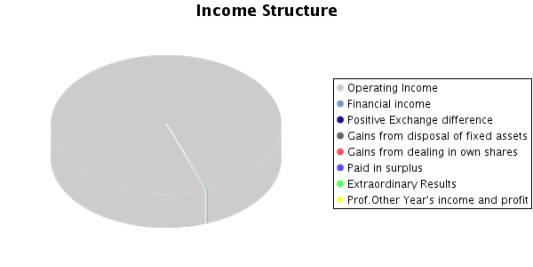
Composition of the
Profit and Loss Account
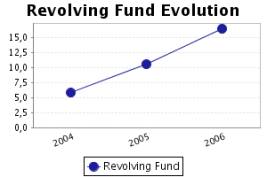
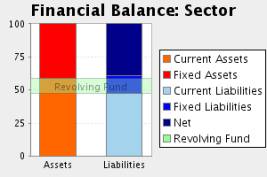
FINANCIAL BALANCE
Here the Main Capital Amounts of the company
and the Revolving Fund Evolution are analysed.
Financial Balance
Table
Figures given in thousands €
|
|
31/12/2004 (12) |
% |
31/12/2005 (12) |
% |
31/12/2006 (12) |
% |
|
A) DUE FROM SHAREHOLDERS FOR UNCALLED CAPITAL |
|
|
|
|
|
|
|
B) FIXED ASSETS |
11.902,00 |
32,81 |
10.159,00 |
25,91 |
9.134,00 |
20,52 |
|
C) DEFERRED EXPENSES |
40,00 |
0,11 |
10,00 |
0,03 |
8,00 |
0,02 |
|
D) CURRENT ASSETS |
24.338,00 |
67,08 |
29.047,00 |
74,07 |
35.364,00 |
79,46 |
|
ASSETS (A + B + C + D) |
36.280,00 |
|
39.216,00 |
|
44.506,00 |
|
|
|
||||||
|
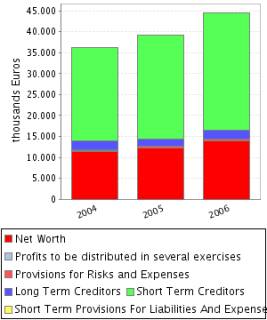
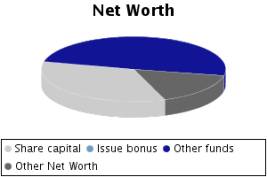
A) SHAREHOLDERS EQUITY |
11.497,00 |
31,69 |
12.268,00 |
31,28 |
13.914,00 |
31,26 |
|
B) DEFERRED INCOME |
49,00 |
0,14 |
82,00 |
0,21 |
17,00 |
0,04 |
|
C) PROVISIONS FOR LIABILITIES AND EXPENSES |
356,00 |
0,98 |
356,00 |
0,91 |
356,00 |
0,80 |
|
D) LONG TERM LIABILITIES |
2.139,00 |
5,90 |
1.611,00 |
4,11 |
2.189,00 |
4,92 |
|
E) SHORT TERM LIABILITIES |
22.239,00 |
61,30 |
24.899,00 |
63,49 |
28.030,00 |
62,98 |
|
F) SHORT TERM PROVISIONS FOR LIABILITIES AND EXPENSES |
|
|
|
|
|
|
|
LIABILITIES (A + B + C + D + E + F) |
36.280,00 |
|
39.216,00 |
|
44.506,00 |
|
Financial Balance
Composition
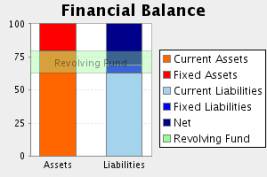
Comments on Financial Balance
In the 2004, the assets of the company were formed in 32,92% of Fixed
Assets and in 67,08% of Current Assets.This assets were financed in 31,82% with
own capitals, and in 6,88% with long term debt and in 61,30% with current
liabilities.
The result of this financial structure is a positive turnover fund of
2.099,00 Euros, which is equivalent to 5,79% proportion of the company’s
total assets.
In the 2005, the assets of the company were formed in 25,93% of Fixed
Assets and in 74,07% of Current Assets.This assets were financed in 31,49% with
own capitals, and in 5,02% with long term debt and in 63,49% with current
liabilities.
The result of this financial structure is a positive turnover fund of
4.148,00 Euros, which is equivalent to 10,58% proportion of the company’s
total assets.
This measure has increased with respect to the previous exercise in 97,62%
having also increased its proportion with respect to the total assets of the
company.
In the 2006, the assets of the company were formed in 20,54% of Fixed
Assets and in 79,46% of Current Assets.This assets were financed in 31,30% with
own capitals, and in 5,72% with long term debt and in 62,98% with current
liabilities.
The result of this financial structure is a positive turnover fund of
7.334,00 Euros, which is equivalent to 16,48% proportion of the company’s
total assets.
This measure has increased with respect to the previous exercise in
76,81% having also increased its proportion with respect to the total assets of
the company.
RATIOS
Main Ratios
|
|
31/12/2004 (12) |
31/12/2005 (12) |
31/12/2006 (12) |
|
STRUCTURAL RATIOS |
|
|
|
|
Management fund |
2.099,00 |
4.148,00 |
7.334,00 |
|
Management Fund Requirement |
11.369,00 |
11.011,00 |
14.515,00 |
|
Indebtedness (%) |
68,18 |
68,51 |
68,70 |
|
External Funds on Net Worth |
2,14 |
2,18 |
2,20 |
|
GENERAL ACTIVITY RATIO |
|
|
|
|
Turnover Increase (%) |
37,75 |
13,96 |
29,73 |
|
Added value growth (%) |
1,33 |
3,00 |
11,55 |
|
Cash Flow |
3.672,00 |
3.597,00 |
3.855,00 |
|
Labour Productivity |
1,90 |
1,91 |
1,93 |
|
Assets turnover |
1,11 |
1,17 |
1,34 |
|
Breakdown Point |
36.183,40 |
39.758,08 |
48.978,96 |
|
Security Margin of the Breakdown Point (%) |
12,41 |
14,35 |
18,03 |
|
ACTIVITY RATIOS |
|
|
|
|
Average Payment Period |
125 |
127 |
98 |
|
Average Collection Period |
144 |
140 |
141 |
|
Inventory Turnover Period |
65 |
79 |
65 |
|
SOLVENCY RATIOS |
|
|
|
|
Payback Capacity |
0,15 |
0,13 |
0,13 |
|
Assets Guarantee |
1,46 |
1,46 |
1,46 |
|
Short Term Debts Proportion (%) |
89,91 |
92,68 |
91,68 |
|
Interest Coverage |
4,77 |
4,06 |
5,22 |
|
LIQUIDITY RATIOS |
|
|
|
|
Current Ratio |
1,09 |
1,17 |
1,26 |
|
Immediate liquidity |
0,04 |
0,04 |
0,04 |
|
Treasury |
-9.270,00 |
-6.863,00 |
-7.181,00 |
|
Sales on Current Assets |
594 |
568 |
605 |
Results Analysis
Ratios
|
|
31/12/2004 (12) |
31/12/2005 (12) |
31/12/2006 (12) |
|
Economic profitability (%) |
5,84 |
6,69 |
8,69 |
|
Financial profitability (%) |
9,56 |
11,13 |
16,14 |
|
Equity gearing |
2,26 |
2,56 |
2,61 |
|
Operating Profitability (%) |
5,27 |
5,73 |
6,51 |
|
General Profitability (%) |
2,75 |
3,00 |
3,79 |
Comments on the
Results Analysis Ratios
The economic profitability in the year2005 achieved a 6,69% positive
level, due to a 5,73% economic margin and to an assets turnover of1,17%.
The economic profitability in the year has increased from 5,84% up to
6,69%. This growth is due to the economic margin increase, from 5,27% to the
current 5,73Y%, and to the assets turnover index, which in the last period has
achieved 1,17, compared to 1,11 del 2004.
Financial profitability on 2005 achieved a 11,13%.
The company’s financial structure has instigated its economic
profitability with an indebtedness level of 2,56.
The general profitability on 2005 achieved a 3,00%.
The economic profitability in the year2006 achieved a 8,69% positive
level, due to a 6,51% economic margin and to an assets turnover of1,34%.
The economic profitability in the year has increased from 6,69% up to
8,69%. This growth is due to the economic margin increase, from 5,73% to the
current 6,51Y%, and to the assets turnover index, which in the last period has
achieved 1,34, compared to 1,17 del 2005.
Financial profitability on 2006 achieved a 16,14%.
The company’s financial structure has instigated its economic
profitability with an indebtedness level of 2,61.
The general profitability on 2006 achieved a 3,79%.
SECTORIAL ANÁLYSIS
Large Capital Amounts
and Financial Balance
Figures given in %
|
|
COMPANY (2006) |
SECTOR |
DIFFERENCE |
DIFFERENCE RELATIVE |
|
|
|
|
|
|
ASSETS |
|
|
|
|
|
|
|
|
|
|
A) DUE FROM SHAREHOLDERS FOR UNCALLED CAPITAL |
|
0,00 |
|
|
|
|
|
|
|
|
B) FIXED ASSETS |
20,52 |
41,06 |
-20,54 |
-50,02 |
|
|
|
|
|
|
C) DEFERRED EXPENSES |
0,02 |
0,10 |
-0,08 |
-79,38 |
|
|
|
|
|
|
D) CURRENT ASSETS |
79,46 |
58,85 |
20,61 |
35,03 |
|
|
|
|
|
|
ASSETS (A + B + C + D) |
100 |
100 |
|
|
|
|
|
|
|
|
|
|
|
|
|
|
|
|
|
|
|
|
COMPANY (2006) |
SECTOR |
DIFFERENCE |
DIFFERENCE RELATIVE |
|
|
|
|
|
|
LIABILITIES |
|
|
|
|
|
|
|
|
|
|
A) SHAREHOLDERS EQUITY |
31,26 |
36,34 |
-5,08 |
-13,98 |
|
|
|
|
|
|
B) DEFERRED INCOME |
0,04 |
3,02 |
-2,98 |
-98,67 |
|
|
|
|
|
|
C) PROVISIONS FOR LIABILITIES AND EXPENSES |
0,80 |
0,20 |
0,60 |
310,26 |
|
|
|
|
|
|
D) LONG TERM LIABILITIES |
4,92 |
13,09 |
-8,17 |
-62,42 |
|
|
|
|
|
|
E) SHORT TERM LIABILITIES |
62,98 |
47,36 |
15,62 |
32,99 |
|
|
|
|
|
|
F) SHORT TERM PROVISIONS FOR LIABILITIES AND EXPENSES |
|
0,00 |
|
|
|
|
|
|
|
|
LIABILITIES (A + B + C + D + E + F) |
100 |
100 |
|
|
|
|
|
|
|
Financial Balance Composition
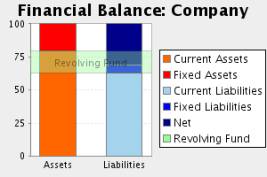
Comments to the Sectorial
Analysis
In the 2006, the assets of the company were formed in 20,54% of fixed
assets and in 79,46Current Assets % In the sector, the proportion of fixed
assets was of 41,15%, 50,09% superior, and the proportion of current assets was
of 58,85%, 35,03% inferior.
The assets were financed in the company in 31,30% with own capitals , in
5,72% with fixed liabilities and in 62,98% with current liabilities In the
sector, the self financing represented 39,36%, 20,47% superior. On the other
hand the long term debts represented in the sector an average of 13,29%
financing, with a relative difference of 56,95% favourable to the sectorAnd,
short term liabilities represented in the sector an average of 47,36%
financing, with a relative difference of 32,99% in favour of the company
The result of this company’s financial structure is a turnover fund that
represents 16,48% of the total assets; in the sector, this same proportion is
11,49%, therefore, we can say that the company’s turnover fund is 43,42% higher
than the one in of the sector.
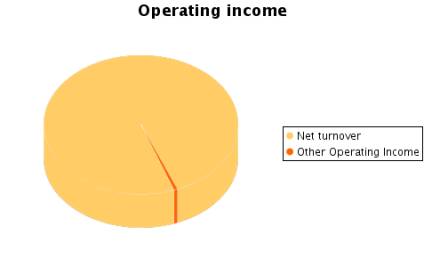
Analytical Account of Results
Figures given in %
|
|
COMPANY (2006) |
SECTOR |
DIFFERENCE |
DIFFERENCE RELATIVE |
|
Turnover |
99,42 |
98,99 |
0,43 |
0,00 |
|
Other operating income |
0,58 |
1,01 |
-0,43 |
-0,42 |
|
Production Value |
100,00 |
100,00 |
0,00 |
0,00 |
|
Operating expenses |
64,10 |
51,18 |
12,92 |
0,25 |
|
Other operation expenses |
16,88 |
18,80 |
-1,92 |
-0,10 |
|
Added value |
19,02 |
30,02 |
-11,00 |
-0,37 |
|
Labour cost |
9,86 |
12,88 |
-3,02 |
-0,23 |
|
Gross Economic Result |
9,16 |
17,14 |
-7,98 |
-0,47 |
|
Assets depreciation |
2,52 |
4,47 |
-1,95 |
-0,44 |
|
Variation in provision for current assets and bad debt losses |
0,17 |
0,90 |
-0,73 |
-0,81 |
|
Net Economic Result |
6,47 |
11,77 |
-5,30 |
-0,45 |
|
Financial income |
0,22 |
1,46 |
-1,24 |
-0,85 |
|
Financial Charges |
1,41 |
2,86 |
-1,45 |
-0,51 |
|
Variation in financial investment provision |
|
-0,01 |
|
|
|
Ordinary Activities Result |
5,29 |
10,38 |
-5,09 |
-0,49 |
|
Extraordinary income |
0,09 |
0,98 |
-0,89 |
-0,91 |
|
Extraordinary charges |
0,14 |
0,56 |
-0,42 |
-0,75 |
|
Variation in provision in fixed assets |
|
0,22 |
|
|
|
Results before Taxes |
5,23 |
10,58 |
-5,35 |
-0,51 |
|
Corporate taxes |
1,46 |
3,02 |
-1,56 |
-0,52 |
|
Net Result |
3,76 |
7,56 |
-3,80 |
-0,50 |
|
Assets depreciation |
2,52 |
4,47 |
-1,95 |
-0,44 |
|
Change of Provisions |
0,17 |
1,11 |
-0,94 |
-0,85 |
|
Net Self-Financing |
6,45 |
13,14 |
-6,69 |
-0,51 |
Principales Ratios
|
|
COMPANY (2006) |
PTILE25 |
PTILE50 |
PTILE75 |
|
STRUCTURAL RATIOS |
|
|
|
|
|
Management fund |
7.334,00 |
-221,55 |
2.005,50 |
3.442,68 |
|
Management Fund Requirement |
14.515,00 |
-5.776,21 |
-1.177,42 |
735,00 |
|
Indebtedness (%) |
68,70 |
49,90 |
62,01 |
72,54 |
|
External Funds on Net Worth |
2,20 |
1,00 |
1,63 |
2,64 |
|
GENERAL ACTIVITY RATIO |
|
|
|
|
|
Turnover Increase (%) |
29,73 |
4,40 |
12,14 |
20,28 |
|
Added value growth (%) |
11,55 |
0,82 |
9,26 |
20,13 |
|
Cash Flow |
3.855,00 |
667,00 |
1.038,00 |
1.676,48 |
|
Labour Productivity |
1,93 |
1,58 |
1,99 |
2,46 |
|
Assets turnover |
1,34 |
0,80 |
0,93 |
1,24 |
|
Breakdown Point |
48.978,96 |
7.040.182,86 |
10.601.758,75 |
16.126.471,04 |
|
Security Margin of the Breakdown Point (%) |
18,03 |
8,93 |
12,94 |
19,60 |
|
ACTIVITY RATIOS |
|
|
|
|
|
Average Payment Period |
98 |
80 |
116 |
164 |
|
Average Collection Period |
141 |
120 |
140 |
162 |
|
Inventory Turnover Period |
65 |
28 |
61 |
81 |
|
SOLVENCY RATIOS |
|
|
|
|
|
Payback Capacity |
0,13 |
0,09 |
0,16 |
0,26 |
|
Assets Guarantee |
1,46 |
1,38 |
1,61 |
2,00 |
|
Short Term Debts Proportion (%) |
91,68 |
74,80 |
82,03 |
91,48 |
|
Interest Coverage |
5,22 |
2,30 |
5,10 |
15,33 |
|
LIQUIDITY RATIOS |
|
|
|
|
|
Current Ratio |
1,26 |
0,95 |
1,25 |
1,66 |
|
Immediate liquidity |
0,04 |
0,03 |
0,07 |
0,24 |
|
Treasury |
-7.181,00 |
-3.855,10 |
-1.373,98 |
484,73 |
|
Sales on Current Assets |
605 |
459 |
554 |
707 |
Results Analysis Ratios
|
|
COMPANY (2006) |
PTILE25 |
PTILE50 |
PTILE75 |
|
Economic profitability (%) |
8,69 |
2,55 |
5,74 |
9,90 |
|
Operating Profitability (%) |
6,51 |
3,27 |
6,03 |
7,94 |
|
Equity gearing |
2,61 |
1,24 |
1,80 |
3,10 |
|
Financial profitability (%) |
16,14 |
4,27 |
8,98 |
17,68 |
|
General Profitability (%) |
3,79 |
1,48 |
3,02 |
5,90 |
NOTES
PO Box: 112 Gandia (Valencia). Telephones: 902300155-962954053.
RATING
EXPLANATIONS
|
RATING |
STATUS |
PROPOSED CREDIT LINE |
|
|
>86 |
Aaa |
Possesses an extremely sound financial base with the strongest capability
for timely payment of interest and principal sums |
Unlimited |
|
71-85 |
Aa |
Possesses adequate working capital. No caution needed for credit
transaction. It has above average (strong) capability for payment of interest
and principal sums |
Large |
|
56-70 |
A |
Financial & operational base are regarded healthy. General
unfavourable factors will not cause fatal effect. Satisfactory capability for
payment of interest and principal sums |
Fairly Large |
|
41-55 |
Ba |
Overall operation is considered normal. Capable to meet normal
commitments. |
Satisfactory |
|
26-40 |
B |
Unfavourable & favourable factors carry similar weight in credit
consideration. Capability to overcome financial difficulties seems comparatively
below average. |
Small |
|
11-25 |
Ca |
Adverse factors are apparent. Repayment of interest and principal sums
in default or expected to be in default upon maturity |
Limited with
full security |
|
<10 |
C |
Absolute credit risk exists. Caution needed to be exercised |
Credit not
recommended |
|
NR |
In view of the lack of information, we have no basis upon which to
recommend credit dealings |
No Rating |
|
This score serves as a reference to assess SC’s credit risk
and to set the amount of credit to be extended. It is calculated from a
composite of weighted scores obtained from each of the major sections of this
report. The assessed factors and their relative weights (as indicated through
%) are as follows:
Financial
condition (40%) Ownership
background (20%) Payment
record (10%)
Credit history
(10%) Market trend
(10%) Operational
size (10%)