![]()
MIRA
INFORM REPORT
|
Report Date : |
02.08.2008 |
IDENTIFICATION
DETAILS
|
Name : |
FELIX DISSENY SOCIEDAD LIMITADA. |
|
|
|
|
Registered Office : |
Street Des Cap
Negre, 18, Cp 07714, Mahon Baleares |
|
|
|
|
Country : |
Spain |
|
|
|
|
Financials (as on) : |
31.12.2006 |
|
|
|
|
Date of Incorporation : |
|
|
|
|
|
Legal Form : |
Limited Liability Company |
|
|
|
|
Line of Business : |
Imitation Jewellery |
RATING &
COMMENTS
|
MIRA’s Rating : |
Ba |
|
RATING |
STATUS |
PROPOSED CREDIT LINE |
|
|
41-55 |
Ba |
Overall operation is considered normal. Capable to meet normal
commitments. |
Satisfactory |
|
Maximum Credit Limit : |
20.001,68 € |
|
|
|
|
Status : |
Satisfactory |
|
|
|
|
Payment Behaviour : |
Regular |
|
|
|
|
Litigation : |
Clear |
FINANCIAL REPORT
FELIX DISSENY SOCIEDAD LIMITADA.
TAX NUMBER: B07783665
EXECUTIVE SUMMARY
Identification
Current Business Name: FELIX DISSENY SOCIEDAD LIMITADA.
Commercial Name: VANDERLY
Other names: YES
Current Address: STREET DES
CAP NEGRE, 18, CP 07714, MAHON BALEARES
Telephone number: 971361297 Fax: 971366323
URL: www.felixdisseny.com Corporate e-mail: info@felixdisseny.com
Commercial Risk
Credit Appraisal: 20.001,68 €
RAI: NO
Legal
Actions: NO
Financial Information
Latest Balance sheet sales (2006): 797.793,00 € (MERCANTILE REGISTER)
Result: -75.991 €
Total Assets: 758.833 €
Social Capital: 216.360,00 €
Employees: 18
Commercial Information
Constitution Date: 10/03/1996
Business activity: Imitation
jewellery
NACE Code: 3661
International Operations: Exports
Corporate Structure
Administrator:
Other Complementary Information
Latest proceeding published in BORME: 10/10/2007 Registration
of accounts
Latest press article: 21/09/2000 EL
MUNDO BALEARES (GENERAL INFORMATION)
Bank Entities: No
Credit Appraisal
Maximum Credit
(from 0 a
6,000,000 €)
Favourable to 20.001,68 €
Rating Evolution
Financial Situation
Fiscal year2006
|
Treasury |
Excellent |
|
Indebtedness |
Average |
|
Profitability |
Negative |
|
Balance |
Very good |
Performance
|
Legal Actions |
None or Negligible |
|
Business Trajectory |
Excellent |
RAI 
COMPANY NOT REGISTERED IN THE R.A.I.
This company is not registered in the Disputed Bills register (R.A.I.)
DATE AND TIME OF THE CONSULTATION: 21/07/2008
13:07:21
INCIDENTS

Summary
LEGAL ACTIONS: No legal incidences registered
CLAIM FILED AGAINST THE ADMINISTRATION: No administrative
claims registered
AFFECTED BY: No significant element.
FINANCIAL ELEMENTS AND SECTORIAL
COMPARATIVE
FINANCIAL ELEMENTS
Figures given in €
|
|
2004 (12) |
2005 (12) |
2006 (12) |
% ASSETS |
|
|
|
|
|
|
BALANCE SHEET ANALYSIS |
|
|
|
|
|
|
|
|
|
|
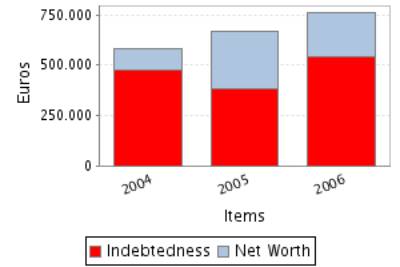
OWN FUNDS |
106.985,60 |
291.490,41 |
215.499,00 |
28,40 |
|
|
|
|
|
|
DEBT |
474.188,26 |
379.258,84 |
543.334,00 |
71,60 |
|
|
|
|
|
|
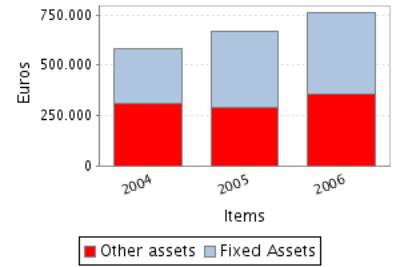
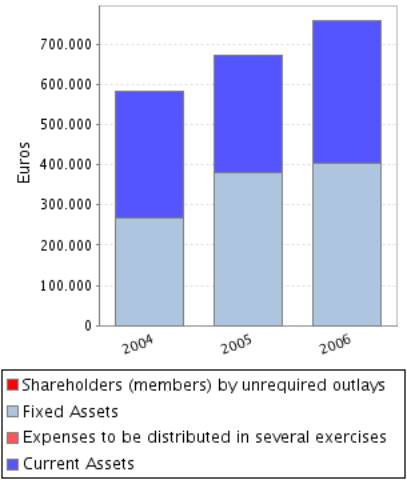
FIXED ASSETS |
268.960,21 |
379.896,43 |
402.726,00 |
53,07 |
|
|
|
|
|
|
TOTAL ASSETS |
581.173,86 |
670.749,25 |
758.833,00 |
|
|
|
|
|
|
|
|
|
|
|
|
|
|
|
|
|
|
|
2004 (12) |
2005 (12) |
2006 (12) |
% SALES |
|
|
|
|
|
|
PROFIT AND LOSS ACCOUNT ANALYSIS |
|
|
|
|
|
|
|
|
|
|
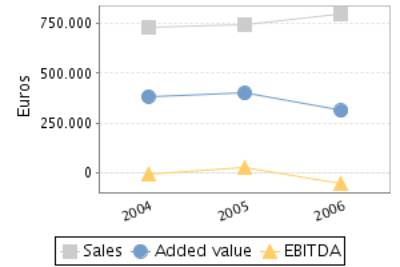
SALES |
729.519,83 |
740.978,68 |
797.793,00 |
|
|
|
|
|
|
|
ADDED VALUE |
383.015,99 |
399.606,57 |
312.236,00 |
39,14 |
|
|
|
|
|
|
EBITDA |
-3.457,58 |
27.700,29 |
-54.404,00 |
-6,82 |
|
|
|
|
|
|
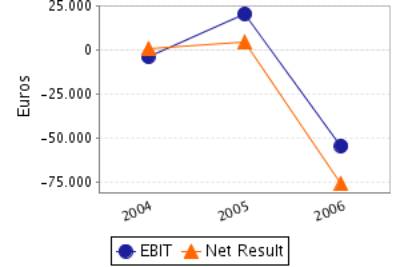
EBIT |
-3.744,55 |
20.592,40 |
-54.404,00 |
-6,82 |
|
|
|
|
|
|
NET RESULT |
1.034,64 |
4.204,86 |
-75.991,00 |
-9,53 |
|
|
|
|
|
Balance Sheets Items Analysis
Balance Sheet Comments
Total assets of the company grew 15,41% between 2004 and 2005.
This growth is a consequence of the fixed assets increase of 41,25%.
This growth has been financed with a Shareholders’ equity increase of
172,46% this company’s net increase has also covered the reduction of the
company’s indebtedness of 20,02% of company’s indebtedness.
Total assets of the company grew 13,13% between 2005 and 2006.
This growth has been inferior in the case of the fixed assets that
increased just in 6,01%.
This growth has been financed with an indebtedness increase of
43,26%.Moreover, net worth has been reduced in 26,07%, which explains a part of
the indebtedness increase. .
Profit and Loss Account Analysis
Profit and Loss Account Comments
The company’s sales figure grew 1,57% between 2004 and 2005.
The company’s EBIT grew 649,93% between 2004 and 2005.
This evolution implies an increase in the company’s operating
profitability.
The result of these variations is an increase of the company’s Economic
Profitability of 576,50% in the analysed period, being this profitability of
3,07% in the year 2005.
The company’s Net Result grew 306,41% between 2004 and 2005.
This evolution, compared to the EBIT’s performance, implies that the
financial and extraordinary activities have had a negative effect in the
company’s Financial Profitability.
The result of these variations is an increase of the company’s Economic Profitability
of 49,16% in the analysed period, being equal to 1,44% in the year 2005.
The company’s sales figure grew 7,67% between 2005 and 2006.
The company’s EBIT decreased in 364,19% between 2005 and 2006.
This evolution implies a reduction in the company’s operating
profitability.
The result of these variations is a decrease of the company’s Economic
Profitability of 333,52% in the analysed period, being this profitability of
-7,17% in the year 2006.
The company’s Net Result decreased in 1.907,22% between 2005 and 2006.
This evolution, compared to the EBIT’s performance, implies that the
financial and extraordinary activities have had a negative effect in the
company’s Financial Profitability.
The result of these variations is a reduction of the company’s
profitability of 2.544,56% in the analysed period, being equal to -35,26% in
the year 2006.
ANNUAL FINANCIAL REPORT
ADDITIONAL DATA
Source: annual financial report 2001
Results Distribution
Figures given in €
|
DISTRIBUTION
BASE |
DISTRIBUTION TO |
||
|
Profit and Loss |
1.534,00 |
Retained earnings |
153,00 |
|
Carry Over |
0,00 |
Voluntary Reserve |
1.381,00 |
|
Voluntary reserves |
0,00 |
Prior years losses |
0,00 |
|
Reserves |
0,00 |
Carry Over |
0,00 |
|
Other concepts |
0,00 |
Other funds |
0,00 |
|
Total of Amounts to be distributed |
1.534,00 |
Dividends |
0,00 |
|
|
|
Other Applications |
0,00 |
COMPARATIVE SECTOR ANALYSIS
Values table
Figures expressed in %
|
|
COMPANY (2006) |
SECTOR |
DIFFERENCE |
DIFFERENCE RELATIVE |
|
|
|
|
|
|
BALANCE SHEET ANALYSIS: % on the total
assets |
|
|
|
|
|
|
|
|
|
|
OWN FUNDS |
28,40 |
39,99 |
-11,59 |
-28,98 |
|
|
|
|
|
|
DEBT |
71,60 |
60,01 |
11,59 |
19,31 |
|
|
|
|
|
|
FIXED ASSETS |
53,07 |
40,19 |
12,88 |
32,05 |
|
|
|
|
|
|
|
|
|
|
|
|
|
|
|
|
|
|
COMPANY (2006) |
SECTOR |
DIFFERENCE |
DIFFERENCE RELATIVE |
|
|
|
|
|
|
PROFIT AND LOSS ACCOUNT ANALYSIS: % on the total
operating income |
|
|
|
|
|
|
|
|
|
|
SALES |
100,00 |
98,53 |
1,47 |
1,49 |
|
|
|
|
|
|
ADDED VALUE |
39,14 |
38,77 |
0,37 |
0,95 |
|
|
|
|
|
|
EBIT |
-6,82 |
4,89 |
-11,71 |
-239,40 |
|
|
|
|
|
|
NET RESULT |
-9,53 |
3,00 |
-12,52 |
-418,04 |
|
|
|
|
|
Sector Composition
Compared sector (NACE): 366
Number of companies: 330
Size (Sales Figure) : 0 - 2.800.000,00 Euros
Comments on the sectorial comparative
Compared to its sector the assets of the companies show a greater
proportion of fixed assets. Specifically the difference with the sector average
is 12,88% , which means a relative difference of 32,05% .
In liabilities composition the company appeals on a wider scale to self
financing, being the proportion of net worth of 11,59% inferior, which means a
relative difference of 28,98% 11,59% more than the sector, which means a
difference of 19,31% .
The proportion that the sales mean to the company’s total ordinary
income is 100,00%, 1,47% higher than in the sector, which means a relative
difference of 1,49% .
The company’s EBIT was negative and equal to-6,82% with regard to the
total ordinary income, 11,71% less than the sector, which means a relative
difference of 239,40% .
The company’s capacity to generate operating income is equal to that of
the sector as its ratio EBIT/Sales is also equal.
The company’s net result was negative and equal to -9,53% with regard to
the total ordinary income, 12,52% less than the sector, which means a relative
difference of 418,04% .
The financial and extraordinary results and the tax impact have had a
more positive impact on the Net result in the company than in the sector; as a
consequence, the company shows a better Net Result/EBIT ratio.
ADDRESSES
Current Legal Seat Address:
STREET DES CAP NEGRE, 18
07714 MAHON BALEARES
Previous Seat Address:
PERIOD CONQUESTA, 9
07701
MAO BALEARES
CORPORATE STRUCTURE
ADMINISTRATIVE LINKS
Main Board members, Directors and Auditor ![]()
|
POSITION |
SURNAMES AND
NAME |
APPOINTMENT DATE |
|
ADMINISTRATOR |
FELIX MELSION FRANCESC JOSEP |
06/10/1999 |
|
ADMINISTRATOR |
FELIX MELSION CRISTINA |
06/10/1999 |
FINANCIAL LINKS
|
|
BUSINESS NAME |
CIF / COUNTRY |
% |
SOURCE |
DATA INF. |
|
|
FELIX MELSION CRISTINA |
|
Indet. |
OWN SOURCES |
31/07/2008 |
|
|
FELIX MELSION FRANCESC JOSEP |
|
Indet. |
OWN SOURCES |
31/07/2008 |
CREDIT INFORMATION
Constitution Date: 10/03/1996
Foundation Date: 01/01/1996
Business activity 
NACE Code: 3661
NACE Activity: Manufacture of imitation jewellery
Business: FABRICACION Y COMERCIO DE BISUTERIA EN GENERAL, Y
DE ARTICULOS DE ADORNO Y DE REGALO Y DE RECUERDO.
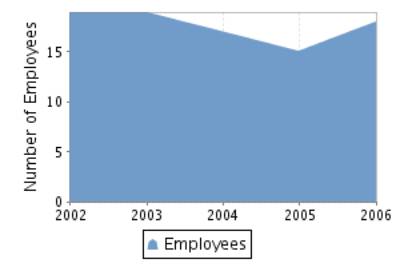
Employees 
Number of total employees: 18 (2008)
Number of fixed employees: 88,89%
Number of temporary employees: 11,11%
Employees evolution
COMMERCIAL OPERATIONS 
SALES
Collection (estimated):
Exports to: FRANCIA,ITALIA,INGLATERRA Y ALEMANIA
Brands, Signs and Commercial
Names 
Brand name: F.D. (Valid)
Type: DENOMINATIVE Date: 16/04/2007
Brand name: V VANDERLY (Valid)
Type: JOINT Date: 10/01/2006
Brand name: MIJITA (Valid)
Type: JOINT Date: 12/07/2005
Brand name: FELIX DISSENY (Valid)
Type: JOINT Date: 30/01/2002
LEGAL STRUCTURE
Constitution Data
Register Date: 10/03/1996
Register town: Baleares
Announcement number: 252456
Legal form: LIMITED LIABILITY COMPANY
Social Capital: 12.020,24 €
Current structure data 
Current Legal Form: LIMITED LIABILITY COMPANY
Current Capital: 216.360,00 €
Legal Aspects
Obligation to fill in Financial Statements: YES
Chamber census: YES (2006)
Listed on a Stock Exchange: NO
B.O.R.M.E.(Official Companies
Registry Gazette) 
Registered Proceedings
|
PROCEEDINGS |
DATE |
NOTICE NUM. |
TRADE REG. |
|
Capital increase |
14/03/2007 |
151691 |
Mahón |
Other Proceedings published
|
PROCEEDINGS |
DATE |
NOTICE NUM. |
TRADE REG. |
|
Registration of
accounts (2006) Individual |
10/10/2007 |
790730 |
Mahón |
|
Registration of
accounts (2005) Individual |
13/09/2006 |
413758 |
Mahón |
|
Registration of
accounts (2004) Individual |
16/09/2005 |
425437 |
Mahón |
|
Registration of
accounts (2003) Individual |
16/09/2004 |
414142 |
Mahón |
Press articles

21/09/2000 EL MUNDO BALEARES (GENERAL INFORMATION)
EL DIRECTOR DE ESTA SDAD, FRANCISCO JOSE FELIX MESION FUE DETENIDO EL 18
DE SEPTIEMBRE DE 2000 POR FALSIFICAR PIEZAS DE LA JOYERIA TOUS ANTE LA DENUNCIA
PRESENTADA POR ESTA. LAS FALSIFICACIONES INCAUTADAS PUEDEN SUPONER UN MONTANTE
EN TORNO AL MM. DE PTAS, SEGUN LAS ESTIMACIONES DE LA FIRMA TOUS. SIN EMBARGO,
LAS PERDIDAS PARA LA FIRMA SE PUEDEN MULTIPLICAR POR VARIOS CIENTOS DE MM. BAJO
EL NOMBRE COMERCIAL DE VANDERLY, LA FIRMA FELIX DISSENY COPA TODAS LAS FASES DE
LA PRODUCCION. FELIX DISSENY TIENE UNA TIENDA DE BISUTERIA EN MAO, VANDERLY.
ADEMAS FUERON DETENIDOS 3 MAYORISTAS POR DELITO CONTRA LA PROPIEDAD INTELECTUAL
E INDUSTRIAL DE TOUS.
Complementary Information
En el deposito de cuentas del ejercicio 2002
se ha detectado un
descuadre en las siguientes partidas: el resultado del Pasivo del
balance cerrado a 31/12/2002 no coincide con el que figura en la
cuenta de Perdidas y Ganancias.
FINANCIAL INFORMATION
The information on the last account contained in this report is
extracted from the Mercantile Register file of the legal address of the Company
and dated 07/10/2007.
BALANCE SHEET
Assets
Figures given in €
|
|
31/12/2004 (12) |
31/12/2005 (12) |
31/12/2006 (12) |
|
A) DUE FROM SHAREHOLDERS FOR UNCALLED CAPITAL |
|
|
|
|
B) FIXED ASSETS |
268.960,21 |
379.896,43 |
402.726,00 |
|
I. Incorporation costs |
|
|
|
|
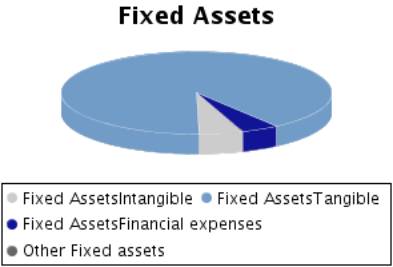
II. Intangible fixed assets |
9.446,82 |
11.270,75 |
21.210,00 |
|
III. Tangible fixed assets |
241.443,97 |
350.556,26 |
363.447,00 |
|
IV. Financial fixed assets |
18.069,42 |
18.069,42 |
18.069,00 |
|
V.Owners equity |
|
|
|
|
VI.Long term trade liabilities |
|
|
|
|
C) DEFERRED EXPENSES |
|
|
|
|
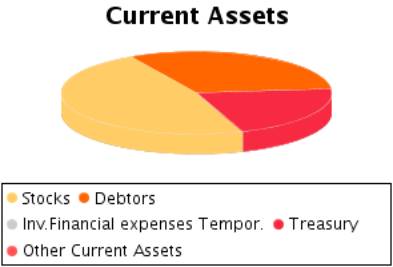
D) CURRENT ASSETS |
312.213,65 |
290.852,82 |
356.107,00 |
|
I. Shareholders by required outlays |
|
|
|
|
II. Stocks |
154.060,56 |
155.290,40 |
169.321,00 |
|
III. Debtors |
139.558,16 |
107.224,03 |
112.165,00 |
|
IV. Temporary financial investment |
|
|
|
|
V. Short-term own shares |
|
|
|
|
VI. Treasury |
18.594,93 |
28.338,39 |
74.621,00 |
|
VII. Periodification adjustments |
|
|
|
|
ASSETS (A + B + C + D) |
581.173,86 |
670.749,25 |
758.833,00 |
Assets composition
Liabilities
Figures given in €
|
|
31/12/2004 (12) |
31/12/2005 (12) |
31/12/2006 (12) |
|
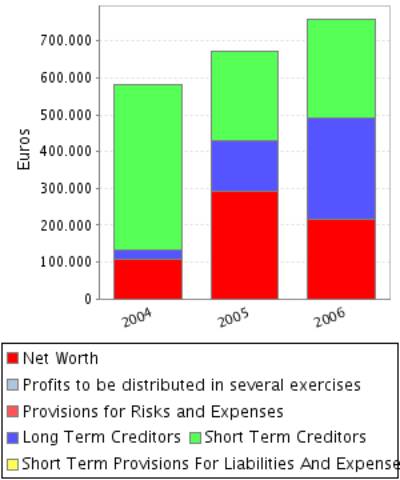
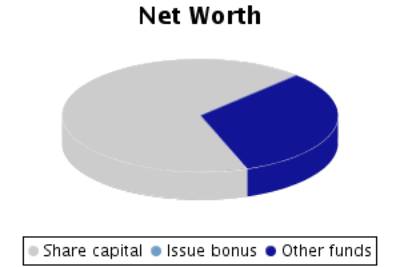
A) SHAREHOLDERS EQUITY |
106.985,60 |
291.490,41 |
215.499,00 |
|
I. Share capital |
36.060,64 |
216.360,59 |
216.360,00 |
|
II. Issue bonus |
|
|
|
|
III.Revaluation reserve |
|
|
|
|
IV.Reserves |
102.572,80 |
102.572,80 |
102.572,00 |
|
Capital adjustments in Euros |
|
102.572,80 |
|
|
Sundry reserves |
102.572,80 |
|
102.572,00 |
|
V.Results from previous years |
-32.682,48 |
-31.647,84 |
-27.442,00 |
|
VI.Profit and Losses |
1.034,64 |
4.204,86 |
-75.991,00 |
|
VII.Dividend paid during the year |
|
|
|
|
VIII.Own shares for capital reduction |
|
|
|
|
B) DEFERRED INCOME |
|
|
|
|
C) PROVISIONS FOR LIABILITIES AND EXPENSES |
|
|
|
|
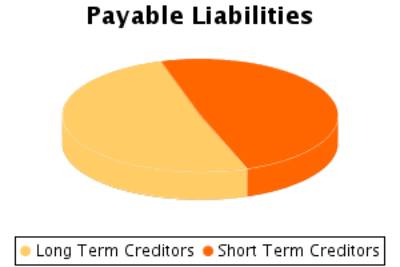
D) LONG TERM LIABILITIES |
24.830,37 |
138.420,42 |
276.921,00 |
|
E) SHORT TERM LIABILITIES |
449.357,89 |
240.838,42 |
266.413,00 |
|
F) SHORT TERM PROVISIONS FOR LIABILITIES AND
EXPENSES |
|
|
|
|
LIABILITIES (A + B + C + D + E + F) |
581.173,86 |
670.749,25 |
758.833,00 |
Liabilities
Composition
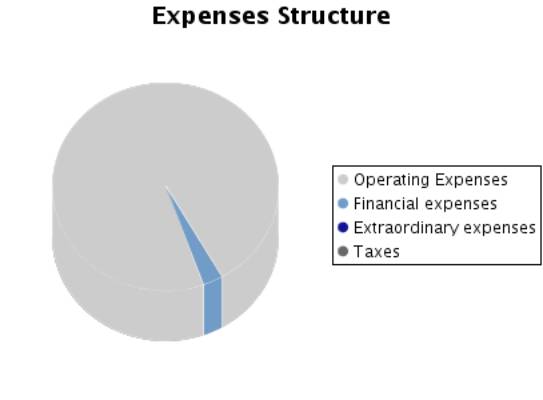
PROFIT AND LOSS ACCOUNT
Itams of the Profit and Loss Account
Figures given in €
|
|
31/12/2004 (12) |
31/12/2005 (12) |
31/12/2006 (12) |
|
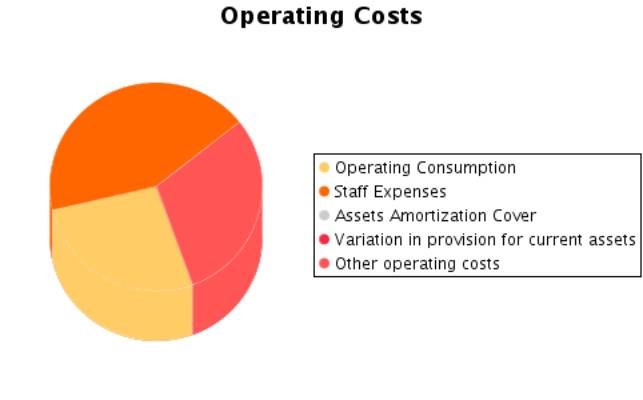
A) EXPENSES (A.1 a A.15) |
767.277,20 |
766.777,33 |
876.099,00 |
|
A.1.Operating costs |
178.756,61 |
201.093,73 |
229.438,00 |
|
A.2. Labour cost |
386.473,57 |
371.906,28 |
366.640,00 |
|
Wages |
306.102,08 |
296.004,96 |
294.673,00 |
|
Social security expenses |
80.371,49 |
75.901,32 |
71.967,00 |
|
A.3. Assets depreciation |
286,97 |
7.107,89 |
|
|
A.4. Variation in provision for current assets |
|
|
|
|
A.5. Other operating costs |
174.645,69 |
167.372,40 |
256.119,00 |
|
A.I. OPERATING RESULT (B.1-A.1-A.2-A.3-A.4-A.5) |
|
20.592,40 |
|
|
A.6.Financial expenses and similar |
26.524,19 |
17.321,20 |
23.273,00 |
|
Debts with related companies |
|
16.164,46 |
|
|
Debts with associated companies |
|
|
|
|
Other companies debts By debts with third parties and similar expenses |
26.524,19 |
1.156,74 |
23.273,00 |
|
Losses from financial investments |
|
|
|
|
A.7. Variation in financial investment provision |
|
|
|
|
A.8.Negative exchange difference |
146,75 |
173,74 |
629,00 |
|
A.II.POSITIVE FINANCIAL RESULTS (B.2+B.3-A.6-A.7-A.8) |
|
|
|
|
A.III.PROFIT FROM ORDINARY ACTIVITIES
(A.I+A.II-B.I-B.II) |
|
3.337,23 |
|
|
A.9. Variation in provision in fixed assets |
|
|
|
|
A.10. Losses in fixed assets |
|
|
|
|
A.11. Losses from own shares and bonds |
|
|
|
|
A.12. Extraordinary charges |
|
|
|
|
A.13.Other
exercises’ expenses and losses |
|
|
|
|
A.IV.POSITIVE
EXTRAORDINARY RESULT (B.4+B.5+B.6+B.7+B.8-A.9-A.10-A.11-A.12-A.13) |
31.830,87 |
2.669,72 |
337,00 |
|
A.V.PROFIT BEFORE
TAXES (A.III+A.IV-B.III-B.IV) |
1.478,06 |
6.006,95 |
|
|
A.14.Corporate
Taxes |
443,42 |
1.802,09 |
|
|
A.15. Other
taxes |
|
|
|
|
A.VI.EXERCISE
RESULT (PROFIT) (A.V-A.14-A.15) |
1.034,64 |
4.204,86 |
|
|
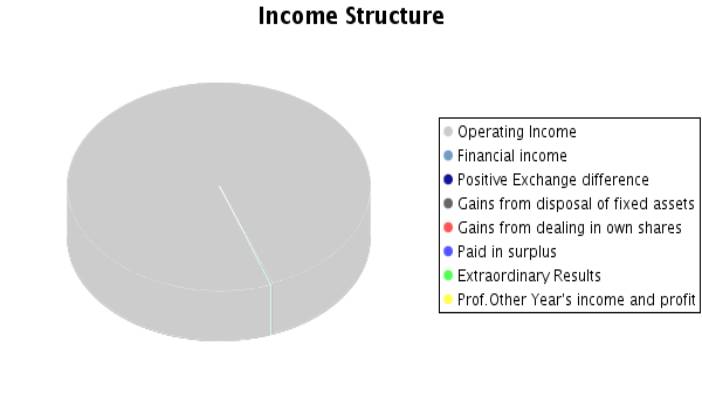
B) INCOMES (B.1
a B.8) |
768.311,84 |
770.982,19 |
800.108,00 |
|
B.1.Operating
income |
736.418,29 |
768.072,70 |
797.793,00 |
|
Turnover |
729.519,83 |
740.978,68 |
797.793,00 |
|
Other operating
income |
6.898,46 |
27.094,02 |
|
|
B.I.OPERATING
LOSSES (A.1+A.2+A.3+A.4+A.5-B.1) |
3.744,55 |
|
54.404,00 |
|
B.2.Financial Income |
62,68 |
7,37 |
1.897,00 |
|
From affiliated companies |
|
|
|
|
From associated companies |
|
|
|
|
Other |
62,68 |
7,37 |
1.897,00 |
|
Gains from investments |
|
|
|
|
B.3. Positive change difference |
|
232,40 |
81,00 |
|
B.II. NEGATIVE
FINANCIAL RESULTS (A.6+A.7+A.8-B.2-B.3) |
26.608,26 |
17.255,17 |
21.924,00 |
|
B.III.LOSSES
FROM ORDINARY ACTIVITIES (B.I+B.II-A.I-A.II) |
30.352,81 |
|
76.328,00 |
|
B.4.B.9. Gains
from disposal of fixed assets |
|
|
|
|
B.5.Gains from
dealing in own shares |
|
|
|
|
B.6. Paid in
surplus |
3.496,09 |
|
|
|
B.7.
Extraordinary income |
28.334,78 |
2.669,72 |
337,00 |
|
B.8.Other year’s
income and profits |
|
|
|
|
B.IV.NEGATIVE EXTRAORDINARY
LOSSES (A.9+A.10+A.11+A.12+A.13-B.4-B.5-B.6-B.7-B.8) |
|
|
|
|
B.V.LOSS BEFORE
TAXES (B.III+B.IV-A.III-A.IV) |
|
|
75.991,00 |
|
B.VI.EXERCISE
RESULTS (LOSS) (B.V+A.14+A.15) |
|
|
75.991,00 |
Composition of the
Profit and Loss Account
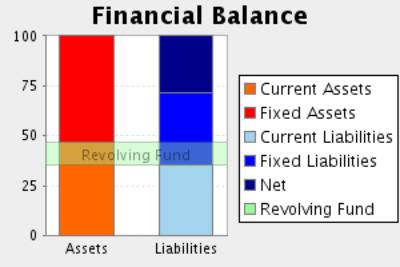
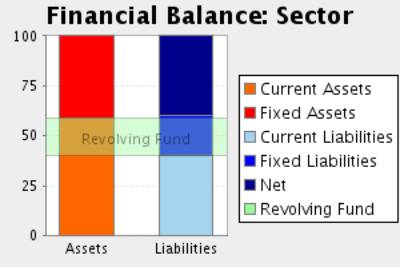
FINANCIAL BALANCE
Here the Main Capital Amounts of the company and the Revolving Fund
Evolution are analysed.
Financial Balance Table
Figures given in €
|
|
31/12/2004 (12) |
% |
31/12/2005 (12) |
% |
31/12/2006 (12) |
% |
|
A) DUE FROM
SHAREHOLDERS FOR UNCALLED CAPITAL |
|
|
|
|
|
|
|
B) FIXED ASSETS |
268.960,21 |
46,28 |
379.896,43 |
56,64 |
402.726,00 |
53,07 |
|
C) DEFERRED
EXPENSES |
|
|
|
|
|
|
|
D) CURRENT
ASSETS |
312.213,65 |
53,72 |
290.852,82 |
43,36 |
356.107,00 |
46,93 |
|
ASSETS (A + B +
C + D) |
581.173,86 |
|
670.749,25 |
|
758.833,00 |
|
|
|
||||||
|
A) SHAREHOLDERS
EQUITY |
106.985,60 |
18,41 |
291.490,41 |
43,46 |
215.499,00 |
28,40 |
|
B) DEFERRED
INCOME |
|
|
|
|
|
|
|
C) PROVISIONS
FOR LIABILITIES AND EXPENSES |
|
|
|
|
|
|
|
D) LONG TERM
LIABILITIES |
24.830,37 |
4,27 |
138.420,42 |
20,64 |
276.921,00 |
36,49 |
|
E) SHORT TERM
LIABILITIES |
449.357,89 |
77,32 |
240.838,42 |
35,91 |
266.413,00 |
35,11 |
|
F) SHORT TERM
PROVISIONS FOR LIABILITIES AND EXPENSES |
|
|
|
|
|
|
|
LIABILITIES (A +
B + C + D + E + F) |
581.173,86 |
|
670.749,25 |
|
758.833,00 |
|
Financial Balance
Composition
Comments on Financial Balance
In the 2004, the assets of the company were formed in 46,28% of Fixed
Assets and in 53,72% of Current Assets.This assets were financed in 18,41% with
own capitals, and in 4,27% with long term debt and in 77,32% with current
liabilities.
The result of this financial structure is a negative turnover fund of
-137.144,24 Euros, which is equivalent to -23,60% proportion of the company’s
total assets.
In the 2005, the assets of the company were formed in 56,64% of Fixed
Assets and in 43,36% of Current Assets.This assets were financed in 43,46% with
own capitals, and in 20,64% with long term debt and in 35,91% with current
liabilities.
The result of this financial structure is a positive turnover fund of
50.014,40 Euros, which is equivalent to 7,46% proportion of the company’s
total assets.
This measure has increased with respect to the previous exercise in
136,47% having also increased its proportion with respect to the total assets
of the company.
In the 2006, the assets of the company were formed in 53,07% of Fixed
Assets and in 46,93% of Current Assets.This assets were financed in 28,40% with
own capitals, and in 36,49% with long term debt and in 35,11% with current
liabilities.
The result of this financial structure is a positive turnover fund of
89.694,00 Euros, which is equivalent to 11,82% proportion of the
company’s total assets.
This measure has increased with respect to the previous exercise in
79,34% having also increased its proportion with respect to the total assets of
the company.
RATIOS
Main Ratios
|
|
31/12/2004 (12) |
31/12/2005 (12) |
31/12/2006 (12) |
|
STRUCTURAL RATIOS |
|
|
|
|
Management fund |
-137.144,24 |
50.014,40 |
89.694,00 |
|
Indebtedness (%) |
81,59 |
56,54 |
71,60 |
|
External Funds on Net Worth |
4,43 |
1,30 |
2,52 |
|
GENERAL ACTIVITY RATIO |
|
|
|
|
Turnover Increase (%) |
-5,09 |
1,57 |
7,67 |
|
Added value growth (%) |
2,28 |
4,33 |
-21,86 |
|
Cash Flow |
1.321,61 |
11.312,75 |
-75.991,00 |
|
Labour Productivity |
0,99 |
1,07 |
0,85 |
|
Assets turnover |
1,26 |
1,10 |
1,05 |
|
Breakdown Point |
741.363,14 |
740.176,67 |
874.159,23 |
|
Security Margin of the Breakdown Point (%) |
-0,67 |
3,63 |
-9,57 |
|
ACTIVITY RATIOS |
|
|
|
|
Average Collection Period |
69 |
52 |
51 |
|
Inventory Turnover Period |
76 |
75 |
76 |
|
SOLVENCY RATIOS |
|
|
|
|
Payback Capacity |
0,00 |
0,03 |
-0,14 |
|
Assets Guarantee |
1,23 |
1,77 |
1,40 |
|
Short Term Debts Proportion (%) |
94,76 |
63,50 |
49,03 |
|
Interest Coverage |
-1,15 |
0,48 |
-3,36 |
|
LIQUIDITY RATIOS |
|
|
|
|
Current Ratio |
0,70 |
1,21 |
1,34 |
|
Immediate liquidity |
0,04 |
0,12 |
0,28 |
|
Sales on Current Assets |
841 |
917 |
807 |
Results Analysis
Ratios
|
|
31/12/2004 (12) |
31/12/2005 (12) |
31/12/2006 (12) |
|
Economic profitability (%) |
-0,64 |
3,07 |
-7,17 |
|
Operating Profitability (%) |
-0,51 |
2,78 |
-6,82 |
|
Equity gearing |
44,03 |
0,37 |
4,94 |
|
Financial profitability (%) |
0,97 |
1,44 |
-35,26 |
|
General Profitability (%) |
0,14 |
0,57 |
-9,52 |
Comments on the
Results Analysis Ratios
The economic profitability in the year2005 achieved a 3,07% positive
level, due to a 2,78% economic margin and to an assets turnover of1,10%.
The economic profitability in the year has passed from a negative level of
-0,64% to its positive current value. This evolution is due to the obtaining of
positive operating profitability of 2,78% in comparison with the previous
negative level of -0,51%. Assets turnover has maintained stable in this period,
with an index of 1,10%.
Financial profitability on 2005 achieved a 1,44%.
The company’s financial structure has limited its profitability with an
indebtedness level of 0,37.
The general profitability on 2005 achieved a 0,57%.
The economic profitability in the year2006The economic profitability in
the year -7,17%, derived from a negative operating profitability of -6,82%.The
assets turnover was 1,05%.
The economic profitability in the year from a positive level of 3,07% to
its current negative level. This evolution is due to the obtaining of a
negative operating profitability of -6,82% in comparison with the current
positive value of 2,78%. Assets turnover has maintained stable in this period,
with an index of 1,05%.
Financial profitability on 2006The economic profitability in the year
-35,26
The company’s financial structure has restrained its financial
profitability with an indebtedness level of 4,94.
The general profitability on 2006The economic profitability in the year
-9,52
SECTORIAL ANÁLYSIS
Large Capital Amounts and Financial Balance
Figures given in %
|
|
COMPANY (2006) |
SECTOR |
DIFFERENCE |
DIFFERENCE RELATIVE |
|
|
|
|
|
|
ASSETS |
|
|
|
|
|
|
|
|
|
|
A) DUE FROM
SHAREHOLDERS FOR UNCALLED CAPITAL |
|
0,06 |
|
|
|
|
|
|
|
|
B) FIXED ASSETS |
53,07 |
40,19 |
12,88 |
32,05 |
|
|
|
|
|
|
C) DEFERRED
EXPENSES |
|
0,74 |
|
|
|
|
|
|
|
|
D) CURRENT
ASSETS |
46,93 |
59,02 |
-12,09 |
-20,48 |
|
|
|
|
|
|
ASSETS (A + B +
C + D) |
100 |
100 |
|
|
|
|
|
|
|
|
|
|
|
|
|
|
|
|
|
|
|
|
COMPANY (2006) |
SECTOR |
DIFFERENCE |
DIFFERENCE RELATIVE |
|
|
|
|
|
|
LIABILITIES |
|
|
|
|
|
|
|
|
|
|
A) SHAREHOLDERS
EQUITY |
28,40 |
38,71 |
-10,31 |
-26,64 |
|
|
|
|
|
|
B) DEFERRED
INCOME |
|
1,27 |
|
|
|
|
|
|
|
|
C) PROVISIONS
FOR LIABILITIES AND EXPENSES |
|
0,05 |
|
|
|
|
|
|
|
|
D) LONG TERM
LIABILITIES |
36,49 |
19,92 |
16,57 |
83,16 |
|
|
|
|
|
|
E) SHORT TERM
LIABILITIES |
35,11 |
40,04 |
-4,93 |
-12,31 |
|
|
|
|
|
|
F) SHORT TERM
PROVISIONS FOR LIABILITIES AND EXPENSES |
|
0,00 |
|
|
|
|
|
|
|
|
LIABILITIES (A +
B + C + D + E + F) |
100 |
100 |
|
|
|
|
|
|
|
Sectorial Financial
Balance Comparison

Comments to the Sectorial Analysis
In the 2006, the assets of the company were formed in 53,07% of fixed
assets and in 46,93Current Assets % In the sector, the proportion of fixed
assets was of 40,98%, 29,49% inferior, and the proportion of current assets was
of 59,02%, 20,48% superior.
The assets were financed in the company in 28,40% with own capitals , in
36,49% with fixed liabilities and in 35,11% with current liabilities In the
sector, the self financing represented 39,99%, 28,98% superior. On the other
hand the long term debts represented in the sector an average of 19,97%
financing, with a relative difference of 82,71% in favour of the companyAnd,
short term liabilities represented in the sector an average of 40,04%
financing, with a relative difference of 12,32% favourable to the sector
The result of this company’s financial structure is a turnover fund that
represents 11,82% of the total assets; in the sector, this same proportion is
18,97%, therefore, we can say that the company’s turnover fund is 37,70%
smaller than the sector one.
Analytical Account of Results
Figures given in %
|
|
COMPANY (2006) |
SECTOR |
DIFFERENCE |
DIFFERENCE RELATIVE |
|
Turnover |
100,00 |
98,53 |
1,47 |
1,49 |
|
Other operating income |
|
1,47 |
|
|
|
Production Value |
100,00 |
100,00 |
0,00 |
0,00 |
|
Operating expenses |
28,76 |
45,04 |
-16,28 |
-36,15 |
|
Other operation expenses |
32,10 |
16,19 |
15,91 |
98,25 |
|
Added value |
39,14 |
38,77 |
0,37 |
0,96 |
|
Labour cost |
45,96 |
30,30 |
15,66 |
51,67 |
|
Gross Economic Result |
-6,82 |
8,47 |
-15,29 |
-180,56 |
|
Assets depreciation |
|
3,41 |
|
|
|
Variation in provision for current assets and bad debt losses |
|
0,17 |
|
|
|
Net Economic Result |
-6,82 |
4,89 |
-11,71 |
-239,41 |
|
Financial income |
0,25 |
0,19 |
0,06 |
29,53 |
|
Financial Charges |
3,00 |
1,75 |
1,25 |
71,62 |
|
Variation in financial investment provision |
|
0,00 |
|
|
|
Ordinary
Activities Result |
-9,57 |
3,34 |
-12,91 |
-386,78 |
|
Extraordinary income |
0,04 |
1,13 |
-1,09 |
-96,45 |
|
Extraordinary charges |
|
0,19 |
|
|
|
Variation in provision in fixed assets |
|
0,00 |
|
|
|
Results before Taxes |
-9,53 |
4,28 |
-13,81 |
-322,82 |
|
Corporate taxes |
|
1,28 |
|
|
|
Net Result |
-9,53 |
3,00 |
-12,52 |
-418,20 |
|
Assets depreciation |
|
3,41 |
|
|
|
Change of Provisions |
|
0,17 |
|
|
|
Net Self-Financing |
-9,53 |
6,57 |
-16,10 |
-245,10 |
Main Ratios
|
|
COMPANY (2006) |
PTILE25 |
PTILE50 |
PTILE75 |
|
STRUCTURAL RATIOS |
|
|
|
|
|
Management fund |
89.694,00 |
2,16 |
52,40 |
177,70 |
|
Indebtedness (%) |
71,60 |
42,76 |
63,57 |
81,41 |
|
External Funds on Net Worth |
2,52 |
0,75 |
1,74 |
4,38 |
|
GENERAL ACTIVITY
RATIO |
|
|
|
|
|
Turnover Increase (%) |
7,67 |
-8,28 |
1,45 |
13,64 |
|
Added value growth (%) |
-21,86 |
-7,26 |
3,44 |
14,80 |
|
Cash Flow |
-75.991,00 |
11,15 |
26,08 |
61,69 |
|
Labour Productivity |
0,85 |
1,12 |
1,26 |
1,47 |
|
Assets turnover |
1,05 |
0,88 |
1,31 |
1,90 |
|
Breakdown Point |
874.159,23 |
218.725,63 |
456.080,22 |
940.214,62 |
|
Security Margin
of the Breakdown Point (%) |
-9,57 |
3,07 |
7,29 |
13,19 |
|
ACTIVITY RATIOS |
|
|
|
|
|
Average Collection Period |
51 |
41 |
80 |
120 |
|
Inventory Turnover Period |
76 |
11 |
34 |
93 |
|
SOLVENCY RATIOS |
|
|
|
|
|
Payback Capacity |
-0,14 |
0,06 |
0,13 |
0,25 |
|
Assets Guarantee |
1,40 |
1,22 |
1,56 |
2,28 |
|
Short Term Debts Proportion (%) |
49,03 |
63,20 |
87,70 |
100,00 |
|
Interest Coverage |
-3,36 |
1,63 |
4,66 |
12,80 |
|
LIQUIDITY RATIOS |
|
|
|
|
|
Current Ratio |
1,34 |
1,02 |
1,39 |
2,25 |
|
Immediate liquidity |
0,28 |
0,05 |
0,18 |
0,58 |
|
Sales on Current Assets |
807 |
505 |
775 |
1.075 |
Results Analysis
Ratios
|
|
COMPANY (2006) |
PTILE25 |
PTILE50 |
PTILE75 |
|
Economic profitability (%) |
-7,17 |
2,20 |
4,94 |
9,72 |
|
Operating Profitability (%) |
-6,82 |
1,81 |
3,93 |
7,11 |
|
Equity gearing |
4,94 |
1,24 |
1,93 |
3,29 |
|
Financial profitability (%) |
-35,26 |
3,17 |
7,93 |
16,86 |
|
General Profitability (%) |
-9,52 |
0,60 |
1,97 |
4,26 |
FOREIGN EXCHANGE
RATES
|
Currency |
Unit
|
Indian Rupees |
|
US Dollar |
1 |
Rs.42.37 |
|
UK Pound |
1 |
Rs.84.00 |
|
Euro |
1 |
Rs.65.96 |
RATING
EXPLANATIONS
|
RATING |
STATUS |
PROPOSED CREDIT LINE |
|
|
>86 |
Aaa |
Possesses an extremely sound financial base with the strongest
capability for timely payment of interest and principal sums |
Unlimited |
|
71-85 |
Aa |
Possesses adequate working capital. No caution needed for credit
transaction. It has above average (strong) capability for payment of interest
and principal sums |
Large |
|
56-70 |
A |
Financial & operational base are regarded healthy. General unfavourable
factors will not cause fatal effect. Satisfactory capability for payment of
interest and principal sums |
Fairly Large |
|
41-55 |
Ba |
Overall operation is considered normal. Capable to meet normal
commitments. |
Satisfactory |
|
26-40 |
B |
Unfavourable & favourable factors carry similar weight in credit
consideration. Capability to overcome financial difficulties seems
comparatively below average. |
Small |
|
11-25 |
Ca |
Adverse factors are apparent. Repayment of interest and principal sums
in default or expected to be in default upon maturity |
Limited with
full security |
|
<10 |
C |
Absolute credit risk exists. Caution needed to be exercised |
Credit not
recommended |
|
NR |
In view of the lack of information, we have no basis upon which to
recommend credit dealings |
No Rating |
|
This score serves as a reference to assess SC’s credit risk
and to set the amount of credit to be extended. It is calculated from a
composite of weighted scores obtained from each of the major sections of this
report. The assessed factors and their relative weights (as indicated through
%) are as follows:
Financial
condition (40%) Ownership
background (20%) Payment
record (10%)
Credit history
(10%) Market trend
(10%) Operational
size (10%)