![]()
MIRA
INFORM REPORT
|
Report Date : |
02.08.2008 |
IDENTIFICATION
DETAILS
|
Name : |
ESMALGLASS SA |
|
|
|
|
Registered Office : |
Carretera CV 20 Onda KM 61 800 12540 Villarreal
Castellón |
|
|
|
|
Country : |
Spain |
|
|
|
|
Financials (as on) : |
31.12.2006 |
|
|
|
|
Date of Incorporation : |
|
|
|
|
|
Legal Form : |
Joint Stock Company |
|
|
|
|
Line of Business : |
RATING &
COMMENTS
|
MIRA’s Rating : |
Ba |
|
RATING |
STATUS |
PROPOSED CREDIT LINE |
|
|
41-55 |
Ba |
Overall operation is considered normal. Capable to meet normal
commitments. |
Satisfactory |
|
Maximum Credit Limit : |
1.128.700,73 € |
|
|
|
|
Status : |
Good |
|
|
|
|
Payment Behaviour : |
Regular |
|
|
|
|
Litigation : |
Clear |
FINANCIAL REPORT
ESMALGLASS SA
TAX NUMBER: A12023719
EXECUTIVE SUMMARY
Identification
Current Business Name: ESMALGLASS SA
Commercial Name: PLAK UP
Other names: YES
Current Address: CARRETERA CV
20 ONDA KM 61 800, CP 12540, VILLARREAL CASTELLÓN
Telephone number: 964626544 Fax: 964531309
URL: www.esmalglass.es Corporate e-mail: general@esmalglass.es
Commercial Risk
Credit Appraisal: 1.128.700,73 €
RAI: NO
Legal Actions: NO
Financial Information
Latest Balance sheet sales (2006): 114.375.266,00 €
(MERCANTILE REGISTER)
Result: 659.916 €
Total Assets: 207.002.796 €
Social Capital: 20.013.000,00 €
Employees: 410
Commercial Information
Constitution Date: 24/05/1978
Business activity: Mfg. of
chemical products
NACE Code: 2466
International Operations: Exports
Corporate Structure
Sole Administrator:
Parent Company:
Participations: 13
Other Complementary Information
Latest proceeding published in BORME: 25/02/2008 Re-elections
Latest press article: 09/10/2006 LEVANTE (BUSINESS
AWARDS INFORMATION)
Bank Entities: Yes
Credit Appraisal
Maximum Credit
(from 0 a
6,000,000 €)
Favourable to 1.128.700,73 €
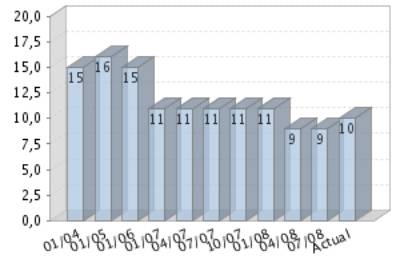
Rating Evolution
Financial Situation
Fiscal year2006
|
Treasury |
Limited |
|
Indebtedness |
Average |
|
Profitability |
Null |
|
Balance |
Degraded |
Performance
|
Legal Actions |
None or Negligible |
|
Business
Trajectory |
Excellent |
RAI 
COMPANY NOT REGISTERED IN THE R.A.I.
This company is not registered in the Disputed Bills register (R.A.I.)
DATE AND TIME OF THE CONSULTATION: 01/08/2008
08:08:27
INCIDENTS

Summary
LEGAL ACTIONS: No legal incidences registered
CLAIM FILED AGAINST THE ADMINISTRATION: No administrative
claims registered
AFFECTED BY:
3 Company / Companies in Insolvency Proceedings.
FINANCIAL ELEMENTS AND SECTORIAL
COMPARATIVE
FINANCIAL ELEMENTS
Figures given in €
|
|
2004 (12) |
2005 (12) |
2006 (12) |
% ASSETS |
|
|
|
|
|
|
BALANCE SHEET ANALYSIS |
|
|
|
|
|
|
|
|
|
|
OWN FUNDS |
25.099.693,00 |
54.068.746,00 |
52.035.435,00 |
25,14 |
|
|
|
|
|
|
DEBT |
154.452.255,00 |
140.134.163,00 |
154.967.361,00 |
74,86 |
|
|
|
|
|
|
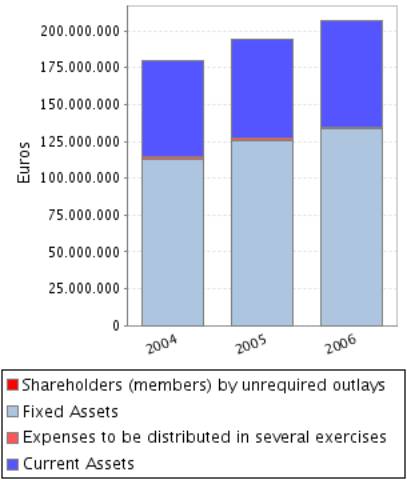
FIXED ASSETS |
112.640.393,00 |
125.874.871,00 |
133.206.604,00 |
64,35 |
|
|
|
|
|
|
TOTAL ASSETS |
179.551.948,00 |
194.202.909,00 |
207.002.796,00 |
|
|
|
|
|
|
|
|
|
|
|
|
|
|
|
|
|
|
|
2004 (12) |
2005 (12) |
2006 (12) |
% SALES |
|
|
|
|
|
|
PROFIT AND LOSS ACCOUNT ANALYSIS |
|
|
|
|
|
|
|
|
|
|
SALES |
99.483.164,00 |
102.932.235,00 |
114.375.266,00 |
|
|
|
|
|
|
|
ADDED VALUE |
35.382.560,00 |
34.925.871,00 |
27.777.954,00 |
24,29 |
|
|
|
|
|
|
EBITDA |
17.439.869,00 |
15.234.922,00 |
7.591.567,00 |
6,64 |
|
|
|
|
|
|
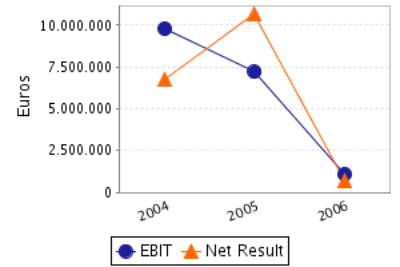
EBIT |
9.786.679,00 |
7.206.930,00 |
1.086.460,00 |
0,95 |
|
|
|
|
|
|
NET RESULT |
6.725.858,00 |
10.654.179,00 |
659.916,00 |
0,58 |
|
|
|
|
|
Balance Sheets Items
Analysis
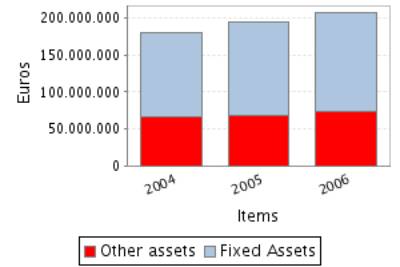
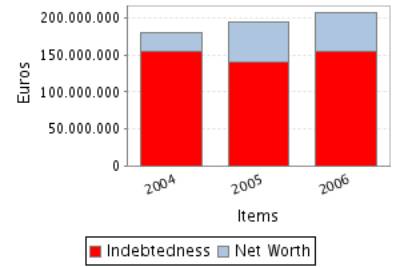
Balance Sheet Comments
Total assets of the company grew 8,16% between 2004 and 2005.
This growth is a consequence of the fixed assets increase of 11,75%.
This growth has been financed with a Shareholders’ equity increase of
115,42% this company’s net increase has also covered the reduction of the
company’s indebtedness of 9,27% of company’s indebtedness.
Total assets of the company grew 6,59% between 2005 and 2006.
This growth has been inferior in the case of the fixed assets that
increased just in 5,82%.
This growth has been financed with an indebtedness increase of
10,58%.Moreover, net worth has been reduced in 3,76%, which explains a part of
the indebtedness increase. .
Profit and Loss Account Analysis
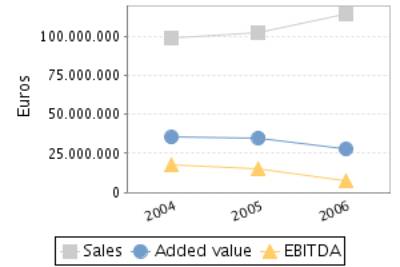
Profit and Loss Account Comments
The company’s sales figure grew 3,47% between 2004 and 2005.
The company’s EBIT decreased in 26,36% between 2004 and 2005.
This evolution implies a reduction in the company’s operating
profitability.
The result of these variations is a decrease of the company’s Economic
Profitability of 31,92% in the analysed period, being this profitability of
3,71% in the year 2005.
The company’s Net Result grew 58,41% between 2004 and 2005.
This evolution, compared to the EBIT’s performance, implies that the
financial and extraordinary activities have had a positive effect in the
company’s Financial Profitability.
The result of these variations is a reduction of the company’s
profitability of 26,46% in the analysed period, being equal to 19,70% in the
year 2005.
The company’s sales figure grew 11,12% between 2005 and 2006.
The company’s EBIT decreased in 84,92% between 2005 and 2006.
This evolution implies a reduction in the company’s operating
profitability.
The result of these variations is a decrease of the company’s Economic
Profitability of 85,86% in the analysed period, being this profitability of
0,52% in the year 2006.
The company’s Net Result decreased in 93,81% between 2005 and 2006.
This evolution, compared to the EBIT’s performance, implies that the
financial and extraordinary activities have had a negative effect in the
company’s Financial Profitability.
The result of these variations is a reduction of the company’s
profitability of 93,56% in the analysed period, being equal to 1,27% in the year
2006.
ANNUAL FINANCIAL REPORT
ADDITIONAL DATA
Source: annual financial report 2006
Results Distribution
Figures given in €
|
DISTRIBUTION
BASE |
DISTRIBUTION TO |
||
|
Profit and Loss |
659.916,00 |
Retained earnings |
65.992,00 |
|
Carry Over |
0,00 |
Voluntary Reserve |
593.924,00 |
|
Voluntary reserves |
0,00 |
Prior years losses |
0,00 |
|
Reserves |
0,00 |
Carry Over |
0,00 |
|
Other concepts |
0,00 |
Other funds |
0,00 |
|
Total of Amounts to be distributed |
659.916,00 |
Dividends |
0,00 |
|
|
|
Other Applications |
0,00 |
Auditing
Auditors’ opinion: FAVOURABLE WITH RESERVATIONS
Auditor: DELOITTE SL
Auditing exceptions:
SEGUN SE INDICA EN LA NOTA 13 DE LA MEMORIA, EN RELACION CON
DETERMINADAS CLAUSULAS ESTABLECIDAS EN EL CONTRATO DE FINANCIACION SINDICABLE
QUE NO SE HABIAN CUMPLIDO EN LA FECHA ESTABLECIDA, LA SOCIEDAD HA SOLICITADO
DEL BANCO AGENTE EL CORRESPONDIENTE WAIVER , EL CUAL ESTA ACORDADO CON DICHO
BANCO Y PENDIENTE DE APROBACION FINAL A LA FECHA DE EMISION DE ESTE INFORME.
COMPARATIVE SECTOR ANALYSIS
Values table
Figures expressed in %
|
|
COMPANY (2006) |
SECTOR |
DIFFERENCE |
DIFFERENCE RELATIVE |
|
|
|
|
|
|
BALANCE SHEET
ANALYSIS: % on the total assets |
|
|
|
|
|
|
|
|
|
|
OWN FUNDS |
25,14 |
40,73 |
-15,59 |
-38,28 |
|
|
|
|
|
|
DEBT |
74,86 |
59,27 |
15,59 |
26,30 |
|
|
|
|
|
|
FIXED ASSETS |
64,35 |
56,98 |
7,37 |
12,93 |
|
|
|
|
|
|
|
|
|
|
|
|
|
|
|
|
|
|
COMPANY (2006) |
SECTOR |
DIFFERENCE |
DIFFERENCE RELATIVE |
|
|
|
|
|
|
PROFIT AND LOSS
ACCOUNT ANALYSIS: % on the total operating income |
|
|
|
|
|
|
|
|
|
|
SALES |
95,87 |
95,34 |
0,54 |
0,57 |
|
|
|
|
|
|
ADDED VALUE |
23,28 |
21,27 |
2,01 |
9,47 |
|
|
|
|
|
|
EBIT |
0,91 |
3,75 |
-2,84 |
-75,71 |
|
|
|
|
|
|
NET RESULT |
0,55 |
3,50 |
-2,94 |
-84,17 |
|
|
|
|
|
Sector Composition
Compared sector (NACE): 246
Number of companies: 27
Size (Sales Figure) : > 40.000.000,00 Euros
Comments on the sectorial comparative
Compared to its sector the assets of the companies show a greater
proportion of fixed assets. Specifically the difference with the sector average
is 7,37% , which means a relative difference of 12,93% .
In liabilities composition the company appeals on a wider scale to self
financing, being the proportion of net worth of 15,59% inferior, which means a
relative difference of 38,28% 15,59% more than the sector, which means a
difference of 26,30% .
The proportion that the sales mean to the company’s total ordinary
income is 95,87%, 0,54% higher than in the sector, which means a relative
difference of 0,57% .
The company’s EBIT was positive and was 0,91% with regard to the total
ordinary income, 2,84% less than the sector, which means a relative difference
of 75,71% .
The company’s capacity to generate operating income is equal to that of
the sector as its ratio EBIT/Sales is also equal.
The company’s net result was positive and equal to 0,55% with regard to the
total ordinary income, 2,94% less than the sector, which means a relative
difference of 84,17% .
The financial and extraordinary results and the tax impact have had a
negative impact on the Net result in the company with a worse behaviour than in
the sector; as a consequence, the company shows a worse Net Result/EBIT ratio
(REBEmpresa vs. REBSector).
ADDRESSES
Current Legal Seat Address:
CARRETERA CV 20 ONDA KM 61 800
12540
VILLARREAL CASTELLÓN
Characteristics of the current address
Type of premises: office, factory, warehouse
Local description: Domicilio Social Los terrenos ocupan 21.000 m2
Property: owned; with no official confirmation
Local Situation: main
CORPORATE STRUCTURE
ADMINISTRATIVE LINKS
Main Board members, Directors and Auditor ![]()
|
POSITION |
SURNAMES AND
NAME |
APPOINTMENT DATE |
|
|
SOLE ADMINISTRATOR |
GOROMAR XXI SL |
27/10/2004 |
|
|
AUDITOR |
APPOINTMENT DATE |
||
|
DELOITTE SL |
25/02/2008 |
||
Functional Managers
|
POSITION |
SURNAMES AND
NAME |
|
Exports Manager |
COBO HERNANDEZ FRANCISCA |
FINANCIAL LINKS
|
|
BUSINESS NAME |
CIF / COUNTRY |
% |
SOURCE |
DATA INF. |
|
|
GOROMAR XXI S.L. |
B83444661 |
100,00 |
TRADE REG. |
31/12/2006 |
Participations 
|
|
BUSINESS NAME |
CIF / COUNTRY |
% |
SOURCE |
DATA INF. |
|
|
ITACA KUNSHAN CERAMIC TECHNOLOGY CO. LTD. |
CHINA |
100,00 |
TRADE REG. |
31/12/2006 |
|
|
ESMALGLASS SPA |
ITALY |
100,00 |
TRADE REG. |
31/12/2006 |
|
|
ESMALGLASS PARTICIPACIONES INDUSTRIALES SOCIEDAD DE RESPONSABILIDAD
LIMITADA. |
B12656351 |
100,00 |
TRADE REG. |
31/12/2006 |
|
|
ESMALGLASS DO BRASIL |
BRAZIL |
100,00 |
TRADE REG. |
31/12/2006 |
|
|
ESMALGLASS U.K. |
UNITED KINGDOM |
100,00 |
TRADE REG. |
31/12/2006 |
|
|
ESMALGLASS PORTUGAL PRODUCTOS CERAMICOS SA |
PORTUGAL |
99,95 |
TRADE REG. |
31/12/2006 |
You can obtain business information of a foreign companies at the
pageD&B INTERNATIONAL
CREDIT INFORMATION
Constitution Date: 24/05/1978
Business activity 
Activity: Mfg. of chemical products
NACE Code: 2466
NACE Activity: Manufacture of other chemical products n.e.c.
Business: FINANCIACION, EXPLOTACION Y PARTICIPACION EN TODO
LO RELACIONADO CON LA FABRICACION, INVESTIGACION, COMERCIO, EXPORTACION E
IMPORTACION DE ESMALTES PARA LA INDUSTRIA CERAMICA EN GENERAL, ASI COMO DE SUS
MATERIAS PRIMAS N
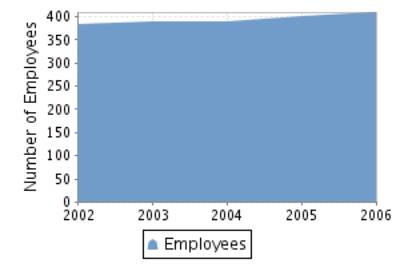
Employees 
Number of total employees: 410 (2006)
Number of fixed employees: 92,20%
Number of temporary employees: 7,80%
Employees evolution
SUPPLIERS
|
BUSINESS NAME |
INTERNATIONAL |
|
MIDSOUTH
CERAMICS INC |
YES |
|
ESMALGLASS
PORTUGAL PRODUCTOS CERAMICOS SA |
YES |
|
INNOVACIONES
TECNICAS APLICADAS A CERAMICAS AVANZADAS SAU |
NO |
|
ESMALGLASS SPA |
YES |
|
PT ESMALGLASS
INDONESIA |
YES |
|
ITACA KUNSHAN
CERAMIC TECHNOLOGY CO LTD |
YES |
|
ESMALGLASS UK
LTD |
YES |
7 proveedores
SALES
Collection (estimated):
On a credit basis: 100%
Export Percentage: 61%
Exports to: Brasil, Italia, Argentina, Egipto, Alemania,
Portugal, Inglaterra, Taiwan, EEUU, Argelia, Francia, Finlandia, Indonesia,
Malasia
National Distribution: 39%
CLIENTS
|
BUSINESS NAME |
INTERNATIONAL |
|
INNOVACIONES
TECNICAS APLICADAS A CERAMICAS AVANZADAS SAU |
NO |
|
ESMALGLASS
MEXICO SA DE CV |
YES |
|
MIDSOUTH
CERAMICS INC |
YES |
|
GOROMAR XXI SL |
NO |
|
ESMALGLASS DO
BRASIL FRITAS ESMALTES E CORANTES LTDA |
YES |
|
ESMALGLASS
PORTUGAL PRODUCTOS CERAMICOS SA |
YES |
|
ITACA KUNSHAN
CERAMIC TECHNOLOGY CO LTD |
YES |
|
ESMALGLASS SPA |
YES |
|
ESMALGLASS UK
LTD |
YES |
|
PT ESMALGLASS
INDONESIA |
YES |
11 clientes
Banks 
|
ENTITY |
BRANCH |
ADDRESS |
TOWN OR CITY |
PROVINCE |
|
BANCO DE SABADELL, S.A. |
|
|
|
|
|
BANKINTER, S.A. |
|
|
|
|
2 bank entities registered
Brands, Signs and Commercial
Names 
Brand name: ESMALGLASS (Valid)
Type: JOINT Date: 03/08/2005
Brand name: E (Valid)
Type: JOINT Date: 05/07/2002
Brand name: PLAK UP (Valid)
Type: JOINT Date: 18/04/2002
Brand name: CERAMIKGLASS (Valid)
Type: DENOMINATIVE Date: 16/10/2001
Brand name: CERAMICGLASS (Valid)
Type: DENOMINATIVE Date: 16/10/2001
LEGAL STRUCTURE
Constitution Data
Register Date: 24/05/1978
Current Legal Form: JOINT STOCK
COMPANY
Current Capital:
20.013.000,00 €
Legal Aspects
Obligation to fill in Financial Statements: YES
Chamber census: YES (2006)
Listed on a Stock Exchange: NO
B.O.R.M.E.(Official Companies
Registry Gazette) 
Registered Proceedings
|
PROCEEDINGS |
DATE |
NOTICE NUM. |
TRADE REG. |
|
Re-elections |
25/02/2008 |
102022 |
Castellón |
|
Appointments |
14/02/2007 |
88062 |
Castellón |
|
Re-elections |
07/02/2007 |
70540 |
Castellón |
Other Proceedings published
|
PROCEEDINGS |
DATE |
NOTICE NUM. |
TRADE REG. |
|
Registration of accounts (2006) Individual |
14/01/2008 |
23324 |
Castellón |
|
Registration of accounts (2005) Individual |
31/01/2007 |
99114 |
Castellón |
Press articles

09/10/2006 LEVANTE (BUSINESS AWARDS INFORMATION)
LA EMPRESA ESMALGLASS HA SIDO GALARDONADA CON EL GALARDON A LA
EXCELENCIA EMPRESARIAL EN LA PREVENCION DE RIESGOS LABORALES QUE OTORGA LA
UNION DE MUTUAS Y LA ASOCIACION DE JOVENES EMPRESARIOS DE LA COMUNIDAD
VALENCIANA (AJE)
26/07/2005 CINCO DIAS (GENERAL INFORMATION)
ESMALGLASS FUE FUNDADA CON EL APOYO DE PORCELANOSA, CIA. QUE VENDIO
RECIENTEMENTE A 3I SU PARTICIPACION. ESTE FONDO CONTROLA ACTUALMENTE EL 43,7%
DE LA FIRMA, ENCONTRANDOSE EL RESTO EN MANOS DE LOS DIRECTIVOS, ENTRE ELLOS,
JUAN CARLOS BAIGORRI. EN 2005 ESMALGLASS ESPERA PRODUCIR 250.000 TONELADAS DE
FRITAS Y ESMALTES, CON UNA FACTURACION DE 200 MM. EL 65% DE LA PRODUCCION SE
DESTINA AL MERCADO EXTERIOR. LA EMPRESA CUENTA CON 3 CENTROS PRODUCTIVOS Y
VARIAS PLANTAS DE DISTRIBUCION EN ESPAÑA, ITALIA, REINO UNIDO, PORTUGAL,
BRASIL, MEXICO, EEUU, INDONESIA Y CHINA.
FINANCIAL INFORMATION
The information on the last account contained in this report is
extracted from the Mercantile Register file of the legal address of the Company
and dated 16/01/2008.
BALANCE SHEET
Assets
Figures given in €
|
|
31/12/2004 (12) |
31/12/2005 (12) |
31/12/2006 (12) |
|
A) DUE FROM SHAREHOLDERS FOR UNCALLED CAPITAL |
|
|
|
|
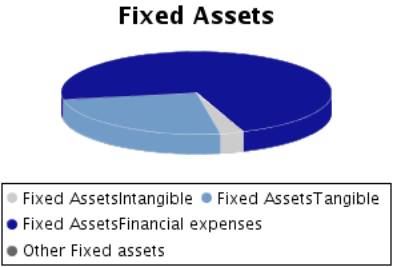
B) FIXED ASSETS |
112.640.393,00 |
125.874.871,00 |
133.206.604,00 |
|
I. Incorporation costs |
|
177.455,00 |
141.964,00 |
|
II. Intangible fixed assets |
709.964,00 |
1.697.187,00 |
3.605.487,00 |
|
R & D expenses |
1.580.658,00 |
|
|
|
Concessions, patents, licences , trademarks |
|
844.002,00 |
1.983.708,00 |
|
Goodwill |
|
|
|
|
Acquired rights from finance leases |
|
|
|
|
Software |
|
650.115,00 |
651.901,00 |
|
Leasing |
|
756.252,00 |
2.076.473,00 |
|
Cash advance |
|
433.071,00 |
|
|
Provisions |
|
|
|
|
Depreciation |
-870.694,00 |
-986.253,00 |
-1.106.595,00 |
|
III. Tangible fixed assets |
39.110.870,00 |
35.790.984,00 |
33.400.902,00 |
|
Property, plant and equipment |
30.215.584,00 |
30.246.059,00 |
31.048.597,00 |
|
Machinery, equipment and other |
46.417.760,00 |
47.442.544,00 |
48.892.281,00 |
|
Other property plant and equipment |
9.604.912,00 |
10.129.113,00 |
10.416.440,00 |
|
Prepaid expenses on fixed assets |
789.560,00 |
1.036.277,00 |
582.768,00 |
|
Other assets |
1.827.486,00 |
1.979.973,00 |
2.070.883,00 |
|
Provisions |
|
|
|
|
Depreciation |
-49.744.432,00 |
-55.042.982,00 |
-59.610.067,00 |
|
IV. Financial fixed assets |
72.819.559,00 |
88.209.245,00 |
96.058.251,00 |
|
Shares in affiliated companies |
82.317.235,00 |
95.181.868,00 |
99.266.693,00 |
|
Receivables in affiliated companies |
|
1.392.799,00 |
6.123.435,00 |
|
Shares in associated companies |
256.986,00 |
256.986,00 |
255.430,00 |
|
Loans to associated companies |
561.264,00 |
|
|
|
Securities |
73.013,00 |
141.323,00 |
214.203,00 |
|
Other loans |
613.152,00 |
4.466.735,00 |
5.512.146,00 |
|
Long term deposits and guarantees |
9.825,00 |
9.825,00 |
9.825,00 |
|
Provisions |
-11.011.916,00 |
-13.240.291,00 |
-15.323.481,00 |
|
Taxes receivable |
|
|
|
|
V.Owners equity |
|
|
|
|
VI.Long term trade liabilities |
|
|
|
|
C) DEFERRED EXPENSES |
2.106.912,00 |
1.093.843,00 |
1.758.119,00 |
|
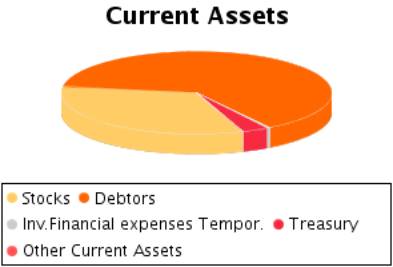
D) CURRENT ASSETS |
64.804.643,00 |
67.234.195,00 |
72.038.073,00 |
|
I. Shareholders by required outlays |
|
|
|
|
II. Stocks |
15.997.207,00 |
17.986.991,00 |
23.712.582,00 |
|
Goods available for sale |
15.997.207,00 |
11.102,00 |
33.314,00 |
|
Raw material inventory |
|
3.001.298,00 |
7.021.018,00 |
|
Work in Progress |
|
12.559.227,00 |
|
|
Finished goods |
|
|
15.659.439,00 |
|
Subproducts and recycled materials |
|
2.769.684,00 |
1.193.251,00 |
|
Cash advance |
|
|
|
|
Provisions |
|
-354.320,00 |
-194.440,00 |
|
III. Debtors |
46.887.939,00 |
48.570.425,00 |
45.744.322,00 |
|
Clients |
|
32.091.795,00 |
45.744.322,00 |
|
Amounts owned by affiliated companies |
|
17.292.963,00 |
|
|
Amounts owned by associated companies |
|
|
|
|
Other debts |
46.887.939,00 |
4.158,00 |
|
|
Staff Expenses |
|
|
|
|
Government |
|
628.696,00 |
|
|
Provisions |
|
-1.447.187,00 |
|
|
IV. Temporary financial investment |
879.775,00 |
296.327,00 |
286.588,00 |
|
Shares in affiliated companies |
|
|
|
|
Receivables in affiliated companies |
|
|
|
|
Shares in associated companies |
|
|
|
|
Loans to associated companies |
|
|
|
|
Short term investment |
|
271.412,00 |
271.657,00 |
|
Other loans |
879.775,00 |
24.915,00 |
14.931,00 |
|
Short Term Deposit and guarantees |
|
|
|
|
Provisions |
|
|
|
|
V. Short-term own shares |
|
|
|
|
VI. Treasury |
837.924,00 |
208.070,00 |
2.241.737,00 |
|
VII. Periodification adjustments |
201.798,00 |
172.382,00 |
52.844,00 |
|
ASSETS (A + B + C + D) |
179.551.948,00 |
194.202.909,00 |
207.002.796,00 |
Assets composition
Liabilities
Figures given in €
|
|
31/12/2004 (12) |
31/12/2005 (12) |
31/12/2006 (12) |
|
A) SHAREHOLDERS EQUITY |
24.635.444,00 |
52.823.623,00 |
51.216.567,00 |
|
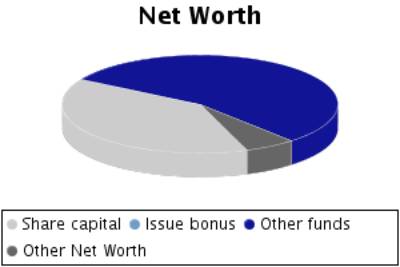
I. Share capital |
2.479.000,00 |
20.013.000,00 |
20.013.000,00 |
|
II. Issue bonus |
|
|
|
|
III.Revaluation reserve |
2.429.285,00 |
2.429.285,00 |
2.429.285,00 |
|
IV.Reserves |
13.001.301,00 |
19.727.159,00 |
28.114.366,00 |
|
Retained earnings |
550.600,00 |
550.600,00 |
1.616.018,00 |
|
Sinking fund from owner equity |
|
|
|
|
Reserve for the parent company capital |
|
274.000,00 |
|
|
Statutory reserve |
|
|
|
|
Other funds |
12.176.701,00 |
18.902.559,00 |
26.498.348,00 |
|
Capital adjustments in Euros |
274.000,00 |
|
|
|
V.Results from previous years |
|
|
|
|
Carry Over |
|
|
|
|
Prior years losses |
|
|
|
|
Loans from partners for losses compensation |
|
|
|
|
VI.Profit and Losses |
6.725.858,00 |
10.654.179,00 |
659.916,00 |
|
VII.Dividend paid during the year |
|
|
|
|
VIII.Own shares for capital reduction |
|
|
|
|
B) DEFERRED INCOME |
464.249,00 |
1.245.123,00 |
818.868,00 |
|
Capital grants |
|
407.919,00 |
352.898,00 |
|
Positive change difference |
|
|
|
|
Other deferred income |
464.249,00 |
837.204,00 |
465.970,00 |
|
Fiscal deferred income |
|
|
|
|
C) PROVISIONS FOR LIABILITIES AND EXPENSES |
8.262.590,00 |
4.944.420,00 |
7.046.418,00 |
|
Provision for pensions plans |
|
|
|
|
Provision for taxes |
6.817.928,00 |
4.944.420,00 |
4.257.793,00 |
|
Other provisions |
1.444.662,00 |
|
2.788.625,00 |
|
Reversion fund |
|
|
|
|
D) LONG TERM LIABILITIES |
94.284.160,00 |
58.848.198,00 |
58.960.975,00 |
|
I.Negotiable bonds and other negotiable values |
|
|
|
|
Non convertible securities |
|
|
|
|
Convertible securities |
|
|
|
|
Other convertible debentures |
|
|
|
|
II.Debt with bank entities |
78.470.000,00 |
56.233.857,00 |
49.000.000,00 |
|
Long term bank loans |
78.470.000,00 |
56.233.857,00 |
49.000.000,00 |
|
Leasing |
|
|
|
|
III.Debts with associated and affiliated
companies |
9.135.152,00 |
|
7.844.322,00 |
|
With affiliated companies |
9.135.152,00 |
|
7.844.322,00 |
|
Associated companies |
|
|
|
|
IV. Other creditors |
6.678.828,00 |
2.614.161,00 |
2.116.473,00 |
|
Bills payable |
|
|
|
|
Other debts |
6.678.828,00 |
2.614.161,00 |
2.116.473,00 |
|
Long term deposit and guaranties |
|
|
|
|
Taxes receivable |
|
|
|
|
V. Deferred debts on shares |
180,00 |
180,00 |
180,00 |
|
From affiliated companies |
180,00 |
180,00 |
|
|
From associated companies |
|
|
|
|
Other companies |
|
|
180,00 |
|
VI. Long term debt with creditor |
|
|
|
|
E) SHORT TERM LIABILITIES |
51.905.505,00 |
76.341.545,00 |
88.959.968,00 |
|
I.Negotiable bonds and other negotiable values |
|
|
|
|
Non convertible securities |
|
|
|
|
Convertible securities |
|
|
|
|
Other convertible debentures |
|
|
|
|
Interests from bonds |
|
|
|
|
II.Debt with bank entities |
20.943.797,00 |
32.311.915,00 |
39.348.041,00 |
|
Loans and other debts |
|
32.311.915,00 |
39.335.933,00 |
|
Debt interest |
20.943.797,00 |
|
12.108,00 |
|
Leasing |
|
|
|
|
III. Short term debts with associated and
affiliated companies |
4.118.586,00 |
10.869.026,00 |
10.941.108,00 |
|
With affiliated companies |
4.118.586,00 |
10.869.026,00 |
10.941.108,00 |
|
Associated companies |
|
|
|
|
IV. Commercial creditors |
19.031.759,00 |
25.375.226,00 |
35.360.822,00 |
|
Accounts payable |
19.031.759,00 |
|
|
|
Expenses |
|
25.375.226,00 |
35.360.822,00 |
|
Bills payable |
|
|
|
|
V. Other non-commercial debt |
7.811.363,00 |
7.785.378,00 |
3.309.997,00 |
|
Government |
1.595.857,00 |
1.560.231,00 |
1.298.053,00 |
|
Bills payable |
746.179,00 |
|
|
|
Other debts |
5.469.327,00 |
5.422.876,00 |
1.169.692,00 |
|
Accounts receivable |
|
802.271,00 |
842.252,00 |
|
Short term deposits and guarantees |
|
|
|
|
VI. Provisions for current assets |
|
|
|
|
VII. Periodification adjustments |
|
|
|
|
F) SHORT TERM PROVISIONS FOR LIABILITIES AND
EXPENSES |
|
|
|
|
LIABILITIES (A + B + C + D + E + F) |
179.551.948,00 |
194.202.909,00 |
207.002.796,00 |
Liabilities
Composition
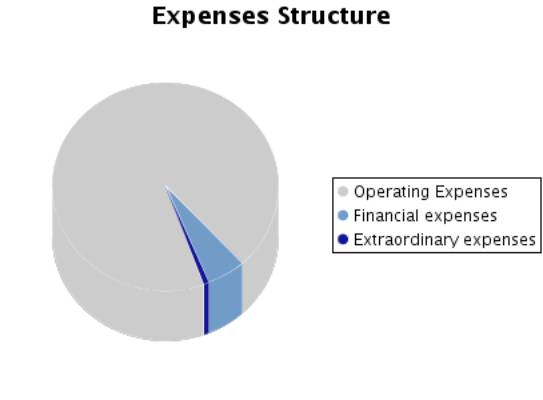
PROFIT AND LOSS ACCOUNT
Itams of the Profit and Loss Account
Figures given in €
|
|
31/12/2004 (12) |
31/12/2005 (12) |
31/12/2006 (12) |
|
A) EXPENSES (A.1 a A.16) |
100.435.324,00 |
110.777.938,00 |
129.219.418,00 |
|
A.1.Reduction in stocks of finished goods and
work in progress |
|
|
|
|
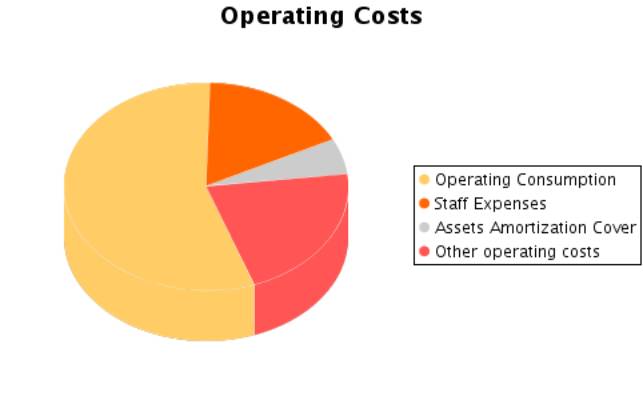
A.2.Supplies |
49.615.417,00 |
56.379.306,00 |
69.599.762,00 |
|
Material consumed |
49.615.417,00 |
|
|
|
Raw materials consumed |
|
52.187.913,00 |
69.440.124,00 |
|
Other expenses |
|
4.191.393,00 |
159.638,00 |
|
A.3. Labour cost |
17.942.691,00 |
19.690.949,00 |
20.186.387,00 |
|
Wages |
17.942.691,00 |
16.355.423,00 |
16.178.179,00 |
|
Social security expenses |
|
3.335.526,00 |
4.008.208,00 |
|
A.4. Assets depreciation |
7.605.723,00 |
7.424.826,00 |
6.524.708,00 |
|
A.5.Variance in the traffic provisions |
47.467,00 |
603.166,00 |
-19.601,00 |
|
Variance in provision for inventory |
47.467,00 |
603.166,00 |
|
|
Variance in provision for bad debts |
|
|
-19.601,00 |
|
Variance in provision for other current assets |
|
|
|
|
A.6. Other operating costs |
18.341.485,00 |
19.323.752,00 |
25.325.566,00 |
|
External costs |
|
19.323.752,00 |
24.822.123,00 |
|
Taxes |
|
|
437.448,00 |
|
Other day to day expenses |
18.341.485,00 |
|
65.995,00 |
|
Allowance to reversion fund |
|
|
|
|
A.I.OPERATING RESULT
(B.1+B.2+B.3+B.4-A.1-A.2-A.3-A.4-A.5-A.6) |
9.786.679,00 |
7.206.930,00 |
1.086.460,00 |
|
A.7.Financial expenses and similar |
5.732.475,00 |
5.532.818,00 |
5.763.986,00 |
|
Debts with related companies |
5.732.475,00 |
|
|
|
Debts with associated companies |
|
|
|
|
Other companies debts By debts with third parties and similar expenses |
|
5.532.818,00 |
5.763.986,00 |
|
Losses from financial investments |
|
|
|
|
A.8. Variation in financial investment provision |
131.264,00 |
556.264,00 |
|
|
A.9.Negative exchange difference |
426.443,00 |
106.582,00 |
1.319.398,00 |
|
A.II.POSITIVE FINANCIAL RESULTS
(B.5+B.6+B.7+B.8-A.7-A.8-A.9) |
|
2.086.540,00 |
|
|
A.III.PROFIT FROM ORDINARY ACTIVITIES
(A.I+A.II-B.I-B.II) |
7.106.361,00 |
9.293.470,00 |
|
|
A.10. Variation
in provision in fixed assets |
1.004.507,00 |
2.359.639,00 |
3.427.906,00 |
|
A.11. Losses in
fixed assets |
623,00 |
|
180.710,00 |
|
A.12. Losses
from own shares and bonds |
|
|
|
|
A.13.
Extraordinary charges |
1.909.176,00 |
352.512,00 |
594.645,00 |
|
A.14.Other
exercises’ expenses and losses |
66.061,00 |
62.251,00 |
160.958,00 |
|
A.IV.POSITIVE
EXTRAORDINARY RESULT (B.9+B.10+B.11+B.12+B.13-A.10-A.11-A.12-A.13-A.14) |
|
|
|
|
A.V.PROFIT
BEFORE TAXES (A.III+A.IV-B.III-B.IV) |
4.337.850,00 |
9.040.052,00 |
|
|
A.15.Corporate
Taxes |
-2.388.008,00 |
-1.614.127,00 |
-3.845.007,00 |
|
A.16. Other taxes |
|
|
|
|
A.VI.EXERCISE
RESULT (PROFIT) (A.V-A.14-A.15) |
6.725.858,00 |
10.654.179,00 |
659.916,00 |
|
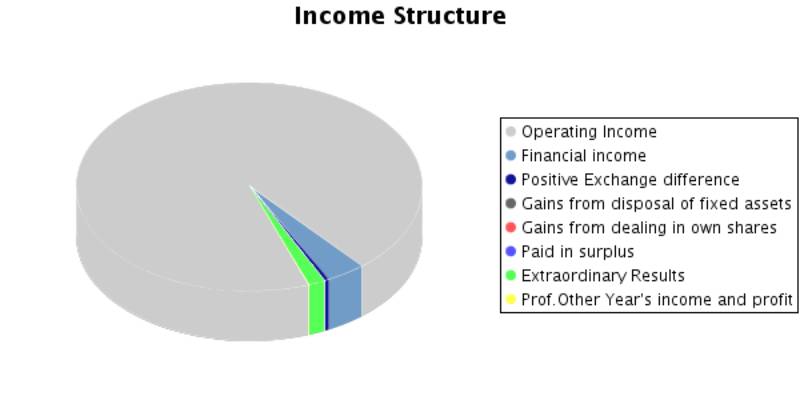
B) INCOMES (B.1 a B13) |
107.161.182,00 |
121.432.117,00 |
129.879.334,00 |
|
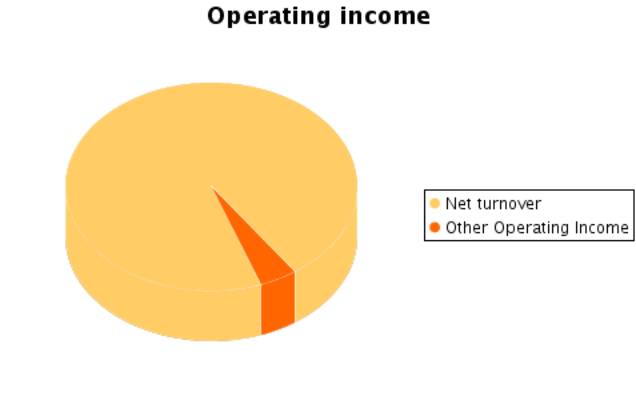
B.1. Turnover |
99.483.164,00 |
102.932.235,00 |
114.375.266,00 |
|
Sales |
99.483.164,00 |
102.932.235,00 |
114.375.266,00 |
|
Services provided |
|
|
|
|
Refunds and sale reminders |
|
|
|
|
B.2.Increase in inventory of finished goods and
works in progress |
179.229,00 |
2.490.189,00 |
3.405.361,00 |
|
B.3.Expenses capitalized |
1.999.108,00 |
2.241.419,00 |
2.425.471,00 |
|
B.4. Other operating income |
1.677.961,00 |
2.965.086,00 |
2.497.184,00 |
|
Other incomes |
1.677.961,00 |
2.965.086,00 |
2.250.791,00 |
|
Grants |
|
|
246.393,00 |
|
Excess in provision for liabilities and charges |
|
|
|
|
B.I.OPERATING
LOSSES (A.1+A.2+A.3+A.4+A.5+A.6-B.1-B.2-B.3-B.4) |
|
|
|
|
B.5.Incomes from share participations |
2.871.615,00 |
7.613.534,00 |
4.401.685,00 |
|
From affiliated companies |
2.871.615,00 |
7.613.534,00 |
4.401.685,00 |
|
From associated companies |
|
|
|
|
From other companies |
|
|
|
|
B.6.Income from other securities and credits to
fixed assets |
|
|
|
|
From affiliated companies |
|
|
|
|
From associated companies |
|
|
|
|
Other companies |
|
|
|
|
B.7.Other interests and similar |
291.457,00 |
306.864,00 |
155.051,00 |
|
From affiliated companies |
291.457,00 |
|
|
|
From associated companies |
|
|
|
|
Other Interests |
|
175.600,00 |
155.051,00 |
|
Profits from investments |
|
131.264,00 |
|
|
B.8. Positive change difference |
446.792,00 |
361.806,00 |
579.984,00 |
|
B.II. NEGATIVE FINANCIAL RESULTS
(A.7+A.8+A.9-B.5-B.6-B.7-B.8) |
2.680.318,00 |
|
1.946.664,00 |
|
B.III.LOSSES FROM ORDINARY ACTIVITIES
(B.I+B.II-A.I-A.II) |
|
|
860.204,00 |
|
B.9.B.9. Gains from disposal of fixed assets |
104.219,00 |
|
6.111,00 |
|
B.10.Gains from dealing in own shares |
|
|
|
|
B.11. Paid in surplus |
56.329,00 |
56.330,00 |
55.021,00 |
|
B.12. Extraordinary income |
9.456,00 |
2.464.654,00 |
1.900.556,00 |
|
B.13.Other year’s income and profits |
41.852,00 |
|
77.644,00 |
|
B.IV.NEGATIVE EXTRAORDINARY LOSSES
(A.10+A.11+A.12+A.13+A.14-B.9-B.10-B.11-B.12-B.13) |
2.768.511,00 |
253.418,00 |
2.324.887,00 |
|
B.V.LOSS BEFORE TAXES (B.III+B.IV-A.III-A.IV) |
|
|
3.185.091,00 |
|
B.VI.EXERCISE RESULTS (LOSS) (B.V+A.14+A.15) |
|
|
|
Composition of the
Profit and Loss Account
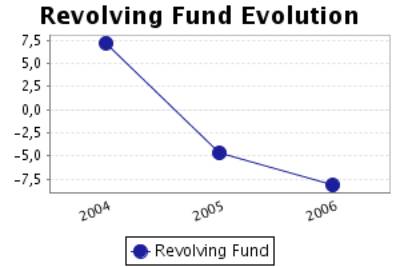
FINANCIAL BALANCE
Here the Main Capital Amounts of the company and the Revolving Fund
Evolution are analysed.
Financial Balance Table
Figures given in €
|
|
31/12/2004 (12) |
% |
31/12/2005 (12) |
% |
31/12/2006 (12) |
% |
|
A) DUE FROM
SHAREHOLDERS FOR UNCALLED CAPITAL |
|
|
|
|
|
|
|
B) FIXED ASSETS |
112.640.393,00 |
62,73 |
125.874.871,00 |
64,82 |
133.206.604,00 |
64,35 |
|
C) DEFERRED
EXPENSES |
2.106.912,00 |
1,17 |
1.093.843,00 |
0,56 |
1.758.119,00 |
0,85 |
|
D) CURRENT
ASSETS |
64.804.643,00 |
36,09 |
67.234.195,00 |
34,62 |
72.038.073,00 |
34,80 |
|
ASSETS (A + B +
C + D) |
179.551.948,00 |
|
194.202.909,00 |
|
207.002.796,00 |
|
|
|
||||||
|
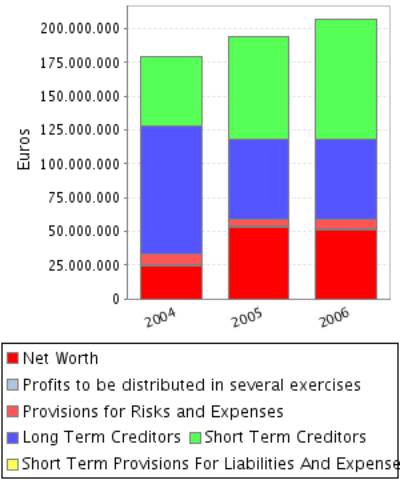
A) SHAREHOLDERS
EQUITY |
24.635.444,00 |
13,72 |
52.823.623,00 |
27,20 |
51.216.567,00 |
24,74 |
|
B) DEFERRED INCOME |
464.249,00 |
0,26 |
1.245.123,00 |
0,64 |
818.868,00 |
0,40 |
|
C) PROVISIONS
FOR LIABILITIES AND EXPENSES |
8.262.590,00 |
4,60 |
4.944.420,00 |
2,55 |
7.046.418,00 |
3,40 |
|
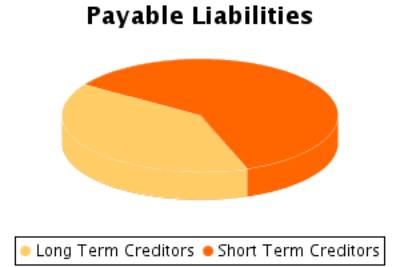
D) LONG TERM
LIABILITIES |
94.284.160,00 |
52,51 |
58.848.198,00 |
30,30 |
58.960.975,00 |
28,48 |
|
E) SHORT TERM
LIABILITIES |
51.905.505,00 |
28,91 |
76.341.545,00 |
39,31 |
88.959.968,00 |
42,98 |
|
F) SHORT TERM
PROVISIONS FOR LIABILITIES AND EXPENSES |
|
|
|
|
|
|
|
LIABILITIES (A +
B + C + D + E + F) |
179.551.948,00 |
|
194.202.909,00 |
|
207.002.796,00 |
|
Financial Balance
Composition
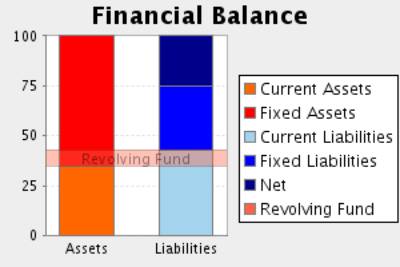
Comments on Financial Balance
In the 2004, the assets of the company were formed in 63,91% of Fixed
Assets and in 36,09% of Current Assets.This assets were financed in 13,98% with
own capitals, and in 57,11% with long term debt and in 28,91% with current
liabilities.
The result of this financial structure is a positive turnover fund of
12.899.138,00 Euros, which is equivalent to 7,18% proportion of the
company’s total assets.
In the 2005, the assets of the company were formed in 65,38% of Fixed
Assets and in 34,62% of Current Assets.This assets were financed in 27,84% with
own capitals, and in 32,85% with long term debt and in 39,31% with current
liabilities.
The result of this financial structure is a negative turnover fund of -9.107.350,00
Euros, which is equivalent to -4,69% proportion of the company’s total assets.
This measure has diminished with respect to the previous exercise in
170,60% having also diminished its proportion with respect to the total assets
of the company.
In the 2006, the assets of the company were formed in 65,20% of Fixed
Assets and in 34,80% of Current Assets.This assets were financed in 25,14% with
own capitals, and in 31,89% with long term debt and in 42,98% with current
liabilities.
The result of this financial structure is a negative turnover fund of
-16.921.895,00 Euros, which is equivalent to -8,17% proportion of the company’s
total assets.
This measure has diminished with respect to the previous exercise in
85,80% having also diminished its proportion with respect to the total assets
of the company.
RATIOS
Main Ratios
|
|
31/12/2004 (12) |
31/12/2005 (12) |
31/12/2006 (12) |
|
STRUCTURAL RATIOS |
|
|
|
|
Management fund |
12.899.138,00 |
-9.107.350,00 |
-16.921.895,00 |
|
Management Fund Requirement |
32.125.236,00 |
22.700.168,00 |
19.897.821,00 |
|
Indebtedness (%) |
86,02 |
72,16 |
74,86 |
|
External Funds on Net Worth |
6,15 |
2,59 |
2,98 |
|
GENERAL ACTIVITY RATIO |
|
|
|
|
Turnover Increase (%) |
6,57 |
3,47 |
11,12 |
|
Added value growth (%) |
-5,63 |
-1,29 |
-20,47 |
|
Cash Flow |
15.514.819,00 |
21.598.074,00 |
10.592.929,00 |
|
Labour Productivity |
1,97 |
1,77 |
1,38 |
|
Assets turnover |
0,55 |
0,53 |
0,55 |
|
Breakdown Point |
84.367.975,53 |
93.772.772,34 |
116.857.170,95 |
|
Security Margin of the Breakdown Point (%) |
18,22 |
13,28 |
2,05 |
|
ACTIVITY RATIOS |
|
|
|
|
Average Payment Period |
139 |
170 |
192 |
|
Average Collection Period |
170 |
170 |
144 |
|
Inventory Turnover Period |
58 |
63 |
75 |
|
SOLVENCY RATIOS |
|
|
|
|
Payback Capacity |
0,10 |
0,15 |
0,07 |
|
Assets Guarantee |
1,15 |
1,38 |
1,32 |
|
Short Term Debts Proportion (%) |
33,61 |
54,48 |
57,41 |
|
Interest Coverage |
1,81 |
0,97 |
-0,59 |
|
LIQUIDITY RATIOS |
|
|
|
|
Current Ratio |
1,25 |
0,88 |
0,81 |
|
Immediate liquidity |
0,03 |
0,01 |
0,03 |
|
Treasury |
-19.226.098,00 |
-31.807.518,00 |
-36.819.716,00 |
|
Sales on Current Assets |
553 |
551 |
572 |
Results Analysis
Ratios
|
|
31/12/2004 (12) |
31/12/2005 (12) |
31/12/2006 (12) |
|
Economic profitability (%) |
5,45 |
3,71 |
0,52 |
|
Operating Profitability (%) |
9,84 |
7,00 |
0,95 |
|
Equity gearing |
5,19 |
4,63 |
-3,15 |
|
Financial profitability (%) |
26,80 |
19,70 |
1,27 |
|
General Profitability (%) |
6,76 |
10,35 |
0,58 |
Comments on the
Results Analysis Ratios
The economic profitability in the year2005 achieved a 3,71% positive
level, due to a 7,00% economic margin and to an assets turnover of0,53%.
The economic profitability in the year has reduced from 5,45% up to
3,71% of2005, even if it remains positive. This fall is due to the decrease in
operating profitability, that has passe from 9,84% to 7,00%, as assets turnover
whose index has passed from 0,55 to 0,53%.
Financial profitability on 2005 achieved a 19,70%.
The company’s financial structure has instigated its economic
profitability with an indebtedness level of 4,63.
The general profitability on 2005 achieved a 10,35%.
The economic profitability in the year2006 achieved a 0,52% positive
level, due to a 0,95% economic margin and to an assets turnover of0,55%.
The economic profitability in the year has reduced from 3,71% up to
0,52% of2006, even if it remains positive. Assets turnover increase whose index
has passed from 0,53 to 0,55, could not compensate operating profitability
reduction from7,00% to the current level of 0,95%.
Financial profitability on 2006 achieved a 1,27%.
The company’s financial structure has endangered its profitability with
an indebtedness level -3,15.
The general profitability on 2006 achieved a 0,58%.
SECTORIAL ANÁLYSIS
Large Capital Amounts and Financial Balance
Figures given in %
|
|
COMPANY (2006) |
SECTOR |
DIFFERENCE |
DIFFERENCE RELATIVE |
|
|
|
|
|
|
ASSETS |
|
|
|
|
|
|
|
|
|
|
A) DUE FROM
SHAREHOLDERS FOR UNCALLED CAPITAL |
|
0,00 |
|
|
|
|
|
|
|
|
B) FIXED ASSETS |
64,35 |
56,98 |
7,37 |
12,93 |
|
|
|
|
|
|
C) DEFERRED
EXPENSES |
0,85 |
0,12 |
0,73 |
620,34 |
|
|
|
|
|
|
D) CURRENT
ASSETS |
34,80 |
42,90 |
-8,10 |
-18,88 |
|
|
|
|
|
|
ASSETS (A + B +
C + D) |
100 |
100 |
|
|
|
|
|
|
|
|
|
|
|
|
|
|
|
|
|
|
|
|
COMPANY (2006) |
SECTOR |
DIFFERENCE |
DIFFERENCE RELATIVE |
|
|
|
|
|
|
LIABILITIES |
|
|
|
|
|
|
|
|
|
|
A) SHAREHOLDERS
EQUITY |
24,74 |
37,11 |
-12,37 |
-33,34 |
|
|
|
|
|
|
B) DEFERRED
INCOME |
0,40 |
3,62 |
-3,22 |
-88,94 |
|
|
|
|
|
|
C) PROVISIONS
FOR LIABILITIES AND EXPENSES |
3,40 |
1,63 |
1,77 |
108,08 |
|
|
|
|
|
|
D) LONG TERM
LIABILITIES |
28,48 |
23,66 |
4,82 |
20,38 |
|
|
|
|
|
|
E) SHORT TERM
LIABILITIES |
42,98 |
32,88 |
10,10 |
30,72 |
|
|
|
|
|
|
F) SHORT TERM
PROVISIONS FOR LIABILITIES AND EXPENSES |
|
1,10 |
|
|
|
|
|
|
|
|
LIABILITIES (A +
B + C + D + E + F) |
100 |
100 |
|
|
|
|
|
|
|
Sectorial Financial
Balance Comparison
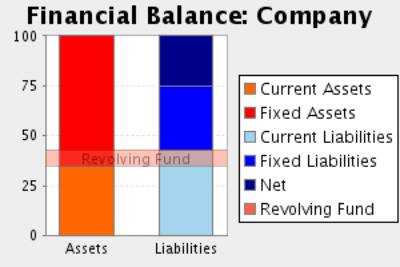
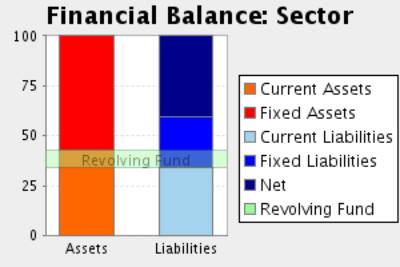
Comments to the Sectorial Analysis
In the 2006, the assets of the company were formed in 65,20% of fixed assets
and in 34,80Current Assets % In the sector, the proportion of fixed assets was
of 57,10%, 14,18% inferior, and the proportion of current assets was of 42,90%,
18,88% superior.
The assets were financed in the company in 25,14% with own capitals , in
31,89% with fixed liabilities and in 42,98% with current liabilities In the
sector, the self financing represented 40,73%, 38,27% superior. On the other
hand the long term debts represented in the sector an average of 25,29%
financing, with a relative difference of 26,09% in favour of the companyAnd,
short term liabilities represented in the sector an average of 33,98%
financing, with a relative difference of 26,49% in favour of the company
The result of this company’s financial structure is a turnover fund that
represents -8,17% of the total assets; in the sector, this same proportion is
8,92%, therefore, we can say that the company’s turnover fund is 191,60%
smaller than the sector one.
Analytical Account of Results
Figures given in %
|
|
COMPANY (2006) |
SECTOR |
DIFFERENCE |
DIFFERENCE RELATIVE |
|
Turnover |
95,87 |
95,34 |
0,54 |
0,56 |
|
Other operating income |
4,13 |
4,66 |
-0,54 |
-11,47 |
|
Production Value |
100,00 |
100,00 |
0,00 |
0,00 |
|
Operating expenses |
55,49 |
59,73 |
-4,24 |
-7,10 |
|
Other operation expenses |
21,23 |
19,00 |
2,23 |
11,75 |
|
Added value |
23,28 |
21,27 |
2,01 |
9,44 |
|
Labour cost |
16,92 |
12,53 |
4,39 |
35,04 |
|
Gross Economic Result |
6,36 |
8,74 |
-2,38 |
-27,24 |
|
Assets depreciation |
5,47 |
5,00 |
0,47 |
9,49 |
|
Variation in provision for current assets and bad debt losses |
-0,02 |
-0,01 |
-0,01 |
233,33 |
|
Net Economic Result |
0,91 |
3,75 |
-2,84 |
-75,73 |
|
Financial income |
4,31 |
2,50 |
1,80 |
72,06 |
|
Financial Charges |
5,94 |
1,99 |
3,95 |
198,19 |
|
Variation in financial investment provision |
|
0,03 |
|
|
|
Ordinary
Activities Result |
-0,72 |
4,23 |
-4,95 |
-117,01 |
|
Extraordinary income |
1,71 |
1,63 |
0,08 |
5,17 |
|
Extraordinary charges |
0,78 |
1,80 |
-1,02 |
-56,62 |
|
Variation in provision in fixed assets |
2,87 |
-0,49 |
3,36 |
-684,52 |
|
Results before Taxes |
-2,67 |
4,55 |
-7,22 |
-158,66 |
|
Corporate taxes |
-3,22 |
1,06 |
-4,28 |
-404,64 |
|
Net Result |
0,55 |
3,50 |
-2,95 |
-84,26 |
|
Assets depreciation |
5,47 |
5,00 |
0,47 |
9,49 |
|
Change of Provisions |
2,86 |
-0,47 |
3,33 |
-713,73 |
|
Net Self-Financing |
8,88 |
8,02 |
0,86 |
10,65 |
Main Ratios
|
|
COMPANY (2006) |
PTILE25 |
PTILE50 |
PTILE75 |
|
STRUCTURAL RATIOS |
|
|
|
|
|
Management fund |
-16.921.895,00 |
1.476,54 |
8.803,37 |
17.759,44 |
|
Management Fund
Requirement |
19.897.821,00 |
-3.826,43 |
945,00 |
8.037,34 |
|
Indebtedness (%) |
74,86 |
38,70 |
62,20 |
67,14 |
|
External Funds on Net Worth |
2,98 |
0,63 |
1,65 |
2,04 |
|
GENERAL ACTIVITY
RATIO |
|
|
|
|
|
Turnover
Increase (%) |
11,12 |
-2,95 |
4,78 |
15,08 |
|
Added value
growth (%) |
-20,47 |
-8,80 |
1,68 |
12,49 |
|
Cash Flow |
10.592.929,00 |
3.382,47 |
5.579,02 |
10.533,00 |
|
Labour
Productivity |
1,38 |
1,36 |
1,76 |
2,25 |
|
Assets turnover |
0,55 |
0,86 |
1,25 |
1,58 |
|
Breakdown Point |
116.857.170,95 |
42.192.163,59 |
67.661.627,53 |
124.803.431,96 |
|
Security Margin of
the Breakdown Point (%) |
2,05 |
4,34 |
13,14 |
18,49 |
|
ACTIVITY RATIOS |
|
|
|
|
|
Average Payment Period |
192 |
42 |
69 |
122 |
|
Average Collection Period |
144 |
85 |
109 |
145 |
|
Inventory Turnover Period |
75 |
24 |
32 |
48 |
|
SOLVENCY RATIOS |
|
|
|
|
|
Payback Capacity |
0,07 |
0,08 |
0,15 |
0,34 |
|
Assets Guarantee |
1,32 |
1,49 |
1,61 |
2,58 |
|
Short Term Debts Proportion (%) |
57,41 |
57,92 |
80,00 |
98,45 |
|
Interest Coverage |
-0,59 |
1,56 |
4,82 |
13,29 |
|
LIQUIDITY RATIOS |
|
|
|
|
|
Current Ratio |
0,81 |
1,06 |
1,34 |
1,85 |
|
Immediate liquidity |
0,03 |
0,01 |
0,06 |
0,51 |
|
Treasury |
-36.819.716,00 |
-4.826,64 |
-206,00 |
5.608,83 |
|
Sales on Current Assets |
572 |
563 |
780 |
1.000 |
Results Analysis
Ratios
|
|
COMPANY (2006) |
PTILE25 |
PTILE50 |
PTILE75 |
|
Economic profitability (%) |
0,52 |
1,33 |
5,19 |
9,22 |
|
Operating Profitability (%) |
0,95 |
0,84 |
4,37 |
7,72 |
|
Equity gearing |
-3,15 |
1,39 |
2,16 |
3,53 |
|
Financial profitability (%) |
1,27 |
3,07 |
10,41 |
15,34 |
|
General Profitability (%) |
0,58 |
1,34 |
3,85 |
6,62 |
NOTES
ABOUT YOUR REQUEST:
The data of your request are correct.
In spite of investigations using every source available (public and
private), no additional details than those contained in this report
are available. .
FOREIGN EXCHANGE
RATES
|
Currency |
Unit
|
Indian Rupees |
|
US Dollar |
1 |
Rs.42.40 |
|
UK Pound |
1 |
Rs.83.87 |
|
Euro |
1 |
Rs.66.02 |
RATING
EXPLANATIONS
|
RATING |
STATUS |
PROPOSED CREDIT LINE |
|
|
>86 |
Aaa |
Possesses an extremely sound financial base with the strongest
capability for timely payment of interest and principal sums |
Unlimited |
|
71-85 |
Aa |
Possesses adequate working capital. No caution needed for credit
transaction. It has above average (strong) capability for payment of interest
and principal sums |
Large |
|
56-70 |
A |
Financial & operational base are regarded healthy. General unfavourable
factors will not cause fatal effect. Satisfactory capability for payment of
interest and principal sums |
Fairly Large |
|
41-55 |
Ba |
Overall operation is considered normal. Capable to meet normal
commitments. |
Satisfactory |
|
26-40 |
B |
Unfavourable & favourable factors carry similar weight in credit
consideration. Capability to overcome financial difficulties seems
comparatively below average. |
Small |
|
11-25 |
Ca |
Adverse factors are apparent. Repayment of interest and principal sums
in default or expected to be in default upon maturity |
Limited with
full security |
|
<10 |
C |
Absolute credit risk exists. Caution needed to be exercised |
Credit not
recommended |
|
NR |
In view of the lack of information, we have no basis upon which to
recommend credit dealings |
No Rating |
|
This score serves as a reference to assess SC’s credit risk
and to set the amount of credit to be extended. It is calculated from a composite
of weighted scores obtained from each of the major sections of this report. The
assessed factors and their relative weights (as indicated through %) are as
follows:
Financial
condition (40%) Ownership
background (20%) Payment
record (10%)
Credit history
(10%) Market trend
(10%) Operational
size (10%)