![]()
MIRA
INFORM REPORT
|
Report Date : |
05.08.2008 |
IDENTIFICATION
DETAILS
|
Name : |
DYNASOL ELASTOMEROS S.A. |
|
|
|
|
Registered Office : |
|
|
|
|
|
Country : |
Spain |
|
|
|
|
Financials (as on) : |
31.12.2006 |
|
|
|
|
Date of Incorporation : |
|
|
|
|
|
Legal Form : |
Joint Stock Company |
|
|
|
|
Line of Business : |
RATING &
COMMENTS
|
MIRA’s Rating : |
B |
|
RATING |
STATUS |
PROPOSED CREDIT LINE |
|
|
26-40 |
B |
Unfavourable & favourable factors carry similar weight in credit
consideration. Capability to overcome financial difficulties seems
comparatively below average. |
Small |
|
Maximum Credit Limit : |
2.827.828,06 € |
|
|
|
|
Status : |
Moderate |
|
|
|
|
Payment Behaviour : |
No Complaints |
|
|
|
|
Litigation : |
Clear |
FINANCIAL REPORT
DYNASOL ELASTOMEROS S.A.
TAX NUMBER: A82356643
EXECUTIVE SUMMARY
Identification
Current Business Name : DYNASOL ELASTOMEROS S.A.
Commercial Name : DYNASOL
ELASTOMEROS, S.A.
Other names : YES
Current Address : PASEO CASTELLANA,
278 - 280, CP 28046 MADRID
Branches : 2
Telephone number : 942298100 Fax: 942998101
URL : www.dynasolelastomers.com
Commercial Risk
Credit Appraisal : 2.827.828,06 €
RAI : NO
Legal Actions : NO
Financial Information
Latest sales known (2007) : 145.060,22 thousands €
(Estimated)
Latest Balance sheet sales (2006) : 174.646.000,00 € (MERCANTILE REGISTER)
Result : -3.972.000 €
Total Assets :
140.031.000 €
Social Capital : 16.806.000,00 €
Employees : 168
Commercial Information
Constitution Date : 02/06/1999
Business activity : Mfg. of
synthetic rubber and latex
NACE Code : 2417
International Operations : No business
relationships registered
Corporate Structure
President:
Parent Company:
Other Complementary Information
Latest proceeding published in BORME: 04/03/2008 Appointments
Latest press article: 12/05/2005 GACETA
NEG (FINANCIAL INFORMATION)
Bank Entities: Yes
Credit Appraisal
Maximum Credit
(from 0 a 6,000,000 €)
Favourable to 2.827.828,06 €
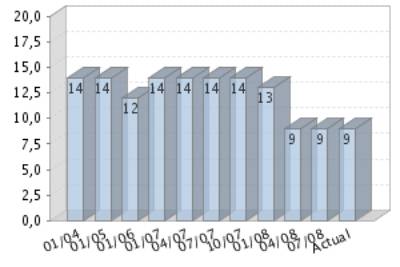
Rating Evolution
Financial Situation
Fiscal year2006
|
Treasury |
Limited |
|
Indebtedness |
Average |
|
Profitability |
Unfavourable |
|
Balance |
Degraded |
Performance
|
Legal Actions |
None or Negligible |
|
Business
Trajectory |
Excellent |
RAI 
COMPANY NOT REGISTERED IN THE R.A.I.
This company is not registered in the Disputed Bills register (R.A.I.)
INCIDENTS

Summary
LEGAL ACTIONS: No legal incidences registered
CLAIM FILED AGAINST THE ADMINISTRATION: No administrative
claims registered
AFFECTED BY: No significant element.
FINANCIAL ELEMENTS AND SECTORIAL
COMPARATIVE
FINANCIAL ELEMENTS
Figures given in thousands €
|
|
2005 (12) |
2006 (12) |
2007 |
|
|
|
|
|
BALANCE SHEET
ANALYSIS |
|
|
|
|
|
|
|
|
OWN FUNDS |
51.294,00 |
47.322,00 |
|
|
|
|
|
|
DEBT |
83.881,00 |
92.709,00 |
|
|
|
|
|
|
FIXED ASSETS |
49.871,00 |
61.065,00 |
|
|
|
|
|
|
TOTAL ASSETS |
135.175,00 |
140.031,00 |
|
|
|
|
|
|
|
|
|
|
|
|
|
|
|
|
2005 (12) |
2006 (12) |
2007 |
|
|
|
|
|
PROFIT AND LOSS
ACCOUNT ANALYSIS |
|
|
|
|
|
|
|
|
SALES |
140.841,00 |
174.646,00 |
145.060,22 |
|
|
|
|
|
ADDED VALUE |
12.995,00 |
15.846,00 |
|
|
|
|
|
|
EBITDA |
3.258,00 |
5.925,00 |
|
|
|
|
|
|
EBIT |
-1.667,00 |
851,00 |
|
|
|
|
|
|
NET RESULT |
34,00 |
-3.972,00 |
|
|
|
|
|
Balance Sheets Items
Analysis
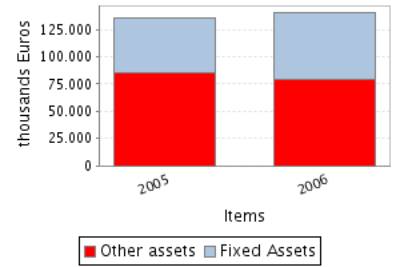
Balance Sheet
Comments
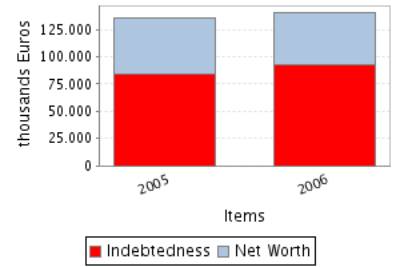
Total assets of the company grew 3,59% between 2005 and 2006.
This growth is a consequence of the fixed assets increase of 22,45%.
This growth has been financed with an indebtedness increase of
10,52%.Moreover, net worth has been reduced in 7,74%, which explains a part of
the indebtedness increase. .
Profit and Loss Account Analysis
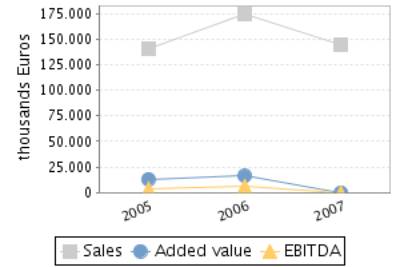
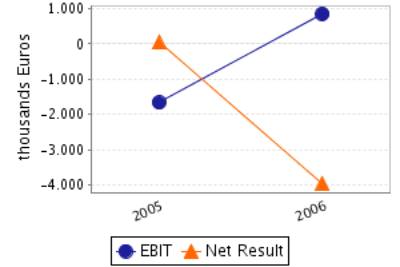
Profit and Loss Account Comments
The company’s sales figure grew 24,00% between 2005 and 2006.
The company’s EBIT grew 151,05% between 2005 and 2006.
This evolution implies an increase in the company’s operating
profitability.
The result of these variations is an increase of the company’s Economic
Profitability of 149,28% in the analysed period, being this profitability of
0,61% in the year 2006.
The company’s Net Result decreased in 11.782,35% between 2005 and 2006.
This evolution, compared to the EBIT’s performance, implies that the
financial and extraordinary activities have had a negative effect in the
company’s Financial Profitability.
The result of these variations is a reduction of the company’s
profitability of 12.760,03% in the analysed period, being equal to -8,39% in
the year 2006.
ANNUAL FINANCIAL REPORT
ADDITIONAL DATA
Source: annual financial report 2006
Results Distribution
Figures given in €
|
DISTRIBUTION
BASE |
DISTRIBUTION TO |
||
|
Profit and Loss |
-3.972.000,00 |
Retained earnings |
0,00 |
|
Carry Over |
0,00 |
Voluntary Reserve |
0,00 |
|
Voluntary reserves |
0,00 |
Prior years losses |
-3.972.000,00 |
|
Reserves |
0,00 |
Carry Over |
0,00 |
|
Other concepts |
0,00 |
Other funds |
0,00 |
|
Total of Amounts to be distributed |
-3.972.000,00 |
Dividends |
0,00 |
|
|
|
Other Applications |
0,00 |
Auditing
Auditors’ opinion: FAVOURABLE WITH RESERVATIONS
Auditor: DELOITTE SL
COMPARATIVE SECTOR ANALYSIS
Values table
Figures expressed in %
|
|
COMPANY (2006) |
SECTOR |
DIFFERENCE |
DIFFERENCE RELATIVE |
|
|
|
|
|
|
BALANCE SHEET
ANALYSIS: % on the total assets |
|
|
|
|
|
|
|
|
|
|
OWN FUNDS |
33,79 |
50,97 |
-17,18 |
-33,70 |
|
|
|
|
|
|
DEBT |
66,21 |
49,03 |
17,18 |
35,04 |
|
|
|
|
|
|
FIXED ASSETS |
43,61 |
51,38 |
-7,77 |
-15,12 |
|
|
|
|
|
|
|
|
|
|
|
|
|
|
|
|
|
|
COMPANY (2006) |
SECTOR |
DIFFERENCE |
DIFFERENCE RELATIVE |
|
|
|
|
|
|
PROFIT AND LOSS
ACCOUNT ANALYSIS: % on the total operating income |
|
|
|
|
|
|
|
|
|
|
SALES |
94,93 |
98,63 |
-3,70 |
-3,75 |
|
|
|
|
|
|
ADDED VALUE |
8,61 |
20,05 |
-11,44 |
-57,05 |
|
|
|
|
|
|
EBIT |
0,46 |
6,00 |
-5,54 |
-92,29 |
|
|
|
|
|
|
NET RESULT |
-2,16 |
5,19 |
-7,35 |
-141,57 |
|
|
|
|
|
Sector Composition
Compared sector (NACE): 241
Number of companies: 48
Size (Sales Figure) : > 40.000.000,00
Euros
Comments on the sectorial comparative
Compared to its sector the assets of the companies show an inferior
proportion of fixed assets. Specifically the difference with the sector average
is -7,77% , which means a relative difference of -15,12% .
In liabilities composition the company appeals on a wider scale to self
financing, being the proportion of net worth of 17,18% inferior, which means a
relative difference of 33,70% 17,18% more than the sector, which means a
difference of 35,04% .
The proportion that the sales mean to the company’s total ordinary
income is 94,93%, 3,70% lower than in the sector, which means a relative
difference of 3,75% .
The company’s EBIT was positive and was 0,46% with regard to the total
ordinary income, 5,54% less than the sector, which means a relative difference
of 92,29% .
The company’s capacity to generate operating income is equal to that of
the sector as its ratio EBIT/Sales is also equal.
The company’s net result was negative and equal to -2,16% with regard to
the total ordinary income, 7,35% less than the sector, which means a relative
difference of 141,57% .
ADDRESSES
Current Legal Seat Address:
PASEO CASTELLANA, 278 - 280
28046
MADRID
Characteristics
of the current address
Type of premises: office
Property: owned; with no official confirmation
Local Situation: main
Branches 
|
STREET |
POSTAL CODE |
TOWN |
PROVINCE |
|
STREET APARTADO DE CORREOS 388 |
39792 |
MARINA DE CUDEYO |
Cantabria |
|
STREET URBI KALEA 6 |
39792 |
MARINA DE CUDEYO |
Cantabria |
2 branches registered
CORPORATE STRUCTURE
ADMINISTRATIVE LINKS
Main Board members, Directors and Auditor ![]()
|
POSITION |
SURNAMES AND
NAME |
APPOINTMENT DATE |
|
|
PRESIDENT |
GUTIERREZ MONTERO NICOLAS |
06/10/2006 |
|
|
VICEPRESIDENT |
PALOMO SANZ BENJAMIN |
30/11/2007 |
|
|
CHIEF OFFICER |
DE LA BARREDA GOMEZ ALEJANDRO |
06/10/2006 |
|
|
CHIEF OFFICER |
ALMADA WRIGHT JORGE LUIS |
06/10/2006 |
|
|
CHIEF OFFICER |
SANZ CEDRON JAVIER |
06/10/2006 |
|
|
CHIEF OFFICER |
GUTIERREZ WANLESS JUAN MARCO |
06/10/2006 |
|
|
CHIEF OFFICER |
RUIZ DORADO JUAN CARLOS |
02/04/2007 |
|
|
CHIEF OFFICER |
LARREA PAGUAGA IGNACIO |
30/11/2007 |
|
|
SECRETARY |
CIORDIA RUEDA ELENA JORDANA |
31/05/2006 |
|
|
AUDITOR |
APPOINTMENT DATE |
||
|
DELOITTE SL |
16/01/2008 |
||
Functional Managers
|
POSITION |
SURNAMES AND
NAME |
|
General Manager |
COMPTE PERALES DANIEL |
|
Financial Manager |
LOBATO SEBASTIAN |
|
Human Resources Manager |
LOBATO SEBASTIAN |
|
Commercial Manager |
URIBE RAFAEL |
FINANCIAL LINKS
|
|
BUSINESS NAME |
CIF / COUNTRY |
% |
SOURCE |
DATA INF. |
|
|
REPSOL QUIMICA SA |
A28122992 |
50,01 |
OWN SOURCES |
05/03/2008 |
|
|
GIRSA |
MEXICO |
49,99 |
OWN SOURCES |
05/03/2008 |
You can obtain business information of a foreign companies at the
pageD&B INTERNATIONAL
CREDIT INFORMATION
Constitution Date: 02/06/1999
Business activity 
Activity: Mfg. of synthetic rubber and latex
NACE Code: 2417
NACE Activity: Manufacture of synthetic rubber in primary forms
Business: LA FABRICACION, COMERCIO Y TECNOLOGIA DE TODA CLASE
DE PRODUCTOS QUIMICOS, INCLUSO PETROQUIMICOS. ADQUISICION. TENENCIA Y
ENAJENACION DE BIENES INMUEBLES E INSTALACIONES INDUSTRIALES.
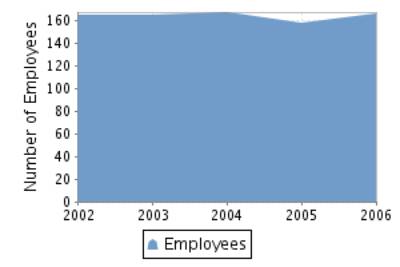
Employees 
Number of total employees: 168 (2008)
Number of fixed employees: 91,57%
Number of temporary employees: 8,43%
Employees evolution
COMMERCIAL OPERATIONS 
SUPPLIERS
|
BUSINESS NAME |
INTERNATIONAL |
|
REPSOL QUIMICA
(ITALIA) |
NO |
|
REPSOL DERIVADOS
SA |
NO |
|
REPSOL QUIMICA
SA |
NO |
|
REPSOL BUTANO SA |
NO |
|
SUBGRUPO
COMERCIAL |
NO |
|
REPSOL YPF
LUBRICANTES Y ESP SA |
NO |
|
DYNASOL GESTION
SA |
NO |
|
SUBGRUPO REPSOL
BUTANO |
NO |
|
DYNASOL GESTION
SA |
NO |
|
REPSOL CHEMIE
DEUTSCHLAND |
NO |
20 proveedores
SALES
Collection (estimated):
On a credit basis: 100%
National Distribution: 100%
CLIENTS
|
BUSINESS NAME |
INTERNATIONAL |
|
DYNASOL
ELASTOMEROS SA DE C V |
NO |
|
POLIDUX SA |
NO |
|
REPSOL YPF
LUBRICANTES Y ESP SA |
NO |
|
REPSOL QUIMICA
SA |
NO |
|
REPSOL CHEMIE
DEUSTCHLAND |
YES |
|
REPSOL QUIMICA
SA |
NO |
|
COMPOSAN
DISTRIBUCION SA |
NO |
|
REPSOL YPF SA |
NO |
|
REPSOL YPF SA |
NO |
|
REPSOL PRODUCTOS
ASFALTICOS SA |
NO |
15 clientes
Banks 
|
ENTITY |
BRANCH |
ADDRESS |
TOWN OR CITY |
PROVINCE |
|
BANCO BILBAO
VIZCAYA ARGENTARIA, S.A. |
4000 |
ALCALA, 16 |
MADRID |
Madrid |
|
BANCO SANTANDER,
S.A. |
9517 |
CTRA. DE BARCELONA KM. 11,700 |
MADRID |
Madrid |
|
BANKINTER, S.A. |
|
|
MADRID |
|
|
CAJA DE AHORROS Y M.P. DE MADRID |
1583 |
AV. MENENDEZ PELAYO, 65 HOSP.NIÑO JESUS |
MADRID |
Madrid |
4 bank entities registered
Brands, Signs and Commercial Names ![]()
Brand name: DYNASOL (Valid)
Type: JOINT Date: 26/11/1999
Name: DYNASOL ELASTOMEROS, S.A. (Valid)
Type: DENOMINATIVE Date: 28/02/2001
LEGAL STRUCTURE
Constitution Data
Register Date: 02/06/1999
Register town: Madrid
Announcement number: 231381
Current Legal Form: JOINT STOCK
COMPANY
Current Capital:
16.806.000,00 €
Legal Aspects
Obligation to fill in Financial
Statements: YES
Chamber census: YES (2006)
Listed on a Stock Exchange: NO
B.O.R.M.E.(Official Companies Registry
Gazette) 
Registered Proceedings
|
PROCEEDINGS |
DATE |
NOTICE NUM. |
TRADE REG. |
|
Appointments |
04/03/2008 |
122904 |
Madrid |
|
Re-elections |
16/01/2008 |
21018 |
Madrid |
|
Resignations |
30/11/2007 |
598237 |
Madrid |
|
Appointments |
30/11/2007 |
598237 |
Madrid |
Other Proceedings published
|
PROCEEDINGS |
DATE |
NOTICE NUM. |
TRADE REG. |
|
Registration of accounts (2006) Individual |
15/01/2008 |
28744 |
Madrid |
Press articles

12/05/2005 GACETA NEG (FINANCIAL INFORMATION)
EL GRUPO REPSOL YPF INVERTIRA 13 MM. DE EUROS EN LA PLANTA QUIMICA DE
DYNASOL EN LA LOCALIDAD CANTABRA DE GAJANO, DONDE LA CIA. ESTA INSTALANDO YA UN
NUEVO TREN DE SECADO Y PREVE CONSTRUIR PROXIMAMENTE UN REACTOR PARA
HIDROGENACION, LO QUE LE PERMITIRA DUPLICAR LA ACTUAL CAPACIDAD PRODUCTIVA DE
LAS INSTALACIONES. LAS INVERSIONES SERAN SUBVENCIONADAS EN UN 10% POR EL
EJECUTIVO CANTABRO A TRAVES DE FONDOS EUROPEOS.
01/01/2005 CANTABRIA ECONOMICA (FINANCIAL INFORMATION)
EL FABRICANTE DE ELASTOMEROS DYNASOL VA A INVERTIR 10,8 MM. DE EUROS EN
LA RENOVACION DE LA LINEA DE PRODUCCION DE CAUCHOS DE LA PLANTA DE GAJANO. EL
PROYECTO CONTARA CON AYUDAS PROCEDENTES DE LOS FONDOS DE INCENTIVOS REGIONALES
EQUIVALENTES AL 10% DE LA INVERSION, CON EL COMPROMISO DEL MANTENIMIENTO DEL
EMPLEO, YA QUE LA RENOVACION PREVISTA TAN SOLO GENERARA UN NUEVO PUESTO DE
TRABAJO. LA EMPRESA CUENTA, ASIMISMO, CON UNA PLANTA EN ALTAMIRA (MEXICO) Y ES
EL SEGUNDO PRODUCTOR DEL MUNDO DE CAUCHOS TERMOPLASTICOS HIDROGENADOS.
Complementary Information
24/10/06 BLOQUE DE
INVESTIGACION:
- Otro establecimiento: Cl Urbi Kalea, 6 en Gajano (Cantabria). Apdo
Correos 388. Tfno: 942 298100.
----------------------------------------------------------------------
El Bloque de Investigacion no esta sujeto a actualizaciones sistemati-
cas. Los datos mostrados fueron aportados por las fuentes consultadas
en la fecha del encabezamiento.
FINANCIAL INFORMATION
The information on the last account contained in this report is
extracted from the Mercantile Register file of the legal address of the Company
and dated 11/03/2008.
BALANCE SHEET
Assets
Figures given in thousands €
|
|
31/12/2004 (12) |
31/12/2005 (12) |
31/12/2006 (12) |
|
A) DUE FROM SHAREHOLDERS FOR UNCALLED CAPITAL |
|
|
|
|
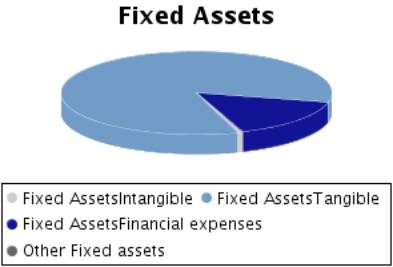
B) FIXED ASSETS |
48.927,00 |
49.871,00 |
61.065,00 |
|
I. Incorporation costs |
|
|
|
|
II. Intangible fixed assets |
23,00 |
449,00 |
397,00 |
|
R & D expenses |
13.573,00 |
13.573,00 |
13.573,00 |
|
Concessions,
patents, licences , trademarks |
1.244,00 |
1.244,00 |
1.244,00 |
|
Goodwill |
|
|
|
|
Acquired rights from finance leases |
|
|
|
|
Software |
618,00 |
618,00 |
618,00 |
|
Leasing |
|
461,00 |
461,00 |
|
Cash advance |
|
|
|
|
Provisions |
|
|
|
|
Depreciation |
-15.412,00 |
-15.447,00 |
-15.499,00 |
|
III. Tangible fixed assets |
48.741,00 |
49.401,00 |
51.069,00 |
|
Property, plant and equipment |
22.688,00 |
22.700,00 |
22.700,00 |
|
Machinery, equipment and other |
104.238,00 |
105.334,00 |
111.170,00 |
|
Other property plant and equipment |
466,00 |
472,00 |
500,00 |
|
Prepaid expenses on fixed assets |
2.275,00 |
6.547,00 |
7.268,00 |
|
Other assets |
2.322,00 |
2.388,00 |
2.539,00 |
|
Provisions |
|
|
|
|
Depreciation |
-83.248,00 |
-88.040,00 |
-93.108,00 |
|
IV. Financial fixed assets |
163,00 |
21,00 |
9.599,00 |
|
Shares in affiliated companies |
|
|
|
|
Receivables in affiliated companies |
|
|
|
|
Shares in associated companies |
|
|
|
|
Loans to associated companies |
|
|
|
|
Securities |
|
|
|
|
Other loans |
142,00 |
|
9.579,00 |
|
Long term deposits and guarantees |
21,00 |
21,00 |
20,00 |
|
Provisions |
|
|
|
|
Taxes receivable |
|
|
|
|
V.Owners equity |
|
|
|
|
VI.Long term trade liabilities |
|
|
|
|
C) DEFERRED EXPENSES |
14,00 |
17,00 |
1,00 |
|
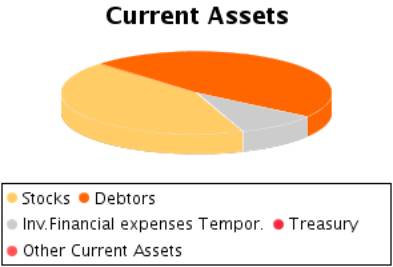
D) CURRENT ASSETS |
73.812,00 |
85.287,00 |
78.965,00 |
|
I. Shareholders by required outlays |
|
|
|
|
II. Stocks |
20.369,00 |
28.817,00 |
33.876,00 |
|
Goods available for sale |
623,00 |
1.183,00 |
1.734,00 |
|
Raw material inventory |
6.891,00 |
7.079,00 |
7.579,00 |
|
Work in Progress |
|
|
|
|
Finished goods |
13.007,00 |
20.573,00 |
24.557,00 |
|
Subproducts and recycled materials |
7,00 |
5,00 |
5,00 |
|
Cash advance |
1,00 |
1,00 |
1,00 |
|
Provisions |
-160,00 |
-24,00 |
|
|
III. Debtors |
42.930,00 |
47.789,00 |
37.396,00 |
|
Clients |
27.433,00 |
26.278,00 |
26.795,00 |
|
Amounts owned by affiliated companies |
2.073,00 |
2.886,00 |
908,00 |
|
Amounts owned by associated companies |
3.140,00 |
5.739,00 |
6.438,00 |
|
Other debts |
538,00 |
516,00 |
916,00 |
|
Staff Expenses |
340,00 |
471,00 |
485,00 |
|
Government |
10.246,00 |
12.845,00 |
2.698,00 |
|
Provisions |
-840,00 |
-946,00 |
-844,00 |
|
IV. Temporary financial investment |
10.136,00 |
8.450,00 |
7.689,00 |
|
Shares in affiliated companies |
3.097,00 |
|
|
|
Receivables in affiliated companies |
7.012,00 |
|
|
|
Shares in associated companies |
|
|
|
|
Loans to associated companies |
|
8.423,00 |
7.688,00 |
|
Short term investment |
|
|
|
|
Other loans |
|
|
|
|
Short Term Deposit and guarantees |
27,00 |
27,00 |
1,00 |
|
Provisions |
|
|
|
|
V. Short-term own shares |
|
|
|
|
VI. Treasury |
372,00 |
197,00 |
4,00 |
|
VII. Periodification adjustments |
5,00 |
34,00 |
|
|
ASSETS (A + B + C + D) |
122.753,00 |
135.175,00 |
140.031,00 |
Assets composition
Liabilities
Figures given in thousands €
|
|
31/12/2004 (12) |
31/12/2005 (12) |
31/12/2006 (12) |
|
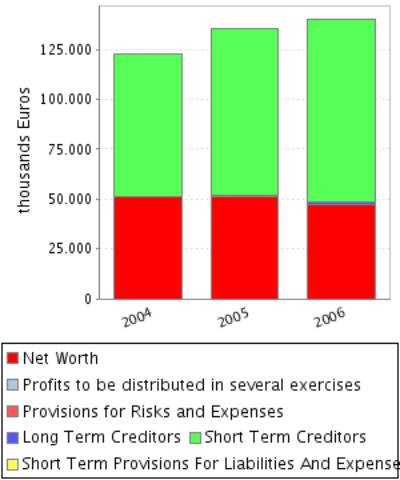
A) SHAREHOLDERS EQUITY |
51.189,00 |
51.223,00 |
47.251,00 |
|
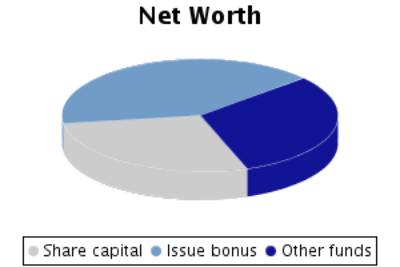
I. Share capital |
16.806,00 |
16.806,00 |
16.806,00 |
|
II. Issue bonus |
24.398,00 |
24.398,00 |
24.398,00 |
|
III.Revaluation reserve |
|
|
|
|
IV.Reserves |
18.376,00 |
18.376,00 |
18.410,00 |
|
Retained earnings |
1.838,00 |
1.838,00 |
1.841,00 |
|
Sinking fund from owner equity |
|
|
|
|
Reserve for the parent company capital |
|
|
|
|
Statutory reserve |
|
|
|
|
Other funds |
16.538,00 |
16.538,00 |
16.569,00 |
|
Capital adjustments in Euros |
|
|
|
|
V.Results from previous years |
-1.300,00 |
-8.391,00 |
-8.391,00 |
|
Carry Over |
|
|
|
|
Prior years losses |
-1.300,00 |
-8.391,00 |
-8.391,00 |
|
Loans from
partners for losses compensation |
|
|
|
|
VI.Profit and Losses |
-7.091,00 |
34,00 |
-3.972,00 |
|
VII.Dividend paid during the year |
|
|
|
|
VIII.Own shares for capital reduction |
|
|
|
|
B) DEFERRED INCOME |
71,00 |
71,00 |
71,00 |
|
Capital grants |
|
|
|
|
Positive change difference |
71,00 |
71,00 |
71,00 |
|
Other deferred income |
|
|
|
|
Fiscal deferred income |
|
|
|
|
C) PROVISIONS FOR LIABILITIES AND EXPENSES |
21,00 |
37,00 |
39,00 |
|
Provision for pensions plans |
|
|
|
|
Provision for taxes |
|
|
|
|
Other provisions |
21,00 |
37,00 |
39,00 |
|
Reversion fund |
|
|
|
|
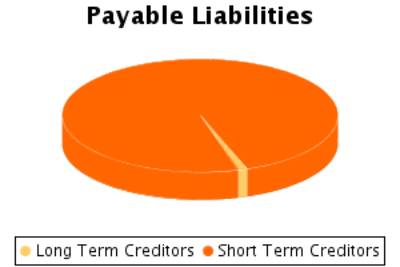
D) LONG TERM LIABILITIES |
|
619,00 |
960,00 |
|
I.Negotiable bonds and other negotiable values |
|
|
|
|
Non convertible securities |
|
|
|
|
Convertible securities |
|
|
|
|
Other convertible debentures |
|
|
|
|
II.Debt with bank entities |
|
219,00 |
70,00 |
|
Long term bank loans |
|
219,00 |
70,00 |
|
Leasing |
|
|
|
|
III.Debts with associated and affiliated
companies |
|
|
|
|
With affiliated companies |
|
|
|
|
Associated companies |
|
|
|
|
IV. Other creditors |
|
400,00 |
890,00 |
|
Bills payable |
|
|
|
|
Other debts |
|
400,00 |
890,00 |
|
Long term deposit and guaranties |
|
|
|
|
Taxes receivable |
|
|
|
|
V. Deferred debts on shares |
|
|
|
|
From affiliated companies |
|
|
|
|
From associated companies |
|
|
|
|
Other companies |
|
|
|
|
VI. Long term debt with creditor |
|
|
|
|
E) SHORT TERM LIABILITIES |
71.472,00 |
83.225,00 |
91.710,00 |
|
I.Negotiable bonds and other negotiable values |
|
|
|
|
Non convertible securities |
|
|
|
|
Convertible securities |
|
|
|
|
Other convertible debentures |
|
|
|
|
Interests from bonds |
|
|
|
|
II.Debt with bank entities |
|
273,00 |
381,00 |
|
Loans and other debts |
|
273,00 |
381,00 |
|
Debt interest |
|
|
|
|
Leasing |
|
|
|
|
III. Short term debts with associated and
affiliated companies |
40.982,00 |
45.425,00 |
48.294,00 |
|
With affiliated companies |
40.982,00 |
45.425,00 |
48.294,00 |
|
Associated companies |
|
|
|
|
IV. Commercial creditors |
29.108,00 |
35.879,00 |
41.647,00 |
|
Accounts payable |
|
|
|
|
Expenses |
29.108,00 |
35.879,00 |
41.647,00 |
|
Bills payable |
|
|
|
|
V. Other non-commercial debt |
1.382,00 |
1.648,00 |
1.388,00 |
|
Government |
299,00 |
325,00 |
389,00 |
|
Bills payable |
|
|
|
|
Other debts |
66,00 |
345,00 |
2,00 |
|
Accounts receivable |
1.017,00 |
978,00 |
997,00 |
|
Short term deposits and guarantees |
|
|
|
|
VI. Provisions for current assets |
|
|
|
|
VII. Periodification adjustments |
|
|
|
|
F) SHORT TERM PROVISIONS FOR LIABILITIES AND EXPENSES |
|
|
|
|
LIABILITIES (A + B + C + D + E + F) |
122.753,00 |
135.175,00 |
140.031,00 |
Liabilities
Composition
PROFIT AND LOSS ACCOUNT
Itams of the Profit and Loss Account
Figures given in thousands €
|
|
31/12/2004 (12) |
31/12/2005 (12) |
31/12/2006 (12) |
|
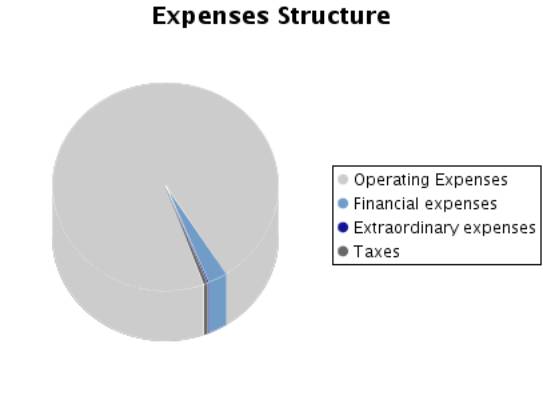
A) EXPENSES (A.1 a A.16) |
137.481,00 |
161.856,00 |
193.843,00 |
|
A.1.Reduction in stocks of finished goods and
work in progress |
3.398,00 |
|
|
|
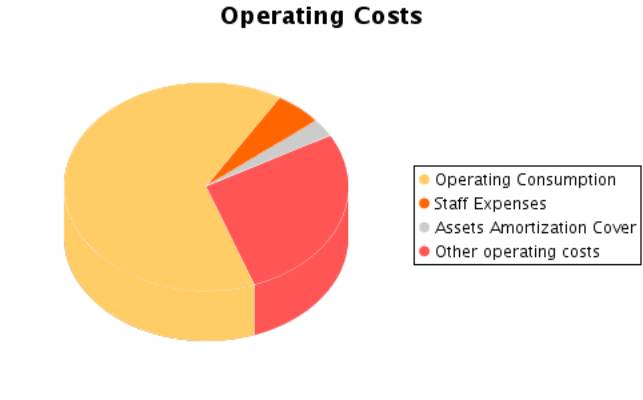
A.2.Supplies |
77.761,00 |
98.985,00 |
121.620,00 |
|
Material consumed |
2.503,00 |
6.147,00 |
7.450,00 |
|
Raw materials consumed |
75.193,00 |
92.751,00 |
114.104,00 |
|
Other expenses |
65,00 |
87,00 |
66,00 |
|
A.3. Labour cost |
9.405,00 |
9.737,00 |
9.921,00 |
|
Wages |
6.937,00 |
7.195,00 |
7.341,00 |
|
Social security expenses |
2.468,00 |
2.542,00 |
2.580,00 |
|
A.4. Assets depreciation |
5.642,00 |
4.874,00 |
5.160,00 |
|
A.5.Variance in the traffic provisions |
-458,00 |
51,00 |
-86,00 |
|
Variance in provision for inventory |
-450,00 |
-136,00 |
-24,00 |
|
Variance in provision for bad debts |
-8,00 |
187,00 |
-62,00 |
|
Variance in provision for other current assets |
|
|
|
|
A.6. Other operating costs |
42.358,00 |
47.120,00 |
50.493,00 |
|
External costs |
42.202,00 |
47.022,00 |
50.326,00 |
|
Taxes |
156,00 |
98,00 |
167,00 |
|
Other day to day expenses |
|
|
|
|
Allowance to reversion fund |
|
|
|
|
A.I.OPERATING RESULT
(B.1+B.2+B.3+B.4-A.1-A.2-A.3-A.4-A.5-A.6) |
|
|
851,00 |
|
A.7.Financial expenses and similar |
2.564,00 |
2.342,00 |
2.852,00 |
|
Debts with related companies |
2.255,00 |
1.746,00 |
1.376,00 |
|
Debts with associated companies |
|
|
|
|
Other companies debts By debts with third parties and similar expenses |
309,00 |
596,00 |
1.476,00 |
|
Losses from financial investments |
|
|
|
|
A.8. Variation in financial investment provision |
|
|
|
|
A.9.Negative exchange difference |
2.852,00 |
758,00 |
2.527,00 |
|
A.II.POSITIVE
FINANCIAL RESULTS (B.5+B.6+B.7+B.8-A.7-A.8-A.9) |
|
|
|
|
A.III.PROFIT
FROM ORDINARY ACTIVITIES (A.I+A.II-B.I-B.II) |
|
|
|
|
A.10. Variation
in provision in fixed assets |
|
|
|
|
A.11. Losses in
fixed assets |
|
34,00 |
11,00 |
|
A.12. Losses
from own shares and bonds |
|
|
|
|
A.13.
Extraordinary charges |
5,00 |
|
360,00 |
|
A.14.Other
exercises’ expenses and losses |
2,00 |
23,00 |
|
|
A.IV.POSITIVE
EXTRAORDINARY RESULT (B.9+B.10+B.11+B.12+B.13-A.10-A.11-A.12-A.13-A.14) |
|
18,00 |
|
|
A.V.PROFIT
BEFORE TAXES (A.III+A.IV-B.III-B.IV) |
|
|
|
|
A.15.Corporate Taxes |
-6.048,00 |
-2.068,00 |
985,00 |
|
A.16. Other taxes |
|
|
|
|
A.VI.EXERCISE
RESULT (PROFIT) (A.V-A.14-A.15) |
|
34,00 |
|
|
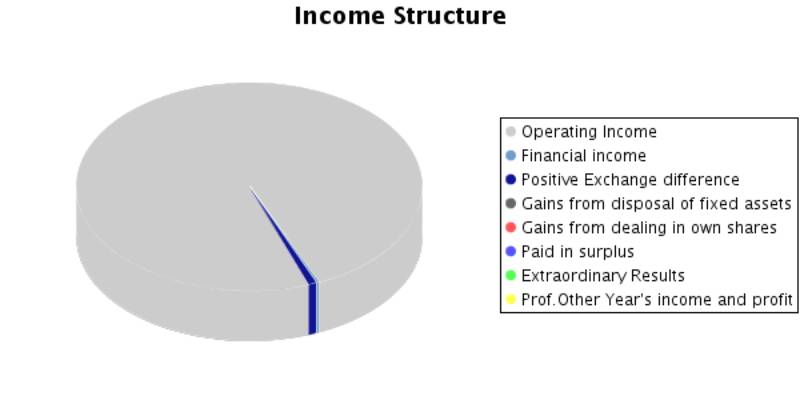
B) INCOMES (B.1 a B13) |
130.390,00 |
161.890,00 |
189.871,00 |
|
B.1. Turnover |
118.344,00 |
140.841,00 |
174.646,00 |
|
Sales |
121.408,00 |
143.182,00 |
177.287,00 |
|
Services provided |
|
|
|
|
Refunds and sale reminders |
-3.064,00 |
-2.341,00 |
-2.641,00 |
|
B.2.Increase in inventory of finished goods and
works in progress |
|
7.565,00 |
3.984,00 |
|
B.3.Expenses capitalized |
302,00 |
122,00 |
403,00 |
|
B.4. Other operating income |
8.975,00 |
10.572,00 |
8.926,00 |
|
Other incomes |
8.975,00 |
4.864,00 |
4.530,00 |
|
Grants |
|
|
8,00 |
|
Excess in provision for liabilities and charges |
|
5.708,00 |
4.388,00 |
|
B.I.OPERATING LOSSES
(A.1+A.2+A.3+A.4+A.5+A.6-B.1-B.2-B.3-B.4) |
10.485,00 |
1.667,00 |
|
|
B.5.Incomes from share participations |
|
|
|
|
From affiliated companies |
|
|
|
|
From associated companies |
|
|
|
|
From other companies |
|
|
|
|
B.6.Income from other securities and credits to
fixed assets |
|
|
|
|
From affiliated companies |
|
|
|
|
From associated companies |
|
|
|
|
Other companies |
|
|
|
|
B.7.Other interests and similar |
679,00 |
429,00 |
528,00 |
|
From affiliated companies |
116,00 |
|
|
|
From associated companies |
479,00 |
404,00 |
460,00 |
|
Other Interests |
84,00 |
25,00 |
68,00 |
|
Profits from investments |
|
|
|
|
B.8. Positive change difference |
2.089,00 |
2.286,00 |
1.384,00 |
|
B.II. NEGATIVE
FINANCIAL RESULTS (A.7+A.8+A.9-B.5-B.6-B.7-B.8) |
2.648,00 |
385,00 |
3.467,00 |
|
B.III.LOSSES
FROM ORDINARY ACTIVITIES (B.I+B.II-A.I-A.II) |
13.133,00 |
2.052,00 |
2.616,00 |
|
B.9.B.9. Gains
from disposal of fixed assets |
|
|
|
|
B.10.Gains from
dealing in own shares |
|
|
|
|
B.11. Paid in
surplus |
|
|
|
|
B.12.
Extraordinary income |
|
|
|
|
B.13.Other
year’s income and profits |
1,00 |
75,00 |
|
|
B.IV.NEGATIVE
EXTRAORDINARY LOSSES (A.10+A.11+A.12+A.13+A.14-B.9-B.10-B.11-B.12-B.13) |
6,00 |
|
371,00 |
|
B.V.LOSS BEFORE
TAXES (B.III+B.IV-A.III-A.IV) |
13.139,00 |
2.034,00 |
2.987,00 |
|
B.VI.EXERCISE
RESULTS (LOSS) (B.V+A.14+A.15) |
7.091,00 |
|
3.972,00 |
Composition of the
Profit and Loss Account
FINANCIAL BALANCE
Here the Main Capital Amounts of the company and the Revolving Fund
Evolution are analysed.
Financial Balance Table
Figures given in thousands €
|
|
31/12/2004 (12) |
% |
31/12/2005 (12) |
% |
31/12/2006 (12) |
% |
|
A) DUE FROM
SHAREHOLDERS FOR UNCALLED CAPITAL |
|
|
|
|
|
|
|
B) FIXED ASSETS |
48.927,00 |
39,86 |
49.871,00 |
36,89 |
61.065,00 |
43,61 |
|
C) DEFERRED
EXPENSES |
14,00 |
0,01 |
17,00 |
0,01 |
1,00 |
0,00 |
|
D) CURRENT
ASSETS |
73.812,00 |
60,13 |
85.287,00 |
63,09 |
78.965,00 |
56,39 |
|
ASSETS (A + B +
C + D) |
122.753,00 |
|
135.175,00 |
|
140.031,00 |
|
|
|
||||||
|
A) SHAREHOLDERS
EQUITY |
51.189,00 |
41,70 |
51.223,00 |
37,89 |
47.251,00 |
33,74 |
|
B) DEFERRED INCOME |
71,00 |
0,06 |
71,00 |
0,05 |
71,00 |
0,05 |
|
C) PROVISIONS
FOR LIABILITIES AND EXPENSES |
21,00 |
0,02 |
37,00 |
0,03 |
39,00 |
0,03 |
|
D) LONG TERM
LIABILITIES |
|
|
619,00 |
0,46 |
960,00 |
0,69 |
|
E) SHORT TERM
LIABILITIES |
71.472,00 |
58,22 |
83.225,00 |
61,57 |
91.710,00 |
65,49 |
|
F) SHORT TERM
PROVISIONS FOR LIABILITIES AND EXPENSES |
|
|
|
|
|
|
|
LIABILITIES (A + B + C + D + E + F) |
122.753,00 |
|
135.175,00 |
|
140.031,00 |
|
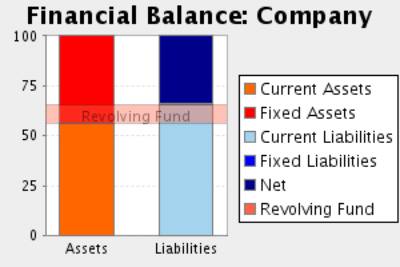
Financial Balance
Composition
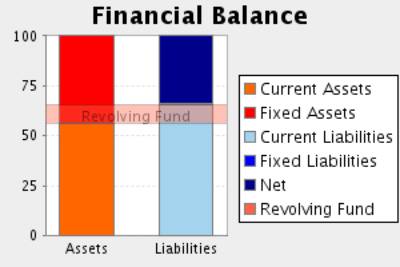
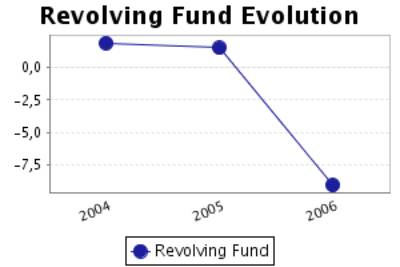
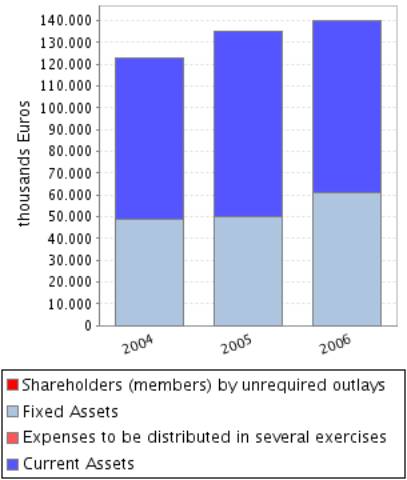
Comments on Financial Balance
In the 2004, the assets of the company were formed in 39,87% of Fixed
Assets and in 60,13% of Current Assets.This assets were financed in 41,76% with
own capitals, and in 0,02% with long term debt and in 58,22% with current
liabilities.
The result of this financial structure is a positive turnover fund of
2.340,00 Euros, which is equivalent to 1,91% proportion of the company’s
total assets.
In the 2005, the assets of the company were formed in 36,91% of Fixed
Assets and in 63,09% of Current Assets.This assets were financed in 37,95% with
own capitals, and in 0,49% with long term debt and in 61,57% with current
liabilities.
The result of this financial structure is a positive turnover fund of
2.062,00 Euros, which is equivalent to 1,53% proportion of the company’s
total assets.
This measure has diminished with respect to the previous exercise in
11,88% having also diminished its proportion with respect to the total assets
of the company.
In the 2006, the assets of the company were formed in 43,61% of Fixed
Assets and in 56,39% of Current Assets.This assets were financed in 33,79% with
own capitals, and in 0,71% with long term debt and in 65,49% with current
liabilities.
The result of this financial structure is a negative turnover fund of
-12.745,00 thousands Euros, which is equivalent to -9,10% proportion of
the company’s total assets.
This measure has diminished with respect to the previous exercise in
718,09% having also diminished its proportion with respect to the total assets
of the company.
RATIOS
Main Ratios
|
|
31/12/2004 (12) |
31/12/2005 (12) |
31/12/2006 (12) |
|
STRUCTURAL RATIOS |
|
|
|
|
Management fund |
2.340,00 |
2.062,00 |
-12.745,00 |
|
Management Fund Requirement |
-8.168,00 |
-6.312,00 |
-20.057,00 |
|
Indebtedness (%) |
58,24 |
62,05 |
66,21 |
|
External Funds on Net Worth |
1,40 |
1,64 |
1,96 |
|
GENERAL ACTIVITY RATIO |
|
|
|
|
Turnover Increase (%) |
7,16 |
19,01 |
24,00 |
|
Added value growth (%) |
-68,67 |
216,64 |
21,94 |
|
Cash Flow |
-1.907,00 |
4.959,00 |
1.102,00 |
|
Labour Productivity |
0,44 |
1,34 |
1,60 |
|
Assets turnover |
0,96 |
1,04 |
1,25 |
|
Breakdown Point |
156.421,01 |
155.737,09 |
181.614,96 |
|
Security Margin of the Breakdown Point (%) |
-22,57 |
-2,77 |
1,28 |
|
ACTIVITY RATIOS |
|
|
|
|
Average Payment Period |
129 |
141 |
127 |
|
Average Collection Period |
131 |
122 |
77 |
|
Inventory Turnover Period |
62 |
74 |
70 |
|
SOLVENCY RATIOS |
|
|
|
|
Payback Capacity |
-0,03 |
0,06 |
0,01 |
|
Assets Guarantee |
1,72 |
1,61 |
1,51 |
|
Short Term Debts Proportion (%) |
99,97 |
99,22 |
98,92 |
|
Interest Coverage |
-1,82 |
-2,30 |
-1,68 |
|
LIQUIDITY RATIOS |
|
|
|
|
Current Ratio |
1,03 |
1,02 |
0,86 |
|
Immediate liquidity |
0,15 |
0,10 |
0,08 |
|
Treasury |
10.508,00 |
8.374,00 |
7.312,00 |
|
Sales on Current Assets |
577 |
594 |
796 |
Results Analysis
Ratios
|
|
31/12/2004 (12) |
31/12/2005 (12) |
31/12/2006 (12) |
|
Economic profitability (%) |
-8,54 |
-1,23 |
0,61 |
|
Operating Profitability (%) |
-8,86 |
-1,18 |
0,49 |
|
Equity gearing |
3,00 |
3,24 |
-9,10 |
|
Financial profitability (%) |
-13,83 |
0,07 |
-8,39 |
|
General Profitability (%) |
-5,99 |
0,02 |
-2,27 |
Comments on the Results
Analysis Ratios
The economic profitability in the year2005The economic profitability in
the year -1,23%, derived from a negative operating profitability of -1,18%.The
assets turnover was 1,04%.
The economic profitability in the year has improved from -8,54% up to
the current value, in spite of remaining in negative. This improvement has been
mainly due to the variation in operating profitability, from -8,86% to the
current level of -1,18% having also increased assets turnover to0,96 and 1,04%.
Financial profitability on 2005 achieved a 0,07%.
The company’s financial structure has restrained its financial
profitability with an indebtedness level of 3,24.
The general profitability on 2005 achieved a 0,02%.
The economic profitability in the year2006 achieved a 0,61% positive
level, due to a 0,49% economic margin and to an assets turnover of1,25%.
The economic profitability in the year has passed from a negative level
of -1,23% to its positive current value. This evolution is due to the obtaining
of positive operating profitability of 0,49% in comparison with the previous
negative level of -1,18%. Assets turnover has maintained stable in this period,
with an index of 1,25%.
Financial profitability on 2006The economic profitability in the year
-8,39
The company’s financial structure has endangered its profitability with
an indebtedness level -9,10.
The general profitability on 2006The economic profitability in the year
-2,27
SECTORIAL ANÁLYSIS
Large Capital Amounts and Financial Balance
Figures given in %
|
|
COMPANY (2006) |
SECTOR |
DIFFERENCE |
DIFFERENCE RELATIVE |
|
|
|
|
|
|
ASSETS |
|
|
|
|
|
|
|
|
|
|
A) DUE FROM
SHAREHOLDERS FOR UNCALLED CAPITAL |
|
0,00 |
|
|
|
|
|
|
|
|
B) FIXED ASSETS |
43,61 |
51,38 |
-7,77 |
-15,12 |
|
|
|
|
|
|
C) DEFERRED EXPENSES |
0,00 |
0,15 |
-0,15 |
-100,00 |
|
|
|
|
|
|
D) CURRENT ASSETS |
56,39 |
48,48 |
7,91 |
16,33 |
|
|
|
|
|
|
ASSETS (A + B + C + D) |
100 |
100 |
|
|
|
|
|
|
|
|
|
|
|
|
|
|
|
|
|
|
|
|
COMPANY (2006) |
SECTOR |
DIFFERENCE |
DIFFERENCE RELATIVE |
|
|
|
|
|
|
LIABILITIES |
|
|
|
|
|
|
|
|
|
|
A) SHAREHOLDERS
EQUITY |
33,74 |
48,78 |
-15,04 |
-30,83 |
|
|
|
|
|
|
B) DEFERRED
INCOME |
0,05 |
2,19 |
-2,14 |
-97,72 |
|
|
|
|
|
|
C) PROVISIONS
FOR LIABILITIES AND EXPENSES |
0,03 |
1,90 |
-1,87 |
-98,42 |
|
|
|
|
|
|
D) LONG TERM
LIABILITIES |
0,69 |
14,25 |
-13,56 |
-95,16 |
|
|
|
|
|
|
E) SHORT TERM
LIABILITIES |
65,49 |
32,71 |
32,78 |
100,20 |
|
|
|
|
|
|
F) SHORT TERM
PROVISIONS FOR LIABILITIES AND EXPENSES |
|
0,16 |
|
|
|
|
|
|
|
|
LIABILITIES (A + B + C + D + E + F) |
100 |
100 |
|
|
|
|
|
|
|
Sectorial Financial
Balance Comparison
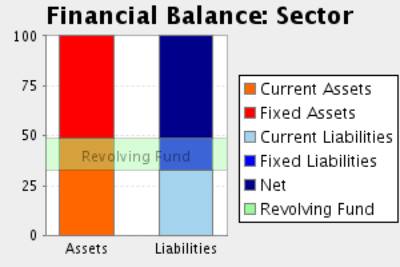
Comments to the Sectorial Analysis
In the 2006, the assets of the company were formed in 43,61% of fixed
assets and in 56,39Current Assets % In the sector, the proportion of fixed
assets was of 51,52%, 15,36% superior, and the proportion of current assets was
of 48,48%, 16,33% inferior.
The assets were financed in the company in 33,79% with own capitals , in
0,71% with fixed liabilities and in 65,49% with current liabilities In the
sector, the self financing represented 50,97%, 33,71% superior. On the other
hand the long term debts represented in the sector an average of 16,15%
financing, with a relative difference of 95,60% favourable to the sectorAnd,
short term liabilities represented in the sector an average of 32,88%
financing, with a relative difference of 99,21% in favour of the company
The result of this company’s financial structure is a turnover fund that
represents -9,10% of the total assets; in the sector, this same proportion is
15,60%, therefore, we can say that the company’s turnover fund is 158,33%
smaller than the sector one.
Analytical Account of Results
Figures given in %
|
|
COMPANY (2006) |
SECTOR |
DIFFERENCE |
DIFFERENCE RELATIVE |
|
Turnover |
94,93 |
98,63 |
-3,70 |
-3,75 |
|
Other operating income |
5,07 |
1,37 |
3,70 |
269,53 |
|
Production Value |
100,00 |
100,00 |
0,00 |
0,00 |
|
Operating expenses |
63,94 |
62,76 |
1,18 |
1,89 |
|
Other operation expenses |
27,45 |
17,19 |
10,26 |
59,66 |
|
Added value |
8,61 |
20,05 |
-11,44 |
-57,06 |
|
Labour cost |
5,39 |
9,96 |
-4,57 |
-45,87 |
|
Gross Economic Result |
3,22 |
10,09 |
-6,87 |
-68,10 |
|
Assets depreciation |
2,80 |
4,04 |
-1,24 |
-30,69 |
|
Variation in provision for current assets and bad debt losses |
-0,05 |
0,05 |
-0,10 |
-192,59 |
|
Net Economic Result |
0,46 |
6,00 |
-5,54 |
-92,33 |
|
Financial income |
1,04 |
1,29 |
-0,25 |
-19,25 |
|
Financial Charges |
2,92 |
1,20 |
1,72 |
142,52 |
|
Variation in financial investment provision |
|
0,02 |
|
|
|
Ordinary
Activities Result |
-1,42 |
6,07 |
-7,49 |
-123,41 |
|
Extraordinary income |
|
1,25 |
|
|
|
Extraordinary charges |
0,20 |
1,19 |
-0,99 |
-83,18 |
|
Variation in provision in fixed assets |
|
-0,44 |
|
|
|
Results before Taxes |
-1,62 |
6,57 |
-8,19 |
-124,66 |
|
Corporate taxes |
0,54 |
1,38 |
-0,84 |
-60,78 |
|
Net Result |
-2,16 |
5,19 |
-7,35 |
-141,59 |
|
Assets depreciation |
2,80 |
4,04 |
-1,24 |
-30,69 |
|
Change of Provisions |
-0,05 |
-0,37 |
0,32 |
-86,56 |
|
Net Self-Financing |
0,60 |
8,86 |
-8,26 |
-93,23 |
Main Ratios
|
|
COMPANY (2006) |
PTILE25 |
PTILE50 |
PTILE75 |
|
STRUCTURAL RATIOS |
|
|
|
|
|
Management fund |
-12.745,00 |
3.758,31 |
9.274,75 |
26.254,74 |
|
Management Fund
Requirement |
-20.057,00 |
-11.620,97 |
861,85 |
12.084,00 |
|
Indebtedness (%) |
66,21 |
42,33 |
56,06 |
70,85 |
|
External Funds on Net Worth |
1,96 |
0,73 |
1,28 |
2,43 |
|
GENERAL ACTIVITY RATIO |
|
|
|
|
|
Turnover Increase (%) |
24,00 |
0,94 |
4,80 |
12,09 |
|
Added value growth (%) |
21,94 |
-6,34 |
-0,98 |
11,33 |
|
Cash Flow |
1.102,00 |
3.138,57 |
5.436,32 |
17.880,25 |
|
Labour Productivity |
1,60 |
1,45 |
1,70 |
2,49 |
|
Assets turnover |
1,25 |
0,96 |
1,34 |
1,77 |
|
Breakdown Point |
181.614,96 |
55.730.018,47 |
88.305.143,40 |
205.401.967,45 |
|
Security Margin
of the Breakdown Point (%) |
1,28 |
2,23 |
12,51 |
22,24 |
|
ACTIVITY RATIOS |
|
|
|
|
|
Average Payment Period |
127 |
44 |
86 |
113 |
|
Average Collection Period |
77 |
72 |
91 |
107 |
|
Inventory Turnover Period |
70 |
21 |
35 |
51 |
|
SOLVENCY RATIOS |
|
|
|
|
|
Payback Capacity |
0,01 |
0,09 |
0,17 |
0,28 |
|
Assets Guarantee |
1,51 |
1,41 |
1,78 |
2,36 |
|
Short Term Debts Proportion (%) |
98,92 |
62,98 |
90,42 |
97,23 |
|
Interest Coverage |
-1,68 |
2,77 |
7,70 |
24,45 |
|
LIQUIDITY RATIOS |
|
|
|
|
|
Current Ratio |
0,86 |
1,08 |
1,33 |
1,71 |
|
Immediate liquidity |
0,08 |
0,02 |
0,09 |
0,33 |
|
Treasury |
7.312,00 |
-2.403,18 |
1.043,04 |
7.671,43 |
|
Sales on Current Assets |
796 |
655 |
856 |
1.105 |
Results Analysis
Ratios
|
|
COMPANY (2006) |
PTILE25 |
PTILE50 |
PTILE75 |
|
Economic profitability (%) |
0,61 |
1,38 |
5,41 |
11,19 |
|
Operating Profitability (%) |
0,49 |
1,05 |
3,64 |
7,58 |
|
Equity gearing |
-9,10 |
1,55 |
2,16 |
3,23 |
|
Financial profitability (%) |
-8,39 |
2,77 |
9,86 |
17,50 |
|
General Profitability (%) |
-2,27 |
0,62 |
3,04 |
6,62 |
NOTES
Linked by its board members to (A82405549)
DYNASOL GESTION SA
FOREIGN EXCHANGE
RATES
|
Currency |
Unit
|
Indian Rupees |
|
US Dollar |
1 |
Rs.42.28 |
|
UK Pound |
1 |
Rs.82.79 |
|
Euro |
1 |
Rs.65.69 |
RATING
EXPLANATIONS
|
RATING |
STATUS |
PROPOSED CREDIT LINE |
|
|
>86 |
Aaa |
Possesses an extremely sound financial base with the strongest
capability for timely payment of interest and principal sums |
Unlimited |
|
71-85 |
Aa |
Possesses adequate working capital. No caution needed for credit
transaction. It has above average (strong) capability for payment of interest
and principal sums |
Large |
|
56-70 |
A |
Financial & operational base are regarded healthy. General unfavourable
factors will not cause fatal effect. Satisfactory capability for payment of
interest and principal sums |
Fairly Large |
|
41-55 |
Ba |
Overall operation is considered normal. Capable to meet normal
commitments. |
Satisfactory |
|
26-40 |
B |
Unfavourable & favourable factors carry similar weight in credit
consideration. Capability to overcome financial difficulties seems
comparatively below average. |
Small |
|
11-25 |
Ca |
Adverse factors are apparent. Repayment of interest and principal sums
in default or expected to be in default upon maturity |
Limited with
full security |
|
<10 |
C |
Absolute credit risk exists. Caution needed to be exercised |
Credit not
recommended |
|
NR |
In view of the lack of information, we have no basis upon which to
recommend credit dealings |
No Rating |
|
This score serves as a reference to assess SC’s credit risk
and to set the amount of credit to be extended. It is calculated from a composite
of weighted scores obtained from each of the major sections of this report. The
assessed factors and their relative weights (as indicated through %) are as
follows:
Financial
condition (40%) Ownership
background (20%) Payment
record (10%)
Credit history
(10%) Market trend
(10%) Operational
size (10%)