![]()
MIRA
INFORM REPORT
|
Report Date : |
14.08.2008 |
IDENTIFICATION
DETAILS
|
Name : |
IN SITU SA |
|
|
|
|
Registered Office : |
Street De Valportillo Primera - P I
Alcobendas, 2, Cp 28108, Alcobendas Madrid |
|
|
|
|
Country : |
Spain |
|
|
|
|
Financials (as on) : |
28.02.2007 |
|
|
|
|
Date of Incorporation : |
|
|
|
|
|
Legal Form : |
Joint Stock Company |
|
|
|
|
Line of Business : |
RATING & COMMENTS
|
MIRA’s Rating : |
A |
|
RATING |
STATUS |
PROPOSED CREDIT LINE |
|
|
56-70 |
A |
Financial & operational base are regarded healthy. General
unfavourable factors will not cause fatal effect. Satisfactory capability for
payment of interest and principal sums |
Fairly Large |
|
Maximum Credit Limit : |
399.000,00 € |
|
|
|
|
Status : |
Good |
|
|
|
|
Payment Behaviour : |
Regular |
|
|
|
|
Litigation : |
Clear |
FINANCIAL
REPORT
IN SITU SA
TAX NUMBER: A78234747
EXECUTIVE
SUMMARY
Identification
Current Business Name: IN SITU SA
Commercial Name: IN SITU
Other names: YES
Current Address: STREET DE
VALPORTILLO PRIMERA - P I
ALCOBENDAS, 2, CP 28108, ALCOBENDAS MADRID
Branches: 1
Telephone number: 914844400 Fax: 916623588
URL: www.trucco.es Corporate e-mail: info@trucco.es
Commercial
Risk
Credit Appraisal: 399.000,00 €
Legal Actions: NO
Financial
Information
Latest Balance sheet sales (2007): 24.822.337,97 € (MERCANTILE REGISTER)
Result: 301.879,64 €
Total Assets: 16.502.437,58 €
Social Capital: 961.600,00 €
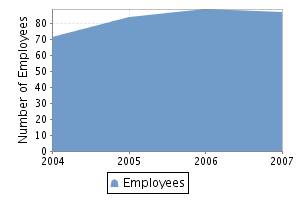
Employees: 87
Commercial
Information
Constitution Date: 20/12/1985
Business activity: Mfg. of outerwear
NACE Code: 1822
International Operations: Imports and Exports
Corporate
Structure
Sole Administrator:
Parent Company:
Participations: 1
Other
Complementary Information
Latest proceeding published in BORME: 05/03/2008 Re-elections
Latest press article: 15/10/2006 EL PAIS (BRANCHES INFORMATION)
Bank Entities: Yes
Credit
Appraisal
Favourable to 399.000,00 €
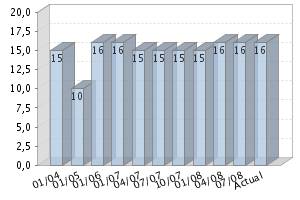
Rating
Evolution
Financial
Situation
Fiscal year2007
|
Treasury |
Very good |
|
Indebtedness |
Important |
|
Profitability |
Average |
|
Balance |
Excellent |
Performance
|
Legal Actions |
None or Negligible |
|
Business Trajectory |
Excellent |
INCIDENTS 
Summary
LEGAL ACTIONS: No legal incidences registered
CLAIM FILED AGAINST THE ADMINISTRATION: No administrative claims registered
AFFECTED BY: No significant element.
FINANCIAL
ELEMENTS AND SECTORIAL COMPARATIVE
FINANCIAL ELEMENTS
Figures given in €
|
|
2005 (12) |
2006 (12) |
2007 (12) |
% ASSETS |
|
|
|
|
|
|
BALANCE SHEET ANALYSIS |
|
|
|
|
|
|
|
|
|
|
OWN FUNDS |
2.514.787,56 |
2.758.861,43 |
3.049.572,45 |
18,48 |
|
|
|
|
|
|
DEBT |
11.061.411,79 |
13.238.078,07 |
13.452.865,13 |
81,52 |
|
|
|
|
|
|
FIXED ASSETS |
4.792.113,91 |
3.871.697,68 |
3.414.489,21 |
20,69 |
|
|
|
|
|
|
TOTAL ASSETS |
13.576.199,35 |
15.996.939,50 |
16.502.437,58 |
|
|
|
|
|
|
|
|
|
|
|
|
|
|
|
|
|
|
|
2005 (12) |
2006 (12) |
2007 (12) |
% SALES |
|
|
|
|
|
|
PROFIT AND LOSS ACCOUNT ANALYSIS |
|
|
|
|
|
|
|
|
|
|
SALES |
20.491.491,51 |
24.478.734,17 |
24.822.337,97 |
|
|
|
|
|
|
|
ADDED VALUE |
3.092.640,16 |
3.528.557,31 |
3.308.443,86 |
13,33 |
|
|
|
|
|
|
EBITDA |
1.382.747,28 |
1.291.501,42 |
1.255.894,85 |
5,06 |
|
|
|
|
|
|
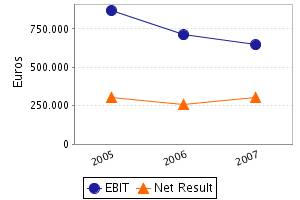
EBIT |
868.984,52 |
710.820,33 |
646.158,33 |
2,60 |
|
|
|
|
|
|
NET RESULT |
305.125,82 |
255.242,49 |
301.879,64 |
1,22 |
|
|
|
|
|
Balance Sheets Items Analysis
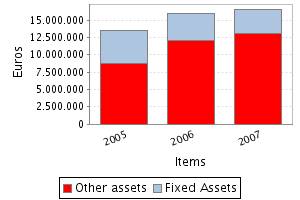
Balance Sheet Comments
Total assets of the company grew 17,83% between
2005 and 2006.
In spite of the assets’ growth, the fixed assets
decreased 19,21%.
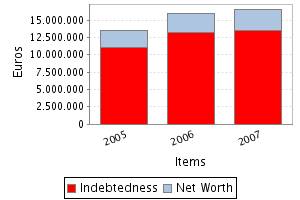
This growth has been mainly financed with a debt
increase of 19,68%. Nevertheless the net worth increased 9,71%.
Total assets of the company grew 3,16% between
2006 and 2007.
In spite of the assets’ growth, the fixed assets
decreased 11,81%.
This growth has been financed, on a wider scale,
with a Shareholders’ equity increase of 10,54% and in a smaller proportion with
an debt increase of 1,62%.
Profit
and Loss Account Analysis
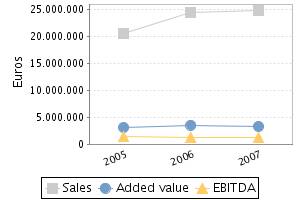
Profit and Loss Account Comments
The company’s sales figure grew 19,46% between
2005 and 2006.
The company’s EBIT decreased in 18,20% between
2005 and 2006.
This evolution implies a reduction in the
company’s operating profitability.
The result of these variations is a decrease of
the company’s Economic Profitability of 30,58% in the analysed period, being
this profitability of 4,44% in the year 2006.
The company’s Net Result decreased in 16,35%
between 2005 and 2006.
This evolution, compared to the EBIT’s
performance, implies that the financial and extraordinary activities have had a
positive effect in the company’s Financial Profitability.
The result of these variations is a reduction of
the company’s profitability of 23,75% in the analysed period, being equal to
9,25% in the year 2006.
The company’s sales figure grew 1,40% between
2006 and 2007.
The company’s EBIT decreased in 9,10% between
2006 and 2007.
This evolution implies a reduction in the
company’s operating profitability.
The result of these variations is a decrease of
the company’s Economic Profitability of 11,88% in the analysed period, being
this profitability of 3,92% in the year 2007.
The company’s Net Result grew 18,27% between
2006 and 2007.
This evolution, compared to the EBIT’s
performance, implies that the financial and extraordinary activities have had a
positive effect in the company’s Financial Profitability.
The result of these variations is an increase of
the company’s Economic Profitability of 7,00% in the analysed period, being
equal to 9,90% in the year 2007.
ANNUAL
FINANCIAL REPORT ADDITIONAL DATA
Source: annual financial
report 2007
Results Distribution
Figures given in €
|
DISTRIBUTION BASE |
DISTRIBUTION TO |
||
|
Profit and Loss |
301.879,64 |
Retained earnings |
30.187,96 |
|
Carry Over |
0,00 |
Voluntary Reserve |
271.691,68 |
|
Voluntary reserves |
0,00 |
Prior years losses |
0,00 |
|
Reserves |
0,00 |
Carry Over |
0,00 |
|
Other concepts |
0,00 |
Other funds |
0,00 |
|
Total of Amounts to be distributed |
301.879,64 |
Dividends |
0,00 |
|
|
|
Other Applications |
0,00 |
Auditing
Auditors’ opinion: FAVOURABLE
Auditor: AUDIT S.L.
(AUDITORES ASESORES)
COMPARATIVE
SECTOR ANALYSIS
Values table
Figures expressed in %
|
|
COMPANY (2007) |
SECTOR |
DIFFERENCE |
DIFFERENCE RELATIVE |
|
|
|
|
|
|
BALANCE SHEET ANALYSIS: % on the total assets |
|
|
|
|
|
|
|
|
|
|
OWN FUNDS |
18,48 |
46,76 |
-28,28 |
-60,48 |
|
|
|
|
|
|
DEBT |
81,52 |
53,24 |
28,28 |
53,11 |
|
|
|
|
|
|
FIXED ASSETS |
20,69 |
26,18 |
-5,49 |
-20,97 |
|
|
|
|
|
|
|
|
|
|
|
|
|
|
|
|
|
|
COMPANY (2007) |
SECTOR |
DIFFERENCE |
DIFFERENCE RELATIVE |
|
|
|
|
|
|
PROFIT AND LOSS ACCOUNT ANALYSIS: % on the total
operating income |
|
|
|
|
|
|
|
|
|
|
SALES |
98,16 |
98,52 |
-0,36 |
-0,36 |
|
|
|
|
|
|
ADDED VALUE |
13,08 |
22,59 |
-9,51 |
-42,09 |
|
|
|
|
|
|
EBIT |
2,56 |
5,45 |
-2,90 |
-53,15 |
|
|
|
|
|
|
NET RESULT |
1,19 |
3,33 |
-2,14 |
-64,16 |
|
|
|
|
|
Sector Composition
Compared sector (NACE): 182
Number of companies: 77
Size (Sales Figure) : 7.000.000,00 - 40.000.000,00 Euros
Comments on the sectorial comparative
Compared to its sector the assets of the
companies show an inferior proportion of fixed assets. Specifically the
difference with the sector average is -5,49% , which means a relative
difference of -20,97% .
In liabilities composition the company appeals
on a wider scale to self financing, being the proportion of net worth of 28,28%
inferior, which means a relative difference of 60,48% 28,28% more than the
sector, which means a difference of 53,11% .
The proportion that the sales mean to the
company’s total ordinary income is 98,16%, 0,36% lower than in the sector,
which means a relative difference of 0,36% .
The company’s EBIT was positive and was 2,56%
with regard to the total ordinary income, 2,90% less than the sector, which
means a relative difference of 53,15% .
The company’s capacity to generate operating
income is equal to that of the sector as its ratio EBIT/Sales is also equal.
The company’s net result was positive and equal
to 1,19% with regard to the total ordinary income, 2,14% less than the sector,
which means a relative difference of 64,16% .
The financial and extraordinary results and the
tax impact have had a negative impact on the Net result in the company with a
worse behaviour than in the sector; as a consequence, the company shows a worse
Net Result/EBIT ratio (REBEmpresa vs. REBSector).
ADDRESSES
Current Legal Seat Address:
STREET DE VALPORTILLO PRIMERA - P I
ALCOBENDAS, 2
28108 ALCOBENDAS MADRID
Previous Seat Address:
STREET OLIVOS, 9
28003 MADRID
Characteristics of the current address
Type of premises: store
Property: owned; with no official confirmation
Local Situation: main
Branches 
|
STREET |
POSTAL CODE |
TOWN |
PROVINCE |
|
STREET RAFAEL PILLADO
MOURELLE 3 |
28110 |
ALGETE |
Madrid |
1 branches registered
CORPORATE
STRUCTURE
ADMINISTRATIVE LINKS
Main Board members, Directors and Auditor ![]()
|
POSITION |
SURNAMES AND NAME |
APPOINTMENT DATE |
|
|
SOLE ADMINISTRATOR |
REGUERO MANJON FERNANDO |
21/02/2005 |
|
|
AUDITOR |
APPOINTMENT DATE |
||
|
AUDIT SL |
05/03/2008 |
||
Functional Managers
|
POSITION |
SURNAMES AND NAME |
|
General Manager |
REGUERO FERNANDO |
|
Financial Manager |
BELTRAN SERGIO |
|
Human Resources Manager |
LOPEZ NURIA |
|
Marketing Manager |
SANUDO MARIA |
FINANCIAL
LINKS
|
|
BUSINESS NAME |
CIF / COUNTRY |
% |
SOURCE |
DATA INF. |
|
|
REGUERO MANJON FERNANDO |
|
Major. |
OWN SOURCES |
04/03/2008 |
|
|
ARIADNA AGRICOLA S.L. |
B60400355 |
20,00 |
OWN SOURCES |
04/03/2008 |
|
|
DIEZ TELLO PILAR |
|
Indet. |
OWN SOURCES |
04/03/2008 |
|
|
BUSINESS NAME |
CIF / COUNTRY |
% |
SOURCE |
DATA INF. |
|
|
THEARPLUS |
PORTUGAL |
100,00 |
TRADE REG. |
28/02/2006 |
CREDIT
INFORMATION
Constitution Date: 20/12/1985
Foundation Date: 01/01/1985
Business
activity 
Activity: Mfg. of outerwear
NACE Code: 1822
NACE Activity: Manufacture of other outerwear
Business: CONFECCION DE PRENDAS DE VESTIR PARA SENORA, CABALLERO O NINOS, CON
CUALESQUIERA GENEROS NACIONALES O EXTRANJEROS. DISTRIBUCION DE LOS PRODUCTOS
FABRICADOS POR LA SOCIEDAD SE REALIZA POR DOS VIAS, UNA PARTE A TRAVES DE C
Employees 
Number of total employees: 87 (2008)
Number of fixed employees: 100,00%
Number of temporary employees: 0,00%
Employees
evolution
COMMERCIAL
OPERATIONS 
PURCHASES
Payments (estimated):
Import Percentage: 35%
Imports from: Mercado Comun y China
SALES
Collection (estimated):
Cash sales percentage: 50%
On a credit basis: 50%
Export Percentage: 2%
Exports to: MEXICO,SUDAMERICA,PAISES ARABES
National Distribution: 98%
CLIENTS
|
BUSINESS NAME |
INTERNATIONAL |
|
TELL TRAINING SA |
NO |
|
BISSET COMPANY SA |
NO |
|
LUNARES SL |
NO |
|
CETERIS PARABUS SL |
NO |
4 clientes
Banks 
|
ENTITY |
BRANCH |
ADDRESS |
TOWN OR CITY |
PROVINCE |
|
BANCO ESPAÑOL DE CREDITO, S.A. |
|
|
ALCOBENDAS |
|
|
BANCO PASTOR, S.A. |
|
|
ALCOBENDAS |
|
|
BANCO BILBAO VIZCAYA ARGENTARIA, S.A. |
0086 |
GRAN VIA, 1 |
BILBAO |
Vizcaya |
|
BANCO POPULAR ESPAÑOL, S.A. |
|
|
MADRID |
|
|
BANCO SANTANDER, S.A. |
|
|
MADRID |
|
7 bank entities registered
Brands,
Signs and Commercial Names 
Brand name: ENTRETELAS (Valid)
Type: JOINT
Date: 24/08/2000
Brand name: TRUCCO (Valid)
Type: DENOMINATIVE
Date: 19/12/1997
LEGAL
STRUCTURE
Constitution Data
Register Date: 20/12/1985
Current
structure data 
Current Legal Form: JOINT STOCK COMPANY
Current Capital: 961.600,00 €
Legal
Aspects
Obligation to fill in Financial
Statements: YES
Chamber census: YES (2006)
Listed on a Stock Exchange: NO
B.O.R.M.E.(Official
Companies Registry Gazette) 
Registered Proceedings
|
PROCEEDINGS |
DATE |
NOTICE NUM. |
TRADE REG. |
|
Re-elections |
05/03/2008 |
124627 |
Madrid |
|
Appointments |
18/10/2007 |
522360 |
Madrid |
|
Re-elections |
26/02/2007 |
113684 |
Madrid |
Other Proceedings published
|
PROCEEDINGS |
DATE |
NOTICE NUM. |
TRADE REG. |
|
Registration of
accounts (2007) Individual |
21/11/2007 |
1053926 |
Madrid |
|
Registration of
accounts (2006) Individual |
14/11/2006 |
880446 |
Madrid |
Press
articles 
15/10/2006 EL PAIS (BRANCHES
INFORMATION)
LA CADENA DE MODA FEMENINA TRUCCO, FUNDADA EN
1985, HA AUMENTADO SU RED DE 65 A 116 TIENDAS. ACTUALMENTE, TIENE YA 47 TIENDAS
EN EL EXTRANJERO, CASI EL TRIPLE QUE 3 AÑOS ATRAS. PRESENTE EN MEXICO, CON 35
CORNERS, Y EN OTROS PAISES, EL OBJETIVO DE TRUCCO ES ABRIR EN EL EXTERIOR. LA
CIA. CENTRARA EL CRECIMIENTO EN ASIA (CHINA, COREA, SINGAPUR, MALASIA Y JAPON),
EN EUROPA DEL ESTE (DONDE YA ESTA EN POLONIA), EN ORIENTE PROXIMO Y EN
LATINOAMERICA, DONDE ADEMAS DE CRECER EN MEXICO, ENTRARA EN CHILE. ASIMISMO,
INICIA NEGOCIACIONES PARA DESEMBARCAR EN EL REINO UNIDO, FRANCIA E ITALIA.
13/11/2005 EL PAIS (BRANCHES
INFORMATION)
LA CADENA DE MODA TRUCCO DISPONE DE 110 PUNTOS
DE VENTA, 90 EN ESPAÑA, SI BIEN SE PREPARA PARA CONQUISTAR EL MERCADO
INTERNACIONAL. A FINALES DE LOS 90, LA CIA. DESEMBARCO EN PORTUGAL, YA DISPONE
DE 20 ESQUINAS EN UNA CADENA DE GRANDES ALMACENES EN MEXICO Y OTRO FOCO DE
EXPANSION SERAN LOS PAISES DEL GOLFO Y EL SUR DE ASIA. ADEMAS, LA CIA. ESTA A
PUNTO DE ABRIR ESQUINAS TAMBIEN EN SINGAPUR Y EN CHINA. TRUCCO FACTURARA ESTE
AÑO 41,6 MM. DE EUROS, UN 39% MAS QUE LOS 29,8 MM. DE 2003.
Complementary
Information
El balance cerrado a
28/02/2001 (Deposito 2001) esta disponible en
INFORMA, pero no ha sido cargado por tener una duracion inferior a
tres meses, por cambios en la fecha de cierre.
FINANCIAL
INFORMATION
The information on the last account contained in
this report is extracted from the Mercantile Register file of the legal address
of the Company and dated 03/01/2008.
BALANCE SHEET
Assets
Figures given in €
|
|
28/02/2005 (12) |
28/02/2006 (12) |
28/02/2007 (12) |
|
A) DUE FROM SHAREHOLDERS
FOR UNCALLED CAPITAL |
|
|
|
|
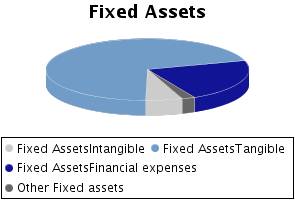
B) FIXED ASSETS |
4.792.113,91 |
3.871.697,68 |
3.414.489,21 |
|
I. Incorporation costs |
5.549,56 |
96.884,09 |
72.785,02 |
|
II. Intangible fixed assets |
661.922,73 |
454.361,88 |
199.198,05 |
|
R & D expenses |
153.682,02 |
154.329,93 |
203.430,06 |
|
Concessions, patents, licences , trademarks |
554.496,07 |
554.496,07 |
554.496,07 |
|
Goodwill |
|
|
|
|
Acquired rights from finance leases |
|
|
|
|
Software |
580.637,69 |
635.782,49 |
158.958,18 |
|
Leasing |
52.484,45 |
52.484,45 |
52.484,45 |
|
Cash advance |
|
|
|
|
Provisions |
|
|
|
|
Depreciation |
-679.377,50 |
-942.731,06 |
-770.170,71 |
|
III. Tangible fixed
assets |
2.111.422,88 |
2.255.102,31 |
2.396.978,06 |
|
Property, plant and equipment |
1.104.140,56 |
1.104.140,56 |
1.104.140,56 |
|
Machinery, equipment and other |
324.451,38 |
570.455,86 |
590.662,37 |
|
Other property plant and equipment |
1.268.363,45 |
1.338.942,27 |
1.659.365,94 |
|
Prepaid expenses on fixed assets |
66.205,86 |
16.906,34 |
138.835,25 |
|
Other assets |
550.777,41 |
728.497,64 |
750.210,20 |
|
Provisions |
|
|
|
|
Depreciation |
-1.202.515,78 |
-1.503.840,36 |
-1.846.236,26 |
|
IV. Financial fixed
assets |
2.013.218,74 |
1.065.349,40 |
745.528,08 |
|
Shares in affiliated companies |
|
|
|
|
Receivables in affiliated companies |
|
|
|
|
Shares in associated companies |
|
|
|
|
Loans to associated companies |
|
|
|
|
Securities |
969.973,77 |
969.973,77 |
969.973,77 |
|
Other loans |
1.422.415,71 |
722.415,71 |
722.415,71 |
|
Long term deposits and guarantees |
1.011,26 |
3.062,92 |
6.062,92 |
|
Provisions |
-380.182,00 |
-630.103,00 |
-952.924,32 |
|
Taxes receivable |
|
|
|
|
V.Owners equity |
|
|
|
|
VI.Long term trade
liabilities |
|
|
|
|
C) DEFERRED EXPENSES |
11.070,47 |
9.878,14 |
9.155,23 |
|
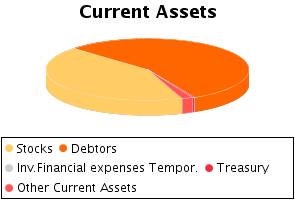
D) CURRENT ASSETS |
8.773.014,97 |
12.115.363,68 |
13.078.793,14 |
|
I. Shareholders by
required outlays |
|
|
|
|
II. Stocks |
4.512.576,18 |
5.095.373,74 |
5.585.567,96 |
|
Goods available for sale |
|
|
3.858.214,92 |
|
Raw material inventory |
1.867.509,38 |
1.468.411,52 |
1.643.141,44 |
|
Work in Progress |
|
|
50.126,05 |
|
Finished goods |
2.549.692,97 |
3.594.620,93 |
|
|
Subproducts and recycled materials |
|
|
|
|
Cash advance |
95.373,83 |
32.341,29 |
34.085,55 |
|
Provisions |
|
|
|
|
III. Debtors |
4.059.832,48 |
6.540.460,02 |
7.214.409,61 |
|
Clients |
1.584.084,38 |
2.478.847,22 |
2.625.261,31 |
|
Amounts owned by affiliated companies |
1.841.283,52 |
2.079.752,47 |
2.884.345,31 |
|
Amounts owned by associated companies |
|
|
|
|
Other debts |
533.220,52 |
1.820.314,00 |
1.699.896,42 |
|
Staff Expenses |
|
|
|
|
Government |
141.713,71 |
161.699,63 |
55.059,87 |
|
Provisions |
-40.469,65 |
-153,30 |
-50.153,30 |
|
IV. Temporary financial
investment |
67.351,00 |
20.009,53 |
5.884,87 |
|
Shares in affiliated companies |
|
|
|
|
Receivables in affiliated companies |
|
|
|
|
Shares in associated companies |
|
|
|
|
Loans to associated companies |
|
|
|
|
Short term investment |
4.158,00 |
4.158,00 |
|
|
Other loans |
58.333,34 |
11.694,20 |
27,54 |
|
Short Term Deposit and guarantees |
4.859,66 |
4.157,33 |
5.857,33 |
|
Provisions |
|
|
|
|
V. Short-term own shares |
|
|
|
|
VI. Treasury |
93.060,07 |
104.942,75 |
47.265,98 |
|
VII. Periodification
adjustments |
40.195,24 |
354.577,64 |
225.664,72 |
|
ASSETS (A + B + C + D) |
13.576.199,35 |
15.996.939,50 |
16.502.437,58 |
Assets composition
Liabilities
Figures given in €
|
|
28/02/2005 (12) |
28/02/2006 (12) |
28/02/2007 (12) |
|
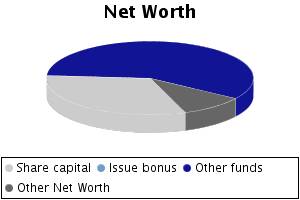
A) SHAREHOLDERS EQUITY |
2.470.113,10 |
2.725.355,59 |
3.027.235,23 |
|
I. Share capital |
961.600,00 |
961.600,00 |
961.600,00 |
|
II. Issue bonus |
|
|
|
|
III.Revaluation reserve |
|
|
|
|
IV.Reserves |
1.203.387,28 |
1.508.513,10 |
1.763.755,59 |
|
Retained earnings |
219.185,90 |
78.354,21 |
103.878,46 |
|
Sinking fund from owner equity |
|
|
|
|
Reserve for the parent company capital |
|
|
|
|
Statutory reserve |
|
|
|
|
Other funds |
984.201,34 |
1.430.158,85 |
1.659.877,09 |
|
Capital adjustments in Euros |
0,04 |
0,04 |
0,04 |
|
V.Results from previous
years |
|
|
|
|
Carry Over |
|
|
|
|
Prior years losses |
|
|
|
|
Loans from partners for losses compensation |
|
|
|
|
VI.Profit and Losses |
305.125,82 |
255.242,49 |
301.879,64 |
|
VII.Dividend paid during
the year |
|
|
|
|
VIII.Own shares for
capital reduction |
|
|
|
|
B) DEFERRED INCOME |
44.674,46 |
33.505,84 |
22.337,22 |
|
Capital grants |
44.674,46 |
33.505,84 |
22.337,22 |
|
Positive change difference |
|
|
|
|
Other deferred income |
|
|
|
|
Fiscal deferred income |
|
|
|
|
C) PROVISIONS FOR
LIABILITIES AND EXPENSES |
|
|
|
|
Provision for pensions plans |
|
|
|
|
Provision for taxes |
|
|
|
|
Other provisions |
|
|
|
|
Reversion fund |
|
|
|
|
D) LONG TERM LIABILITIES |
3.633.714,69 |
3.440.586,89 |
3.387.264,63 |
|
I.Negotiable bonds and other negotiable values |
|
|
|
|
Non convertible securities |
|
|
|
|
Convertible securities |
|
|
|
|
Other convertible debentures |
|
|
|
|
II.Debt with bank
entities |
2.470.745,95 |
2.204.346,94 |
2.290.246,23 |
|
Long term bank loans |
2.470.745,95 |
2.204.346,94 |
2.290.246,23 |
|
Leasing |
|
|
|
|
III.Debts with associated
and affiliated companies |
|
|
|
|
With affiliated companies |
|
|
|
|
Associated companies |
|
|
|
|
IV. Other creditors |
1.162.968,74 |
1.236.239,95 |
1.097.018,40 |
|
Bills payable |
|
|
|
|
Other debts |
1.162.968,74 |
1.236.239,95 |
1.097.018,40 |
|
Long term deposit and guaranties |
|
|
|
|
Taxes receivable |
|
|
|
|
V. Deferred debts on
shares |
|
|
|
|
From affiliated companies |
|
|
|
|
From associated companies |
|
|
|
|
Other companies |
|
|
|
|
VI. Long term debt with
creditor |
|
|
|
|
E) SHORT TERM LIABILITIES |
7.427.697,10 |
9.797.491,18 |
10.065.600,50 |
|
I.Negotiable bonds and
other negotiable values |
|
|
|
|
Non convertible securities |
|
|
|
|
Convertible securities |
|
|
|
|
Other convertible debentures |
|
|
|
|
Interests from bonds |
|
|
|
|
II.Debt with bank
entities |
3.475.892,28 |
5.932.066,53 |
6.149.614,20 |
|
Loans and other debts |
3.427.449,28 |
5.922.834,62 |
6.133.910,00 |
|
Debt interest |
9.357,86 |
9.231,91 |
6.317,59 |
|
Leasing |
39.085,14 |
|
9.386,61 |
|
III. Short term debts
with associated and affiliated companies |
386.440,66 |
|
|
|
With affiliated companies |
386.440,66 |
|
|
|
Associated companies |
|
|
|
|
IV. Commercial creditors |
3.302.466,03 |
3.625.193,20 |
3.727.794,65 |
|
Accounts payable |
|
|
|
|
Expenses |
1.932.562,20 |
2.155.604,92 |
2.765.117,22 |
|
Bills payable |
1.369.903,83 |
1.469.588,28 |
962.677,43 |
|
V. Other non-commercial
debt |
262.898,13 |
240.231,45 |
188.191,65 |
|
Government |
171.267,66 |
136.668,70 |
81.986,61 |
|
Bills payable |
|
|
|
|
Other debts |
18.051,58 |
20.723,00 |
17.521,04 |
|
Accounts receivable |
73.578,89 |
82.839,75 |
88.684,00 |
|
Short term deposits and guarantees |
|
|
|
|
VI. Provisions for
current assets |
|
|
|
|
VII. Periodification
adjustments |
|
|
|
|
F) SHORT TERM PROVISIONS
FOR LIABILITIES AND EXPENSES |
|
|
|
|
LIABILITIES (A + B + C +
D + E + F) |
13.576.199,35 |
15.996.939,50 |
16.502.437,58 |
Liabilities Composition
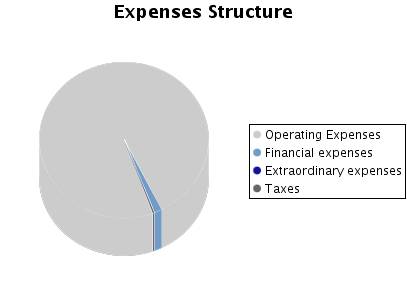
PROFIT
AND LOSS ACCOUNT
Itams of the Profit and Loss Account
Figures given in €
|
|
28/02/2005 (12) |
28/02/2006 (12) |
28/02/2007 (12) |
|
A) EXPENSES (A.1 a A.16) |
20.848.035,08 |
26.150.173,92 |
25.412.292,82 |
|
A.1.Reduction in stocks
of finished goods and work in progress |
|
|
|
|
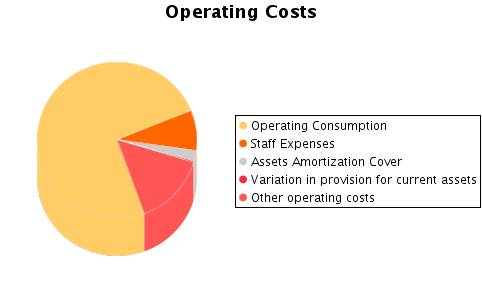
A.2.Supplies |
14.112.816,39 |
18.742.518,52 |
18.338.797,08 |
|
Material consumed |
10.663.196,62 |
|
14.811.678,74 |
|
Raw materials consumed |
|
15.253.838,97 |
|
|
Other expenses |
3.449.619,77 |
3.488.679,55 |
3.527.118,34 |
|
A.3. Labour cost |
1.709.892,88 |
2.237.055,89 |
2.052.549,01 |
|
Wages |
1.309.803,23 |
1.755.601,28 |
1.591.704,42 |
|
Social security expenses |
400.089,65 |
481.454,61 |
460.844,59 |
|
A.4. Assets depreciation |
513.762,76 |
572.469,60 |
545.461,16 |
|
A.5.Variance in the
traffic provisions |
|
8.211,49 |
64.275,36 |
|
Variance in provision for inventory |
|
|
|
|
Variance in provision for bad debts |
|
8.211,49 |
64.275,36 |
|
Variance in provision for other current assets |
|
|
|
|
A.6. Other operating
costs |
3.882.554,20 |
3.999.784,97 |
3.640.322,87 |
|
External costs |
3.759.468,34 |
3.968.190,59 |
3.614.923,36 |
|
Taxes |
123.085,86 |
31.594,38 |
25.399,51 |
|
Other day to day expenses |
|
|
|
|
Allowance to reversion fund |
|
|
|
|
A.I.OPERATING RESULT (B.1+B.2+B.3+B.4-A.1-A.2-A.3-A.4-A.5-A.6) |
868.984,52 |
710.820,33 |
646.158,33 |
|
A.7.Financial expenses
and similar |
193.203,90 |
244.269,11 |
344.629,61 |
|
Debts with related companies |
|
|
|
|
Debts with associated companies |
|
|
|
|
Other companies debts By debts with third
parties and similar expenses |
193.203,90 |
244.269,11 |
344.629,61 |
|
Losses from financial investments |
|
|
|
|
A.8. Variation in
financial investment provision |
|
|
|
|
A.9.Negative exchange
difference |
11.089,81 |
23.433,71 |
34.967,08 |
|
A.II.POSITIVE FINANCIAL
RESULTS (B.5+B.6+B.7+B.8-A.7-A.8-A.9) |
|
|
|
|
A.III.PROFIT FROM
ORDINARY ACTIVITIES (A.I+A.II-B.I-B.II) |
713.462,78 |
505.518,55 |
329.460,49 |
|
A.10. Variation in provision in fixed assets |
241.022,00 |
249.921,00 |
322.821,32 |
|
A.11. Losses in fixed assets |
82.103,61 |
1.191,03 |
2.271,23 |
|
A.12. Losses from own shares and bonds |
|
|
|
|
A.13. Extraordinary charges |
531,00 |
5.586,18 |
4.571,24 |
|
A.14.Other exercises’ expenses and losses |
9.797,32 |
11.347,96 |
|
|
A.IV.POSITIVE EXTRAORDINARY RESULT
(B.9+B.10+B.11+B.12+B.13-A.10-A.11-A.12-A.13-A.14) |
|
|
34.046,01 |
|
A.V.PROFIT BEFORE TAXES (A.III+A.IV-B.III-B.IV) |
396.387,03 |
309.626,95 |
363.506,50 |
|
A.15.Corporate Taxes |
91.261,21 |
54.384,46 |
61.626,86 |
|
A.16. Other taxes |
|
|
|
|
A.VI.EXERCISE RESULT (PROFIT) (A.V-A.14-A.15) |
305.125,82 |
255.242,49 |
301.879,64 |
|
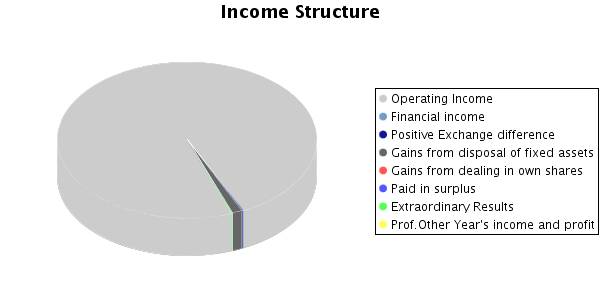
B) INCOMES (B.1 a B13) |
21.153.160,90 |
26.405.416,41 |
25.714.172,46 |
|
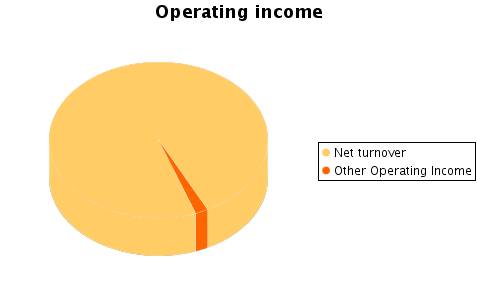
B.1. Turnover |
20.491.491,51 |
24.478.734,17 |
24.822.337,97 |
|
Sales |
20.398.377,29 |
24.943.152,73 |
26.312.048,91 |
|
Services provided |
756.580,35 |
798.568,12 |
410.399,67 |
|
Refunds and sale reminders |
-663.466,13 |
-1.262.986,68 |
-1.900.110,61 |
|
B.2.Increase in inventory of finished goods and works in progress |
330.137,00 |
1.227.937,00 |
|
|
B.3.Expenses capitalized |
|
|
|
|
B.4. Other operating income |
266.382,24 |
564.189,63 |
465.225,84 |
|
Other incomes |
250.778,04 |
557.035,49 |
462.225,84 |
|
Grants |
15.604,20 |
7.154,14 |
3.000,00 |
|
Excess in provision for liabilities and charges |
|
|
|
|
B.I.OPERATING LOSSES (A.1+A.2+A.3+A.4+A.5+A.6-B.1-B.2-B.3-B.4) |
|
|
|
|
B.5.Incomes from share participations |
|
|
16.902,16 |
|
From affiliated companies |
|
|
|
|
From associated companies |
|
|
|
|
From other companies |
|
|
16.902,16 |
|
B.6.Income from other securities and credits to fixed assets |
|
|
|
|
From affiliated companies |
|
|
|
|
From associated companies |
|
|
|
|
Other companies |
|
|
|
|
B.7.Other interests and
similar |
32.153,91 |
46.230,48 |
20.334,81 |
|
From affiliated companies |
|
|
|
|
From associated companies |
|
|
|
|
Other Interests |
32.153,91 |
46.230,48 |
20.331,03 |
|
Profits from investments |
|
|
3,78 |
|
B.8. Positive change
difference |
16.618,06 |
16.170,56 |
25.661,88 |
|
B.II. NEGATIVE FINANCIAL
RESULTS (A.7+A.8+A.9-B.5-B.6-B.7-B.8) |
155.521,74 |
205.301,78 |
316.697,84 |
|
B.III.LOSSES FROM ORDINARY ACTIVITIES (B.I+B.II-A.I-A.II) |
|
|
|
|
B.9.B.9. Gains from disposal of fixed assets |
|
2.758,61 |
326.110,81 |
|
B.10.Gains from dealing in own shares |
|
|
|
|
B.11. Paid in surplus |
11.168,62 |
11.168,62 |
11.168,62 |
|
B.12. Extraordinary income |
5.209,56 |
58.216,95 |
26.430,37 |
|
B.13.Other year’s income and profits |
|
10,39 |
|
|
B.IV.NEGATIVE EXTRAORDINARY LOSSES
(A.10+A.11+A.12+A.13+A.14-B.9-B.10-B.11-B.12-B.13) |
317.075,75 |
195.891,60 |
|
|
B.V.LOSS BEFORE TAXES (B.III+B.IV-A.III-A.IV) |
|
|
|
|
B.VI.EXERCISE RESULTS (LOSS) (B.V+A.14+A.15) |
|
|
|
Composition of the Profit and Loss Account
FINANCIAL
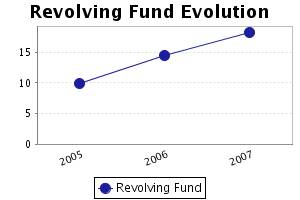
BALANCE
Here the Main Capital Amounts of the company and
the Revolving Fund Evolution are analysed.
Financial Balance Table
Figures given in €
|
|
28/02/2005 (12) |
% |
28/02/2006 (12) |
% |
28/02/2007 (12) |
% |
|
A) DUE FROM SHAREHOLDERS FOR UNCALLED CAPITAL |
|
|
|
|
|
|
|
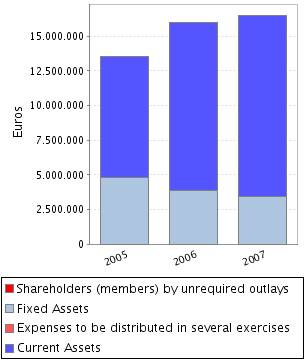
B) FIXED ASSETS |
4.792.113,91 |
35,30 |
3.871.697,68 |
24,20 |
3.414.489,21 |
20,69 |
|
C) DEFERRED EXPENSES |
11.070,47 |
0,08 |
9.878,14 |
0,06 |
9.155,23 |
0,06 |
|
D) CURRENT ASSETS |
8.773.014,97 |
64,62 |
12.115.363,68 |
75,74 |
13.078.793,14 |
79,25 |
|
ASSETS (A + B + C + D) |
13.576.199,35 |
|
15.996.939,50 |
|
16.502.437,58 |
|
|
|
||||||
|
A) SHAREHOLDERS EQUITY |
2.470.113,10 |
18,19 |
2.725.355,59 |
17,04 |
3.027.235,23 |
18,34 |
|
B) DEFERRED INCOME |
44.674,46 |
0,33 |
33.505,84 |
0,21 |
22.337,22 |
0,14 |
|
C) PROVISIONS FOR LIABILITIES AND EXPENSES |
|
|
|
|
|
|
|
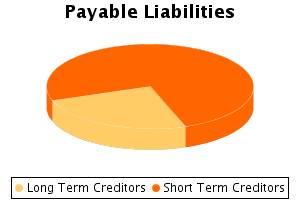
D) LONG TERM LIABILITIES |
3.633.714,69 |
26,77 |
3.440.586,89 |
21,51 |
3.387.264,63 |
20,53 |
|
E) SHORT TERM LIABILITIES |
7.427.697,10 |
54,71 |
9.797.491,18 |
61,25 |
10.065.600,50 |
60,99 |
|
F) SHORT TERM PROVISIONS FOR LIABILITIES AND EXPENSES |
|
|
|
|
|
|
|
LIABILITIES (A + B + C + D + E + F) |
13.576.199,35 |
|
15.996.939,50 |
|
16.502.437,58 |
|
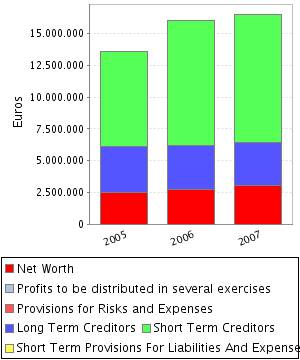
Financial Balance Composition
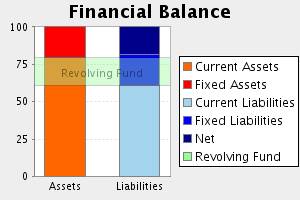
Comments on Financial Balance
In the 2005, the assets of the company were
formed in 35,38% of Fixed Assets and in 64,62% of Current Assets.This assets
were financed in 18,52% with own capitals, and in 26,77% with long term debt
and in 54,71% with current liabilities.
The result of this financial structure is a
positive turnover fund of 1.345.317,87 Euros, which is equivalent to
9,91% proportion of the company’s total assets.
In the 2006, the assets of the company were
formed in 24,26% of Fixed Assets and in 75,74% of Current Assets.This assets
were financed in 17,25% with own capitals, and in 21,51% with long term debt
and in 61,25% with current liabilities.
The result of this financial structure is a
positive turnover fund of 2.317.872,50 Euros, which is equivalent to
14,49% proportion of the company’s total assets.
This measure has increased with respect to the
previous exercise in 72,29% having also increased its proportion with respect
to the total assets of the company.
In the 2007, the assets of the company were
formed in 20,75% of Fixed Assets and in 79,25% of Current Assets.This assets
were financed in 18,48% with own capitals, and in 20,53% with long term debt
and in 60,99% with current liabilities.
The result of this financial structure is a
positive turnover fund of 3.013.192,64 Euros, which is equivalent to
18,26% proportion of the company’s total assets.
This measure has increased with respect to the
previous exercise in 30,00% having also increased its proportion with respect
to the total assets of the company.
RATIOS
Main Ratios
|
|
28/02/2005 (12) |
28/02/2006 (12) |
28/02/2007 (12) |
|
STRUCTURAL RATIOS |
|
|
|
|
Management fund |
1.345.317,87 |
2.317.872,50 |
3.013.192,64 |
|
Management Fund Requirement |
4.660.799,08 |
8.124.986,75 |
9.109.655,99 |
|
Indebtedness (%) |
81,48 |
82,75 |
81,52 |
|
External Funds on Net Worth |
4,40 |
4,80 |
4,41 |
|
GENERAL ACTIVITY RATIO |
|
|
|
|
Turnover Increase (%) |
15,77 |
19,46 |
1,40 |
|
Added value growth (%) |
28,00 |
14,10 |
-6,24 |
|
Cash Flow |
1.059.910,58 |
1.085.844,58 |
1.234.437,48 |
|
Labour Productivity |
1,81 |
1,58 |
1,61 |
|
Assets turnover |
1,51 |
1,53 |
1,50 |
|
Breakdown Point |
18.171.813,77 |
22.678.390,06 |
22.936.100,50 |
|
Security Margin of the Breakdown Point (%) |
12,46 |
9,44 |
9,30 |
|
ACTIVITY RATIOS |
|
|
|
|
Average Payment Period |
86 |
75 |
73 |
|
Average Collection Period |
71 |
96 |
105 |
|
Inventory Turnover Period |
79 |
75 |
81 |
|
SOLVENCY RATIOS |
|
|
|
|
Payback Capacity |
0,10 |
0,08 |
0,09 |
|
Assets Guarantee |
1,23 |
1,20 |
1,22 |
|
Short Term Debts Proportion (%) |
67,15 |
74,01 |
74,82 |
|
Interest Coverage |
2,19 |
-2,16 |
1,41 |
|
LIQUIDITY RATIOS |
|
|
|
|
Current Ratio |
1,18 |
1,24 |
1,30 |
|
Immediate liquidity |
0,02 |
0,01 |
0,00 |
|
Treasury |
-3.315.481,21 |
-5.807.114,25 |
-6.096.463,35 |
|
Sales on Current Assets |
841 |
727 |
683 |
Results Analysis Ratios
|
|
28/02/2005 (12) |
28/02/2006 (12) |
28/02/2007 (12) |
|
Economic profitability (%) |
6,40 |
4,44 |
3,92 |
|
Operating Profitability (%) |
4,24 |
2,90 |
2,60 |
|
Equity gearing |
4,43 |
4,12 |
2,76 |
|
Financial profitability (%) |
12,13 |
9,25 |
9,90 |
|
General Profitability (%) |
1,49 |
1,04 |
1,22 |
Comments on the Results Analysis Ratios
The economic profitability in the year2006
achieved a 4,44% positive level, due to a 2,90% economic margin and to an
assets turnover of1,53%.
The economic profitability in the year has
reduced from 6,40% up to 4,44% of2006, even if it remains positive. Assets
turnover increase whose index has passed from 1,51 to 1,53, could not
compensate operating profitability reduction from4,24% to the current level of
2,90%.
Financial profitability on 2006 achieved a
9,25%.
The company’s financial structure has instigated
its economic profitability with an indebtedness level of 4,12.
The general profitability on 2006 achieved a
1,04%.
The economic profitability in the year2007
achieved a 3,92% positive level, due to a 2,60% economic margin and to an
assets turnover of1,50%.
The economic profitability in the year has
reduced from 4,44% up to 3,92% of2007, even if it remains positive. This fall
is due to the decrease in operating profitability, that has passe from 2,90% to
2,60%, as assets turnover whose index has passed from 1,53 to 1,50%.
Financial profitability on 2007 achieved a
9,90%.
The company’s financial structure has instigated
its economic profitability with an indebtedness level of 2,76.
The general profitability on 2007 achieved a
1,22%.
SECTORIAL
ANÁLYSIS
Large Capital Amounts and Financial Balance
Figures given in %
|
|
COMPANY (2007) |
SECTOR |
DIFFERENCE |
DIFFERENCE RELATIVE |
|
|
|
|
|
|
ASSETS |
|
|
|
|
|
|
|
|
|
|
A) DUE FROM SHAREHOLDERS FOR UNCALLED CAPITAL |
|
0,00 |
|
|
|
|
|
|
|
|
B) FIXED ASSETS |
20,69 |
26,18 |
-5,49 |
-20,97 |
|
|
|
|
|
|
C) DEFERRED EXPENSES |
0,06 |
0,29 |
-0,23 |
-79,09 |
|
|
|
|
|
|
D) CURRENT ASSETS |
79,25 |
73,53 |
5,72 |
7,78 |
|
|
|
|
|
|
ASSETS (A + B + C + D) |
100 |
100 |
|
|
|
|
|
|
|
|
|
|
|
|
|
|
|
|
|
|
|
|
COMPANY (2007) |
SECTOR |
DIFFERENCE |
DIFFERENCE RELATIVE |
|
|
|
|
|
|
LIABILITIES |
|
|
|
|
|
|
|
|
|
|
A) SHAREHOLDERS EQUITY |
18,34 |
46,26 |
-27,92 |
-60,35 |
|
|
|
|
|
|
B) DEFERRED INCOME |
0,14 |
0,50 |
-0,36 |
-72,17 |
|
|
|
|
|
|
C) PROVISIONS FOR LIABILITIES AND EXPENSES |
|
2,94 |
|
|
|
|
|
|
|
|
D) LONG TERM LIABILITIES |
20,53 |
8,23 |
12,30 |
149,45 |
|
|
|
|
|
|
E) SHORT TERM LIABILITIES |
60,99 |
42,06 |
18,93 |
45,00 |
|
|
|
|
|
|
F) SHORT TERM PROVISIONS FOR LIABILITIES AND EXPENSES |
|
0,01 |
|
|
|
|
|
|
|
|
LIABILITIES (A + B + C + D + E + F) |
100 |
100 |
|
|
|
|
|
|
|
Sectorial Financial Balance Comparison
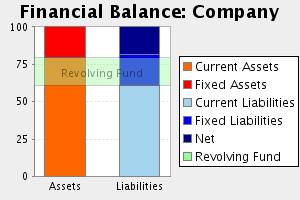
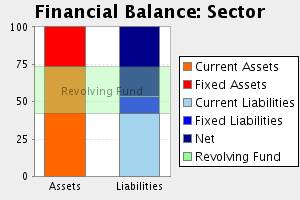
Comments to the Sectorial Analysis
In the 2007, the assets of the company were
formed in 20,75% of fixed assets and in 79,25Current Assets % In the sector,
the proportion of fixed assets was of 26,47%, 21,60% superior, and the
proportion of current assets was of 73,53%, 7,78% inferior.
The assets were financed in the company in
18,48% with own capitals , in 20,53% with fixed liabilities and in 60,99% with
current liabilities In the sector, the self financing represented 46,76%,
60,48% superior. On the other hand the long term debts represented in the sector
an average of 11,17% financing, with a relative difference of 83,83% in favour
of the companyAnd, short term liabilities represented in the sector an average
of 42,08% financing, with a relative difference of 44,96% in favour of the
company
The result of this company’s financial structure
is a turnover fund that represents 18,26% of the total assets; in the sector,
this same proportion is 31,46%, therefore, we can say that the company’s
turnover fund is 41,95% smaller than the sector one.
Analytical Account of Results
Figures given in %
|
|
COMPANY (2007) |
SECTOR |
DIFFERENCE |
DIFFERENCE RELATIVE |
|
Turnover |
98,16 |
98,52 |
-0,36 |
-0,36 |
|
Other operating income |
1,84 |
1,48 |
0,36 |
24,24 |
|
Production Value |
100,00 |
100,00 |
0,00 |
0,00 |
|
Operating expenses |
72,52 |
62,42 |
10,10 |
16,18 |
|
Other operation expenses |
14,40 |
14,98 |
-0,58 |
-3,90 |
|
Added value |
13,08 |
22,59 |
-9,51 |
-42,11 |
|
Labour cost |
8,12 |
15,16 |
-7,04 |
-46,43 |
|
Gross Economic Result |
4,97 |
7,44 |
-2,47 |
-33,16 |
|
Assets depreciation |
2,16 |
1,70 |
0,46 |
27,13 |
|
Variation in provision for current assets and
bad debt losses |
0,25 |
0,28 |
-0,03 |
-11,66 |
|
Net Economic Result |
2,56 |
5,45 |
-2,89 |
-53,06 |
|
Financial income |
0,25 |
0,70 |
-0,45 |
-64,18 |
|
Financial Charges |
1,50 |
1,28 |
0,22 |
17,37 |
|
Variation in financial investment provision |
|
-0,03 |
|
|
|
Ordinary Activities Result |
1,30 |
4,90 |
-3,61 |
-73,50 |
|
Extraordinary income |
1,44 |
0,39 |
1,05 |
268,29 |
|
Extraordinary charges |
0,03 |
0,37 |
-0,34 |
-91,89 |
|
Variation in provision in fixed assets |
1,28 |
0,10 |
1,18 |
1.180,00 |
|
Results before Taxes |
1,44 |
4,83 |
-3,39 |
-70,17 |
|
Corporate taxes |
0,24 |
1,50 |
-1,26 |
-83,96 |
|
Net Result |
1,19 |
3,33 |
-2,14 |
-64,27 |
|
Assets depreciation |
2,16 |
1,70 |
0,46 |
27,13 |
|
Change of Provisions |
1,53 |
0,35 |
1,18 |
335,90 |
|
Net Self-Financing |
4,88 |
5,38 |
-0,50 |
-9,31 |
Main Ratios
|
|
COMPANY (2007) |
PTILE25 |
PTILE50 |
PTILE75 |
|
STRUCTURAL RATIOS |
|
|
|
|
|
Management fund |
3.013.192,64 |
1.414,42 |
2.751,86 |
4.849,66 |
|
Management Fund Requirement |
9.109.655,99 |
-1.332,47 |
215,65 |
1.814,10 |
|
Indebtedness (%) |
81,52 |
37,65 |
53,51 |
65,18 |
|
External Funds on Net Worth |
4,41 |
0,60 |
1,15 |
1,87 |
|
GENERAL ACTIVITY RATIO |
|
|
|
|
|
Turnover Increase (%) |
1,40 |
-6,09 |
-2,06 |
7,16 |
|
Added value growth (%) |
-6,24 |
-10,67 |
-0,92 |
9,46 |
|
Cash Flow |
1.234.437,48 |
350,26 |
668,50 |
1.059,91 |
|
Labour Productivity |
1,61 |
1,28 |
1,53 |
2,22 |
|
Assets turnover |
1,50 |
1,12 |
1,40 |
1,91 |
|
Breakdown Point |
22.936.100,50 |
7.307.264,44 |
10.620.296,83 |
15.361.369,54 |
|
Security Margin of the Breakdown Point (%) |
9,30 |
6,21 |
12,13 |
25,54 |
|
ACTIVITY RATIOS |
|
|
|
|
|
Average Payment Period |
73 |
30 |
71 |
121 |
|
Average Collection Period |
105 |
51 |
98 |
118 |
|
Inventory Turnover Period |
81 |
28 |
58 |
99 |
|
SOLVENCY RATIOS |
|
|
|
|
|
Payback Capacity |
0,09 |
0,07 |
0,12 |
0,25 |
|
Assets Guarantee |
1,22 |
1,48 |
1,87 |
2,65 |
|
Short Term Debts Proportion (%) |
74,82 |
78,77 |
95,25 |
98,82 |
|
Interest Coverage |
1,41 |
1,49 |
5,18 |
19,40 |
|
LIQUIDITY RATIOS |
|
|
|
|
|
Current Ratio |
1,30 |
1,30 |
1,65 |
2,22 |
|
Immediate liquidity |
0,00 |
0,04 |
0,10 |
0,51 |
|
Treasury |
-6.096.463,35 |
-2.041,57 |
8,77 |
1.112,99 |
|
Sales on Current Assets |
683 |
528 |
674 |
919 |
Results Analysis Ratios
|
|
COMPANY (2007) |
PTILE25 |
PTILE50 |
PTILE75 |
|
Economic profitability (%) |
3,92 |
3,47 |
6,53 |
10,90 |
|
Operating Profitability (%) |
2,60 |
2,56 |
4,44 |
7,50 |
|
Equity gearing |
2,76 |
1,35 |
1,67 |
2,30 |
|
Financial profitability (%) |
9,90 |
2,64 |
7,59 |
16,98 |
|
General Profitability (%) |
1,22 |
0,94 |
2,32 |
5,37 |
FOREIGN EXCHANGE
RATES
|
Currency |
Unit
|
Indian Rupees |
|
US Dollar |
1 |
Rs.42.82 |
|
UK Pound |
1 |
Rs.80.01 |
|
Euro |
1 |
Rs.63.83 |
RATING
EXPLANATIONS
|
RATING |
STATUS |
PROPOSED CREDIT LINE |
|
|
>86 |
Aaa |
Possesses an extremely sound financial base with the strongest
capability for timely payment of interest and principal sums |
Unlimited |
|
71-85 |
Aa |
Possesses adequate working capital. No caution needed for credit
transaction. It has above average (strong) capability for payment of interest
and principal sums |
Large |
|
56-70 |
A |
Financial & operational base are regarded healthy. General unfavourable
factors will not cause fatal effect. Satisfactory capability for payment of
interest and principal sums |
Fairly Large |
|
41-55 |
Ba |
Overall operation is considered normal. Capable to meet normal
commitments. |
Satisfactory |
|
26-40 |
B |
Unfavourable & favourable factors carry similar weight in credit
consideration. Capability to overcome financial difficulties seems
comparatively below average. |
Small |
|
11-25 |
Ca |
Adverse factors are apparent. Repayment of interest and principal sums
in default or expected to be in default upon maturity |
Limited with
full security |
|
<10 |
C |
Absolute credit risk exists. Caution needed to be exercised |
Credit not
recommended |
|
NR |
In view of the lack of information, we have no basis upon which to
recommend credit dealings |
No Rating |
|
This score serves as a reference to assess SC’s credit risk
and to set the amount of credit to be extended. It is calculated from a composite
of weighted scores obtained from each of the major sections of this report. The
assessed factors and their relative weights (as indicated through %) are as
follows:
Financial
condition (40%) Ownership
background (20%) Payment
record (10%)
Credit history
(10%) Market trend
(10%) Operational
size (10%)