![]()
MIRA
INFORM REPORT
|
Report Date : |
14.08.2008 |
IDENTIFICATION
DETAILS
|
Name : |
MOMU WOMAN SL. |
|
|
|
|
Registered Office : |
Street Doctor
Allart, 25, Cp 38003, Santa Cruz De
Tenerife Tenerife |
|
|
|
|
Country : |
Spain |
|
|
|
|
Financials (as on) : |
31.12.2006 |
|
|
|
|
Date of Incorporation : |
|
|
|
|
|
Legal Form : |
Limited Liability Company |
|
|
|
|
Line of Business : |
RATING &
COMMENTS
|
MIRA’s Rating : |
A |
|
RATING |
STATUS |
PROPOSED CREDIT LINE |
|
|
56-70 |
A |
Financial & operational base are regarded healthy. General unfavourable
factors will not cause fatal effect. Satisfactory capability for payment of
interest and principal sums |
Fairly Large |
|
Maximum Credit Limit : |
104.000,00 € |
|
|
|
|
Status : |
Good |
|
|
|
|
Payment Behaviour : |
Regular |
|
|
|
|
Litigation : |
Clear |
FINANCIAL REPORT
MOMU WOMAN SL.
TAX NUMBER: B38768958
EXECUTIVE
SUMMARY
Identification
Current Business Name: MOMU WOMAN SL.
Other names: NO
Current Address: STREET DOCTOR ALLART, 25, CP 38003, SANTA
CRUZ DE TENERIFE TENERIFE
Telephone number: 922370999 Fax: 922244712
Commercial
Risk
Credit Appraisal: 104.000,00 €
Legal Actions: NO
Financial
Information
Latest Balance sheet sales (2006): 3.038.577,24 €
(MERCANTILE REGISTER)
Result: 376.273,81 €
Total Assets: 2.127.798,86 €
Social Capital: 120.000,00 €
Commercial
Information
Constitution Date: 12/04/2004
Business activity: Retail sale of clothes
NACE Code: 5242
International Operations: No business relationships registered
Corporate
Structure
Sole Administrator:
LALWANI PRIMLANI SURESH HARIRAM
Other
Complementary Information
Latest proceeding published in BORME: 03/10/2007 Registration of accounts
Bank Entities: Yes
Credit
Appraisal
Favourable to 104.000,00 €
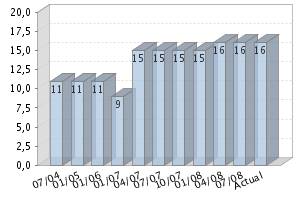
Rating
Evolution
Financial
Situation
Fiscal year2006
|
Treasury |
Excellent |
|
Indebtedness |
Weak |
|
Profitability |
Good |
|
Balance |
Excellent |
Performance
|
Legal Actions |
None or Negligible |
|
Business Trajectory |
Superior |
INCIDENTS 
Summary
LEGAL ACTIONS: No legal incidences registered
CLAIM FILED AGAINST THE ADMINISTRATION: No administrative claims registered
AFFECTED BY: No significant element.
FINANCIAL
ELEMENTS AND SECTORIAL COMPARATIVE
FINANCIAL ELEMENTS
Figures given in €
|
|
2004 (9) |
2005 (12) |
2006 (12) |
% ASSETS |
|
|
|
|
|
|
BALANCE SHEET ANALYSIS |
|
|
|
|
|
|
|
|
|
|
OWN FUNDS |
268.299,59 |
671.363,97 |
1.047.637,78 |
49,24 |
|
|
|
|
|
|
DEBT |
859.881,23 |
1.504.100,55 |
1.080.161,08 |
50,76 |
|
|
|
|
|
|
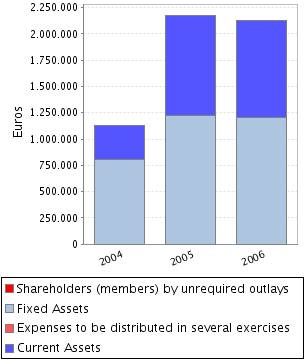
FIXED ASSETS |
807.154,58 |
1.222.502,23 |
1.202.683,24 |
56,52 |
|
|
|
|
|
|
TOTAL ASSETS |
1.128.180,82 |
2.175.464,52 |
2.127.798,86 |
|
|
|
|
|
|
|
|
|
|
|
|
|
|
|
|
|
|
|
2004 (9) |
2005 (12) |
2006 (12) |
% SALES |
|
|
|
|
|
|
PROFIT AND LOSS ACCOUNT ANALYSIS |
|
|
|
|
|
|
|
|
|
|
SALES |
1.354.749,21 |
3.204.122,26 |
3.038.577,24 |
|
|
|
|
|
|
|
ADDED VALUE |
357.712,90 |
895.347,23 |
1.067.900,73 |
35,14 |
|
|
|
|
|
|
EBITDA |
183.195,20 |
486.739,75 |
478.016,58 |
15,73 |
|
|
|
|
|
|
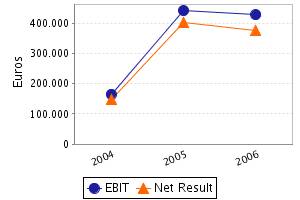
EBIT |
165.750,81 |
442.563,78 |
429.138,32 |
14,12 |
|
|
|
|
|
|
NET RESULT |
148.299,59 |
403.064,38 |
376.273,81 |
12,38 |
|
|
|
|
|
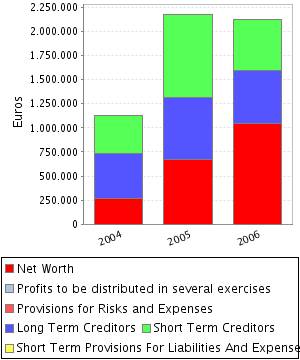
Balance Sheets Items Analysis
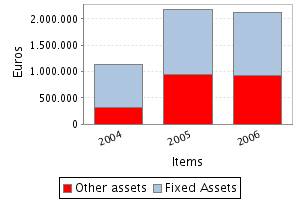
Balance Sheet Comments
Total assets of the company decreased in 2,19%
between 2005 and 2006.
This decrease in the amount total assets, has
been reflected in a reduction of the fixed assets of 1,62%.
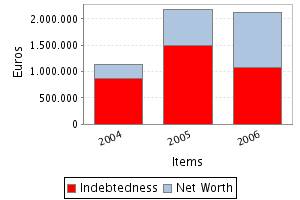
Assets reduction contrasts with net worth growth
of 56,05%. Therefore, the company’s indebtedness has reduced in 28,19%.
Profit and Loss Account Analysis
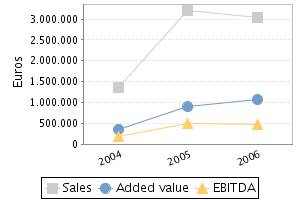
Profit and Loss Account Comments
The company’s sales figure decreased in 5,17%
between 2005 and 2006.
The company’s EBIT decreased in 3,03% between
2005 and 2006.
This evolution implies an increase in the
company’s operating profitability.
The result of these variations is a decrease of
the company’s Economic Profitability of 0,86% in the analysed period, being
this profitability of 20,17% in the year 2006.
The company’s Net Result decreased in 6,65%
between 2005 and 2006.
This evolution, compared to the EBIT’s
performance, implies that the financial and extraordinary activities have had a
negative effect in the company’s Financial Profitability.
The result of these variations is a reduction of
the company’s profitability of 40,18% in the analysed period, being equal to
35,92% in the year 2006.
COMPARATIVE SECTOR ANALYSIS
Values table
Figures expressed in %
|
|
COMPANY (2006) |
SECTOR |
DIFFERENCE |
DIFFERENCE RELATIVE |
|
|
|
|
|
|
BALANCE SHEET ANALYSIS: % on the total assets |
|
|
|
|
|
|
|
|
|
|
OWN FUNDS |
49,24 |
39,13 |
10,11 |
25,83 |
|
|
|
|
|
|
DEBT |
50,76 |
60,87 |
-10,11 |
-16,60 |
|
|
|
|
|
|
FIXED ASSETS |
56,52 |
34,00 |
22,52 |
66,25 |
|
|
|
|
|
|
|
|
|
|
|
|
|
|
|
|
|
|
COMPANY (2006) |
SECTOR |
DIFFERENCE |
DIFFERENCE RELATIVE |
|
|
|
|
|
|
PROFIT AND LOSS ACCOUNT ANALYSIS: % on the total
operating income |
|
|
|
|
|
|
|
|
|
|
SALES |
100,00 |
98,79 |
1,21 |
1,22 |
|
|
|
|
|
|
ADDED VALUE |
35,14 |
19,46 |
15,69 |
80,62 |
|
|
|
|
|
|
EBIT |
14,12 |
4,33 |
9,79 |
226,09 |
|
|
|
|
|
|
NET RESULT |
12,38 |
3,03 |
9,36 |
308,96 |
|
|
|
|
|
Sector Composition
Compared sector (NACE): 524
Number of companies: 1084
Size (Sales Figure) : 2.800.000,00 - 7.000.000,00 Euros
Comments on the sectorial comparative
Compared to its sector the assets of the
companies show a greater proportion of fixed assets. Specifically the
difference with the sector average is 22,52% , which means a relative
difference of 66,25% .
In liabilities composition the company appeals
on a wider scale to self financing, being the proportion of net worth of 10,11%
superior, which means a relative difference of 25,83% . As a consequence,
external financing sources are less used by the company in 10,11% less than the
sector, which means a difference of 16,60% .
The proportion that the sales mean to the
company’s total ordinary income is 100,00%, 1,21% higher than in the sector,
which means a relative difference of 1,22% .
The company’s EBIT was positive and was 14,12%
with regard to the total ordinary income, 9,79% higher than in the sector,
which means a relative difference of 226,09% .
The company’s capacity to generate operating
income is higher than the one of the sector as its ratio EBIT/Sales is higher (ES
Company versus ES Sector).
The company’s net result was positive and equal
to 12,38% with regard to the total ordinary income, 9,36% less than the sector,
which means a relative difference of 308,96% .
The financial and extraordinary results and the
tax impact have had a less negative impact on the Net result in the company
than in the sector; as a consequence, the company shows a better Net
Result/EBIT ratio (REBEmpresa vs. REBSector).
ADDRESSES
Current Legal Seat Address:
STREET DOCTOR ALLART, 25
38003 SANTA CRUZ DE TENERIFE TENERIFE
Characteristics of the current address
Type of premises: store
CORPORATE
STRUCTURE
ADMINISTRATIVE LINKS
Main Board members, Directors and Auditor ![]()
|
POSITION |
SURNAMES AND NAME |
APPOINTMENT DATE |
|
SOLE ADMINISTRATOR |
LALWANI PRIMLANI SURESH HARIRAM |
11/06/2004 |
CREDIT
INFORMATION
Constitution Date: 12/04/2004
Business
activity 
Activity: Retail sale of clothes
NACE Code: 5242
NACE Activity: Retail sale of clothing
Business: ARTICULO 2 LA SOCIEDAD TIENE POR OBJETO: A) LA IMPORTACION; EXPORTACION,
REPRESENTACION, CONSIGNACION, COMERCIALIZACION Y COMPRA O VENTA AL MAYOR Y AL
DETALLE DE TEJIDOS, CONFECCIONES TEXTILES PARA EL HOGAR, PRENDAS EXTE
Banks 
|
ENTITY |
BRANCH |
ADDRESS |
TOWN OR CITY |
PROVINCE |
|
BANCO POPULAR ESPAÑOL, S.A. |
0144 |
BETHENCOURT ALFONSO, 16 |
SANTA CRUZ DE TENERIFE |
Tenerife |
1 bank entities registered
LEGAL
STRUCTURE
Constitution Data
Register Date: 12/04/2004
Register town: Tenerife
Announcement number: 268625
Register Data:
Volume 2584, Book 0, Folio 147, Section 8, Sheet 33889
Legal form: LIMITED LIABILITY COMPANY
Social Capital: 120.000 €
Current
structure data 
Current Legal Form: LIMITED LIABILITY COMPANY
Current Capital: 120.000,00 €
Legal
Aspects
Obligation to fill in Financial
Statements: YES
Chamber census: YES (2006)
Listed on a Stock Exchange: NO
B.O.R.M.E.(Official
Companies Registry Gazette) 
Registered Proceedings
|
PROCEEDINGS |
DATE |
NOTICE NUM. |
TRADE REG. |
|
Establishment |
11/06/2004 |
268625 |
Tenerife |
|
Appointments |
11/06/2004 |
268625 |
Tenerife |
Other Proceedings published
|
PROCEEDINGS |
DATE |
NOTICE NUM. |
TRADE REG. |
|
Registration of accounts (2006) Individual |
03/10/2007 |
737799 |
Tenerife |
|
Registration of accounts (2005) Individual |
18/09/2006 |
478969 |
Tenerife |
|
Registration of accounts (2004) Individual |
18/09/2006 |
472249 |
Tenerife |
FINANCIAL
INFORMATION
The information on the last account contained in
this report is extracted from the Mercantile Register file of the legal address
of the Company and dated 04/03/2008.
BALANCE SHEET
Assets
Figures given in €
|
|
31/12/2004 (9) |
31/12/2005 (12) |
31/12/2006 (12) |
|
A) DUE FROM SHAREHOLDERS
FOR UNCALLED CAPITAL |
|
|
|
|
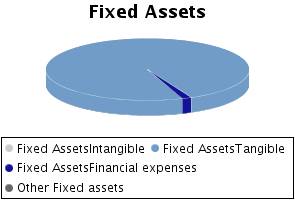
B) FIXED ASSETS |
807.154,58 |
1.222.502,23 |
1.202.683,24 |
|
I. Incorporation costs |
|
|
|
|
II. Intangible fixed
assets |
|
|
|
|
III. Tangible fixed
assets |
807.135,16 |
1.204.338,81 |
1.184.519,82 |
|
IV. Financial fixed
assets |
19,42 |
18.163,42 |
18.163,42 |
|
V.Owners equity |
|
|
|
|
VI.Long term trade
liabilities |
|
|
|
|
C) DEFERRED EXPENSES |
|
|
|
|
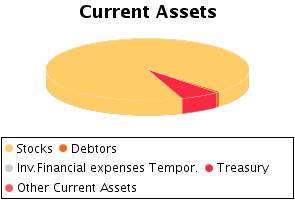
D) CURRENT ASSETS |
321.026,24 |
952.962,29 |
925.115,62 |
|
I. Shareholders by
required outlays |
|
|
|
|
II. Stocks |
260.987,10 |
866.612,70 |
861.159,40 |
|
III. Debtors |
|
1.924,92 |
5.233,60 |
|
IV. Temporary financial
investment |
|
|
|
|
V. Short-term own shares |
|
|
|
|
VI. Treasury |
60.039,14 |
84.424,67 |
58.722,62 |
|
VII. Periodification
adjustments |
|
|
|
|
ASSETS (A + B + C + D) |
1.128.180,82 |
2.175.464,52 |
2.127.798,86 |
Assets composition
Liabilities
Figures given in €
|
|
31/12/2004 (9) |
31/12/2005 (12) |
31/12/2006 (12) |
|
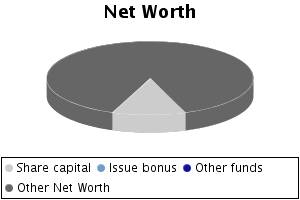
A) SHAREHOLDERS EQUITY |
268.299,59 |
671.363,97 |
1.047.637,78 |
|
I. Share capital |
120.000,00 |
120.000,00 |
120.000,00 |
|
II. Issue bonus |
|
|
|
|
III.Revaluation reserve |
|
|
|
|
IV.Reserves |
|
|
|
|
Capital adjustments in Euros |
|
|
|
|
Sundry reserves |
|
|
|
|
V.Results from previous
years |
|
148.299,59 |
551.363,97 |
|
VI.Profit and Losses |
148.299,59 |
403.064,38 |
376.273,81 |
|
VII.Dividend paid during
the year |
|
|
|
|
VIII.Own shares for
capital reduction |
|
|
|
|
B) DEFERRED INCOME |
|
|
|
|
C) PROVISIONS FOR
LIABILITIES AND EXPENSES |
|
|
|
|
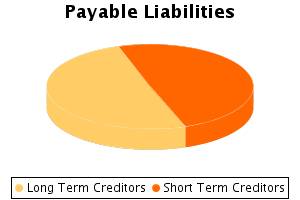
D) LONG TERM LIABILITIES |
470.625,61 |
638.143,52 |
546.982,95 |
|
E) SHORT TERM LIABILITIES |
389.255,62 |
865.957,03 |
533.178,13 |
|
F) SHORT TERM PROVISIONS
FOR LIABILITIES AND EXPENSES |
|
|
|
|
LIABILITIES (A + B + C +
D + E + F) |
1.128.180,82 |
2.175.464,52 |
2.127.798,86 |
Liabilities Composition
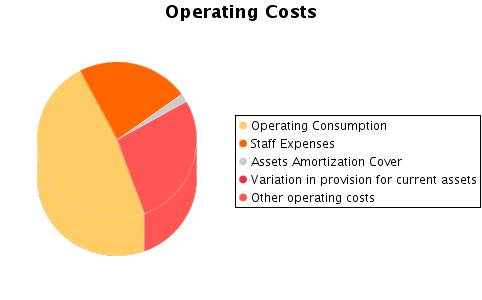
PROFIT
AND LOSS ACCOUNT
Itams of the Profit and Loss Account
Figures given in €
|
|
31/12/2004 (9) |
31/12/2005 (12) |
31/12/2006 (12) |
|
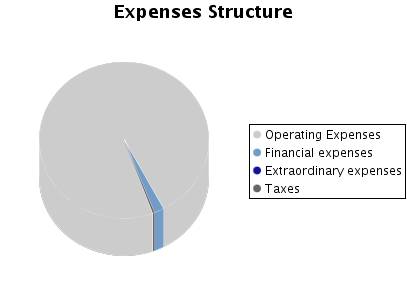
A) EXPENSES (A.1 a A.15) |
1.209.025,76 |
2.804.833,64 |
2.666.997,05 |
|
A.1.Operating costs |
700.372,68 |
1.441.239,61 |
1.250.301,75 |
|
A.2. Labour cost |
174.517,70 |
408.607,48 |
589.884,15 |
|
Wages |
133.200,13 |
313.003,95 |
454.226,90 |
|
Social security expenses |
41.317,57 |
95.603,53 |
135.657,25 |
|
A.3. Assets depreciation |
17.444,39 |
44.175,97 |
48.878,26 |
|
A.4. Variation in
provision for current assets |
|
|
|
|
A.5. Other operating
costs |
296.663,63 |
867.535,42 |
720.374,76 |
|
A.I. OPERATING RESULT
(B.1-A.1-A.2-A.3-A.4-A.5) |
165.750,81 |
442.563,78 |
429.138,32 |
|
A.6.Financial expenses
and similar |
12.578,68 |
28.679,50 |
21.597,77 |
|
Debts with related companies |
|
|
|
|
Debts with associated companies |
|
|
|
|
Other companies debts By debts with third
parties and similar expenses |
12.578,68 |
28.679,50 |
21.597,77 |
|
Losses from financial investments |
|
|
|
|
A.7. Variation in
financial investment provision |
|
|
|
|
A.8.Negative exchange
difference |
2.101,69 |
5.231,36 |
26.912,04 |
|
A.II.POSITIVE FINANCIAL
RESULTS (B.2+B.3-A.6-A.7-A.8) |
|
|
|
|
A.III.PROFIT FROM
ORDINARY ACTIVITIES (A.I+A.II-B.I-B.II) |
153.646,58 |
411.666,31 |
384.848,87 |
|
A.9. Variation in provision in fixed assets |
|
|
|
|
A.10. Losses in fixed assets |
|
|
|
|
A.11. Losses from own shares and bonds |
|
|
|
|
A.12. Extraordinary charges |
|
|
|
|
A.13.Other exercises’ expenses and losses |
|
|
|
|
A.IV.POSITIVE EXTRAORDINARY RESULT
(B.4+B.5+B.6+B.7+B.8-A.9-A.10-A.11-A.12-A.13) |
|
762,37 |
473,26 |
|
A.V.PROFIT BEFORE TAXES (A.III+A.IV-B.III-B.IV) |
153.646,58 |
412.428,68 |
385.322,13 |
|
A.14.Corporate Taxes |
5.346,99 |
9.364,30 |
9.048,32 |
|
A.15. Other taxes |
|
|
|
|
A.VI.EXERCISE RESULT (PROFIT) (A.V-A.14-A.15) |
148.299,59 |
403.064,38 |
376.273,81 |
|
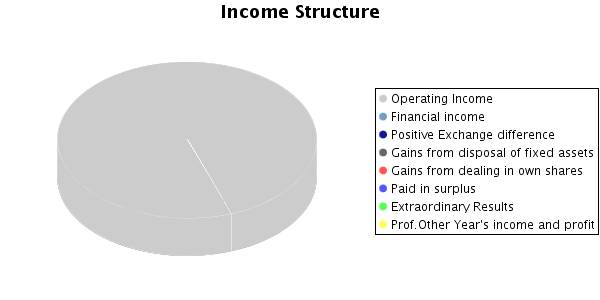
B) INCOMES (B.1 a B.8) |
1.357.325,35 |
3.207.898,02 |
3.043.270,86 |
|
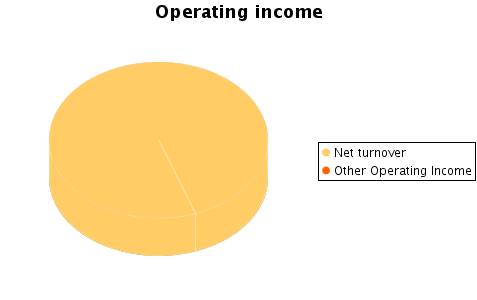
B.1.Operating income |
1.354.749,21 |
3.204.122,26 |
3.038.577,24 |
|
Turnover |
1.354.749,21 |
3.204.122,26 |
3.038.577,24 |
|
Other operating income |
|
|
|
|
B.I.OPERATING LOSSES
(A.1+A.2+A.3+A.4+A.5-B.1) |
|
|
|
|
B.2.Financial Income |
0,22 |
874,33 |
1.868,39 |
|
From affiliated companies |
|
|
|
|
From associated companies |
|
|
|
|
Other |
0,22 |
874,33 |
1.868,39 |
|
Gains from investments |
|
|
|
|
B.3. Positive change difference |
2.575,92 |
2.139,06 |
2.351,97 |
|
B.II. NEGATIVE FINANCIAL RESULTS (A.6+A.7+A.8-B.2-B.3) |
12.104,23 |
30.897,47 |
44.289,45 |
|
B.III.LOSSES FROM ORDINARY ACTIVITIES (B.I+B.II-A.I-A.II) |
|
|
|
|
B.4.B.9. Gains from disposal of fixed assets |
|
|
|
|
B.5.Gains from dealing in own shares |
|
|
|
|
B.6. Paid in surplus |
|
|
|
|
B.7. Extraordinary income |
|
762,37 |
473,26 |
|
B.8.Other year’s income
and profits |
|
|
|
|
B.IV.NEGATIVE EXTRAORDINARY
LOSSES (A.9+A.10+A.11+A.12+A.13-B.4-B.5-B.6-B.7-B.8) |
|
|
|
|
B.V.LOSS BEFORE TAXES
(B.III+B.IV-A.III-A.IV) |
|
|
|
|
B.VI.EXERCISE RESULTS
(LOSS) (B.V+A.14+A.15) |
|
|
|
Composition of the Profit and Loss Account
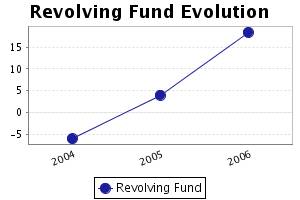
FINANCIAL
BALANCE
Here the Main Capital Amounts of the company and
the Revolving Fund Evolution are analysed.
Financial Balance Table
Figures given in €
|
|
31/12/2004 (9) |
% |
31/12/2005 (12) |
% |
31/12/2006 (12) |
% |
|
A) DUE FROM SHAREHOLDERS FOR UNCALLED CAPITAL |
|
|
|
|
|
|
|
B) FIXED ASSETS |
807.154,58 |
71,54 |
1.222.502,23 |
56,19 |
1.202.683,24 |
56,52 |
|
C) DEFERRED EXPENSES |
|
|
|
|
|
|
|
D) CURRENT ASSETS |
321.026,24 |
28,46 |
952.962,29 |
43,81 |
925.115,62 |
43,48 |
|
ASSETS (A + B + C + D) |
1.128.180,82 |
|
2.175.464,52 |
|
2.127.798,86 |
|
|
|
||||||
|
A) SHAREHOLDERS EQUITY |
268.299,59 |
23,78 |
671.363,97 |
30,86 |
1.047.637,78 |
49,24 |
|
B) DEFERRED INCOME |
|
|
|
|
|
|
|
C) PROVISIONS FOR LIABILITIES AND EXPENSES |
|
|
|
|
|
|
|
D) LONG TERM LIABILITIES |
470.625,61 |
41,72 |
638.143,52 |
29,33 |
546.982,95 |
25,71 |
|
E) SHORT TERM LIABILITIES |
389.255,62 |
34,50 |
865.957,03 |
39,81 |
533.178,13 |
25,06 |
|
F) SHORT TERM PROVISIONS FOR LIABILITIES AND EXPENSES |
|
|
|
|
|
|
|
LIABILITIES (A + B + C + D + E + F) |
1.128.180,82 |
|
2.175.464,52 |
|
2.127.798,86 |
|
Financial Balance Composition
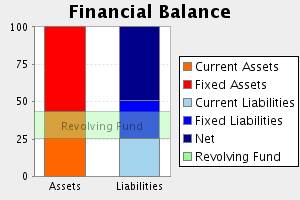
Comments on Financial Balance
In the 2004, the assets of the company were
formed in 71,54% of Fixed Assets and in 28,46% of Current Assets.This assets
were financed in 23,78% with own capitals, and in 41,72% with long term debt
and in 34,50% with current liabilities.
The result of this financial structure is a
negative turnover fund of -68.229,38 Euros, which is equivalent to -6,05%
proportion of the company’s total assets.
In the 2005, the assets of the company were
formed in 56,19% of Fixed Assets and in 43,81% of Current Assets.This assets
were financed in 30,86% with own capitals, and in 29,33% with long term debt
and in 39,81% with current liabilities.
The result of this financial structure is a
positive turnover fund of 87.005,26 Euros, which is equivalent to 4,00%
proportion of the company’s total assets.
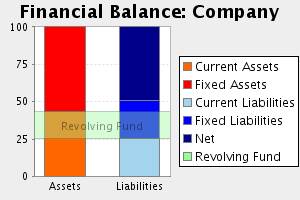
In the 2006, the assets of the company were
formed in 56,52% of Fixed Assets and in 43,48% of Current Assets.This assets
were financed in 49,24% with own capitals, and in 25,71% with long term debt
and in 25,06% with current liabilities.
The result of this financial structure is a
positive turnover fund of 391.937,49 Euros, which is equivalent to 18,42%
proportion of the company’s total assets.
This measure has increased with respect to the
previous exercise in 350,48% having also increased its proportion with respect
to the total assets of the company.
RATIOS
Main Ratios
|
|
31/12/2004 (9) |
31/12/2005 (12) |
31/12/2006 (12) |
|
STRUCTURAL RATIOS |
|
|
|
|
Management fund |
-68.229,38 |
87.005,26 |
391.937,49 |
|
Indebtedness (%) |
76,22 |
69,14 |
50,76 |
|
External Funds on Net Worth |
3,20 |
2,24 |
1,03 |
|
GENERAL ACTIVITY RATIO |
|
|
|
|
Turnover Increase (%) |
|
|
-5,17 |
|
Added value growth (%) |
|
|
19,27 |
|
Cash Flow |
165.743,98 |
447.240,35 |
425.152,07 |
|
Labour Productivity |
2,05 |
2,19 |
1,81 |
|
Assets turnover |
1,20 |
1,47 |
1,43 |
|
Breakdown Point |
1.011.596,96 |
2.399.741,74 |
2.309.399,92 |
|
Security Margin of the Breakdown Point (%) |
25,33 |
25,10 |
24,00 |
|
ACTIVITY RATIOS |
|
|
|
|
Average Collection Period |
|
0 |
1 |
|
Inventory Turnover Period |
69 |
97 |
102 |
|
SOLVENCY RATIOS |
|
|
|
|
Payback Capacity |
0,19 |
0,30 |
0,39 |
|
Assets Guarantee |
1,31 |
1,45 |
1,97 |
|
Short Term Debts Proportion (%) |
45,27 |
57,57 |
49,36 |
|
Interest Coverage |
12,97 |
15,46 |
19,47 |
|
LIQUIDITY RATIOS |
|
|
|
|
Current Ratio |
0,82 |
1,10 |
1,74 |
|
Immediate liquidity |
0,15 |
0,10 |
0,11 |
|
Sales on Current Assets |
1.519 |
1.210 |
1.182 |
Results Analysis Ratios
|
|
31/12/2004 (9) |
31/12/2005 (12) |
31/12/2006 (12) |
|
Economic profitability (%) |
14,69 |
20,34 |
20,17 |
|
Operating Profitability (%) |
12,24 |
13,81 |
14,12 |
|
Equity gearing |
3,90 |
3,01 |
1,82 |
|
Financial profitability (%) |
55,27 |
60,04 |
35,92 |
|
General Profitability (%) |
10,95 |
12,58 |
12,38 |
Comments on the Results Analysis Ratios
The economic profitability in the year2006
achieved a 20,17% positive level, due to a 14,12% economic margin and to an
assets turnover of1,43%.
The economic profitability in the year has
reduced from 20,34% up to 20,17% of2006, even if it remains positive. The
decrease in assets turnover from 1,47% to the current level of 1,43has provoked
this drop, which has not been compensated by the parallel increase of the
economic margin from 14,12% to 13,81%.
Financial profitability on 2006 achieved a
35,92%.
The company’s financial structure has instigated
its economic profitability with an indebtedness level of 1,82.
The general profitability on 2006 achieved a
12,38%.
SECTORIAL
ANÁLYSIS
Large Capital Amounts and Financial Balance
Figures given in %
|
|
COMPANY (2006) |
SECTOR |
DIFFERENCE |
DIFFERENCE RELATIVE |
|
|
|
|
|
|
ASSETS |
|
|
|
|
|
|
|
|
|
|
A) DUE FROM SHAREHOLDERS FOR UNCALLED CAPITAL |
|
0,02 |
|
|
|
|
|
|
|
|
B) FIXED ASSETS |
56,52 |
34,00 |
22,52 |
66,24 |
|
|
|
|
|
|
C) DEFERRED EXPENSES |
|
0,51 |
|
|
|
|
|
|
|
|
D) CURRENT ASSETS |
43,48 |
65,47 |
-21,99 |
-33,59 |
|
|
|
|
|
|
ASSETS (A + B + C + D) |
100 |
100 |
|
|
|
|
|
|
|
|
|
|
|
|
|
|
|
|
|
|
|
|
COMPANY (2006) |
SECTOR |
DIFFERENCE |
DIFFERENCE RELATIVE |
|
|
|
|
|
|
LIABILITIES |
|
|
|
|
|
|
|
|
|
|
A) SHAREHOLDERS EQUITY |
49,24 |
38,91 |
10,33 |
26,56 |
|
|
|
|
|
|
B) DEFERRED INCOME |
|
0,22 |
|
|
|
|
|
|
|
|
C) PROVISIONS FOR LIABILITIES AND EXPENSES |
|
0,06 |
|
|
|
|
|
|
|
|
D) LONG TERM LIABILITIES |
25,71 |
13,08 |
12,63 |
96,59 |
|
|
|
|
|
|
E) SHORT TERM LIABILITIES |
25,06 |
47,70 |
-22,64 |
-47,47 |
|
|
|
|
|
|
F) SHORT TERM PROVISIONS FOR LIABILITIES AND EXPENSES |
|
0,03 |
|
|
|
|
|
|
|
|
LIABILITIES (A + B + C + D + E + F) |
100 |
100 |
|
|
|
|
|
|
|
Sectorial Financial Balance Comparison
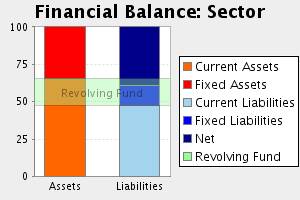
Comments to the Sectorial Analysis
In the 2006, the assets of the company were
formed in 56,52% of fixed assets and in 43,48Current Assets % In the sector,
the proportion of fixed assets was of 34,53%, 63,68% inferior, and the
proportion of current assets was of 65,47%, 33,59% superior.
The assets were financed in the company in
49,24% with own capitals , in 25,71% with fixed liabilities and in 25,06% with
current liabilities In the sector, the self financing represented 39,13%,
25,84% inferior. On the other hand the long term debts represented in the
sector an average of 13,14% financing, with a relative difference of 95,74% in
favour of the companyAnd, short term liabilities represented in the sector an
average of 47,74% financing, with a relative difference of 47,50% favourable to
the sector
The result of this company’s financial structure
is a turnover fund that represents 18,42% of the total assets; in the sector,
this same proportion is 17,74%, therefore, we can say that the company’s
turnover fund is 3,86% higher than the one in of the sector.
Analytical Account of Results
Figures given in %
|
|
COMPANY (2006) |
SECTOR |
DIFFERENCE |
DIFFERENCE RELATIVE |
|
Turnover |
100,00 |
98,79 |
1,21 |
1,22 |
|
Other operating income |
|
1,21 |
|
|
|
Production Value |
100,00 |
100,00 |
0,00 |
0,00 |
|
Operating expenses |
41,15 |
69,30 |
-28,15 |
-40,62 |
|
Other operation expenses |
23,71 |
11,24 |
12,47 |
110,92 |
|
Added value |
35,14 |
19,46 |
15,68 |
80,59 |
|
Labour cost |
19,41 |
13,29 |
6,12 |
46,03 |
|
Gross Economic Result |
15,73 |
6,16 |
9,57 |
155,15 |
|
Assets depreciation |
1,61 |
1,64 |
-0,03 |
-2,07 |
|
Variation in provision for current assets and
bad debt losses |
|
0,19 |
|
|
|
Net Economic Result |
14,12 |
4,33 |
9,79 |
226,02 |
|
Financial income |
0,14 |
0,39 |
-0,25 |
-64,19 |
|
Financial Charges |
1,60 |
0,92 |
0,68 |
74,48 |
|
Variation in financial investment provision |
|
0,01 |
|
|
|
Ordinary Activities Result |
12,67 |
3,80 |
8,87 |
233,60 |
|
Extraordinary income |
0,02 |
0,59 |
-0,57 |
-96,62 |
|
Extraordinary charges |
|
0,18 |
|
|
|
Variation in provision in fixed assets |
|
0,00 |
|
|
|
Results before Taxes |
12,68 |
4,21 |
8,47 |
201,12 |
|
Corporate taxes |
0,30 |
1,18 |
-0,88 |
-74,64 |
|
Net Result |
12,38 |
3,03 |
9,35 |
308,85 |
|
Assets depreciation |
1,61 |
1,64 |
-0,03 |
-2,07 |
|
Change of Provisions |
|
0,20 |
|
|
|
Net Self-Financing |
13,99 |
4,87 |
9,12 |
187,33 |
Main
Ratios
|
|
COMPANY (2006) |
PTILE25 |
PTILE50 |
PTILE75 |
|
STRUCTURAL RATIOS |
|
|
|
|
|
Management fund |
391.937,49 |
45,36 |
329,53 |
725,25 |
|
Indebtedness (%) |
50,76 |
47,35 |
65,92 |
79,88 |
|
External Funds on Net Worth |
1,03 |
0,90 |
1,94 |
3,97 |
|
GENERAL ACTIVITY RATIO |
|
|
|
|
|
Turnover Increase (%) |
-5,17 |
-2,27 |
5,50 |
16,03 |
|
Added value growth (%) |
19,27 |
-2,64 |
7,10 |
19,06 |
|
Cash Flow |
425.152,07 |
80,20 |
144,58 |
249,80 |
|
Labour Productivity |
1,81 |
1,23 |
1,40 |
1,73 |
|
Assets turnover |
1,43 |
1,26 |
1,74 |
2,40 |
|
Breakdown Point |
2.309.399,92 |
2.719.037,39 |
3.275.938,57 |
4.058.295,94 |
|
Security Margin of the Breakdown Point (%) |
24,00 |
5,89 |
11,60 |
21,03 |
|
ACTIVITY RATIOS |
|
|
|
|
|
Average Collection Period |
1 |
11 |
37 |
89 |
|
Inventory Turnover Period |
102 |
22 |
48 |
87 |
|
SOLVENCY RATIOS |
|
|
|
|
|
Payback Capacity |
0,39 |
0,05 |
0,11 |
0,21 |
|
Assets Guarantee |
1,97 |
1,24 |
1,51 |
2,10 |
|
Short Term Debts Proportion (%) |
49,36 |
73,62 |
90,97 |
99,80 |
|
Interest Coverage |
19,47 |
1,68 |
5,15 |
16,22 |
|
LIQUIDITY RATIOS |
|
|
|
|
|
Current Ratio |
1,74 |
1,04 |
1,31 |
1,82 |
|
Immediate liquidity |
0,11 |
0,05 |
0,19 |
0,52 |
|
Sales on Current Assets |
1.182 |
673 |
933 |
1.291 |
Results Analysis Ratios
|
|
COMPANY (2006) |
PTILE25 |
PTILE50 |
PTILE75 |
|
Economic profitability (%) |
20,17 |
3,04 |
5,60 |
9,78 |
|
Operating Profitability (%) |
14,12 |
1,63 |
3,20 |
5,92 |
|
Equity gearing |
1,82 |
1,50 |
2,19 |
3,60 |
|
Financial profitability (%) |
35,92 |
5,81 |
11,29 |
18,53 |
|
General Profitability (%) |
12,38 |
0,80 |
1,97 |
4,00 |
FOREIGN EXCHANGE
RATES
|
Currency |
Unit
|
Indian Rupees |
|
US Dollar |
1 |
Rs.42.82 |
|
UK Pound |
1 |
Rs.80.01 |
|
Euro |
1 |
Rs.63.83 |
RATING
EXPLANATIONS
|
RATING |
STATUS |
PROPOSED CREDIT LINE |
|
|
>86 |
Aaa |
Possesses an extremely sound financial base with the strongest
capability for timely payment of interest and principal sums |
Unlimited |
|
71-85 |
Aa |
Possesses adequate working capital. No caution needed for credit
transaction. It has above average (strong) capability for payment of interest
and principal sums |
Large |
|
56-70 |
A |
Financial & operational base are regarded healthy. General unfavourable
factors will not cause fatal effect. Satisfactory capability for payment of
interest and principal sums |
Fairly Large |
|
41-55 |
Ba |
Overall operation is considered normal. Capable to meet normal
commitments. |
Satisfactory |
|
26-40 |
B |
Unfavourable & favourable factors carry similar weight in credit
consideration. Capability to overcome financial difficulties seems
comparatively below average. |
Small |
|
11-25 |
Ca |
Adverse factors are apparent. Repayment of interest and principal sums
in default or expected to be in default upon maturity |
Limited with
full security |
|
<10 |
C |
Absolute credit risk exists. Caution needed to be exercised |
Credit not
recommended |
|
NR |
In view of the lack of information, we have no basis upon which to
recommend credit dealings |
No Rating |
|
This score serves as a reference to assess SC’s credit risk
and to set the amount of credit to be extended. It is calculated from a composite
of weighted scores obtained from each of the major sections of this report. The
assessed factors and their relative weights (as indicated through %) are as
follows:
Financial
condition (40%) Ownership
background (20%) Payment
record (10%)
Credit history
(10%) Market trend
(10%) Operational
size (10%)