![]()
MIRA
INFORM REPORT
|
Report Date : |
14.08.2008 |
IDENTIFICATION
DETAILS
|
Name : |
DERPROSA FILM
SOCIEDAD LIMITADA. |
|
|
|
|
Registered Office : |
Avenida Iberoamerica(Carretera
Montefrio), 56, Cp 23680, Alcala La Real Jaén |
|
|
|
|
Country : |
Spain |
|
|
|
|
Financials (as on) : |
31.12.2006 |
|
|
|
|
Date of Incorporation : |
10.02.2000 |
|
|
|
|
Legal Form : |
Limited Liability Company |
|
|
|
|
Line of Business : |
Rubber industry: Transformation of Rubber and
Plastics |
RATING &
COMMENTS
|
MIRA’s Rating : |
A |
|
RATING |
STATUS |
PROPOSED CREDIT LINE |
|
|
56-70 |
A |
Financial & operational base are regarded healthy. General
unfavourable factors will not cause fatal effect. Satisfactory capability for
payment of interest and principal sums |
Fairly Large |
|
Maximum Credit Limit : |
671.000,00 € |
|
|
|
|
Status : |
Good |
|
|
|
|
Payment Behaviour : |
Regular |
|
|
|
|
Litigation : |
Clear |
FINANCIAL REPORT
DERPROSA FILM SOCIEDAD LIMITADA.
TAX NUMBER: B82568213
EXECUTIVE
SUMMARY
Identification
Current Business Name: DERPROSA FILM
SOCIEDAD LIMITADA.
Other names: YES
Current Address: AVENIDA IBEROAMERICA
(CARRETERA MONTEFRIO), 56, CP 23680, ALCALA LA REAL JAÉN
Branches: 1
Telephone number: 953598169 Fax: 915153209
URL: www.derprosa.es Corporate e-mail: comercial@condepols.es
Commercial
Risk
Credit Appraisal: 671.000,00 €
Legal Actions: NO
Financial
Information
Latest Balance sheet sales (2006): 43.890.821,47 € (MERCANTILE REGISTER)
Result: 241.963,73 €
Total Assets: 58.480.919,05 €
Social Capital: 2.257.024,00 €
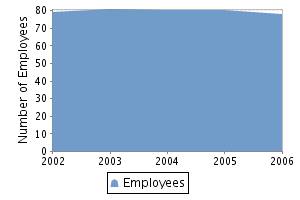
Employees: 80
Commercial
Information
Constitution Date: 10/02/2000
Business activity: Rubber industry: transformation of rubber and plastics
NACE Code: 2500
International Operations: Imports and Exports
Corporate
Structure
Sole Administrator:
DERPROCON XXI SOCIEDAD LIMITADA
Parent Company:
DERPROCON XXI SOCIEDAD LIMITADA.
Participations: 1
Other
Complementary Information
Latest proceeding published in BORME: 14/09/2007 Registration of accounts
Latest press article: 18/10/2007 EXPANSION ANDALUCIA (BRANCHES
INFORMATION)
Bank Entities: Yes
Credit
Appraisal
Maximum Credit
Favourable to 671.000,00 €
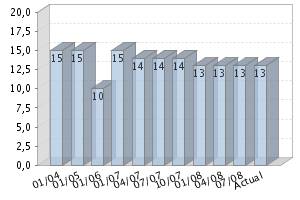
Rating
Evolution
Financial
Situation
Fiscal year2006
|
Treasury |
Good |
|
Indebtedness |
Average |
|
Profitability |
Null |
|
Balance |
Average |
Performance
|
Legal Actions |
None or Negligible |
|
Business Trajectory |
Excellent |
INCIDENTS 
Summary
LEGAL ACTIONS: No legal incidences registered
CLAIM FILED AGAINST THE ADMINISTRATION: No administrative claims registered
AFFECTED BY: No significant element.
FINANCIAL
ELEMENTS AND SECTORIAL COMPARATIVE
FINANCIAL ELEMENTS
Figures given in €
|
|
2004 (12) |
2005 (12) |
2006 (12) |
% ASSETS |
|
|
|
|
|
|
BALANCE SHEET ANALYSIS |
|
|
|
|
|
|
|
|
|
|
OWN FUNDS |
12.761.833,18 |
13.623.619,63 |
13.531.646,45 |
23,14 |
|
|
|
|
|
|
DEBT |
48.116.128,54 |
46.229.376,35 |
44.949.272,60 |
76,86 |
|
|
|
|
|
|
FIXED ASSETS |
42.071.894,89 |
39.798.345,79 |
38.637.060,87 |
66,07 |
|
|
|
|
|
|
TOTAL ASSETS |
60.877.961,72 |
59.852.995,98 |
58.480.919,05 |
|
|
|
|
|
|
|
|
|
|
|
|
|
|
|
|
|
|
|
2004 (12) |
2005 (12) |
2006 (12) |
% SALES |
|
|
|
|
|
|
PROFIT AND LOSS ACCOUNT ANALYSIS |
|
|
|
|
|
|
|
|
|
|
SALES |
39.847.844,86 |
43.182.400,83 |
43.890.821,47 |
|
|
|
|
|
|
|
ADDED VALUE |
6.792.479,53 |
8.302.449,62 |
6.505.829,32 |
14,82 |
|
|
|
|
|
|
EBITDA |
4.722.659,47 |
6.175.518,29 |
4.447.484,23 |
10,13 |
|
|
|
|
|
|
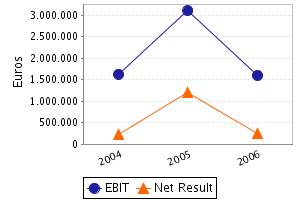
EBIT |
1.627.308,04 |
3.101.355,51 |
1.600.758,96 |
3,65 |
|
|
|
|
|
|
NET RESULT |
223.099,84 |
1.189.778,33 |
241.963,73 |
0,55 |
|
|
|
|
|
Balance Sheets Items Analysis
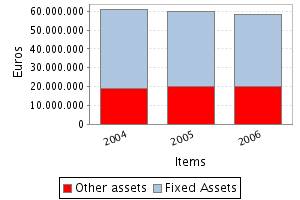
Balance Sheet Comments
Total assets of the company decreased in 1,68%
between 2004 and 2005.
This decrease has been greater in the fixed
assets that reduced in -5,40%.
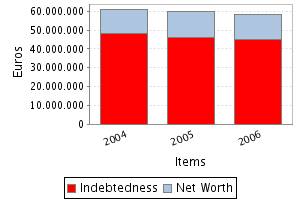
Assets reduction contrasts with net worth growth
of 6,75%. Therefore, the company’s indebtedness has reduced in 3,92%.
Total assets of the company decreased in 2,29%
between 2005 and 2006.
This decrease has been greater in the fixed
assets that reduced in -2,92%.
Assets reduction is partly explained by the net
worth decrease of0,68% nevertheless, the decrease of 2,77% in the indebtedness
explains mainly this reduction.
Profit and Loss Account Analysis
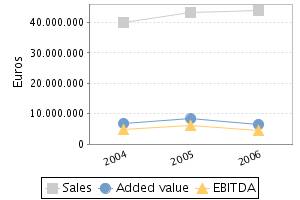
Profit and Loss Account Comments
The company’s sales figure grew 8,37% between
2004 and 2005.
The company’s EBIT grew 90,58% between 2004 and
2005.
This evolution implies an increase in the
company’s operating profitability.
The result of these variations is an increase of
the company’s Economic Profitability of 93,84% in the analysed period, being
this profitability of 5,18% in the year 2005.
The company’s Net Result grew 433,29% between
2004 and 2005.
This evolution, compared to the EBIT’s
performance, implies that the financial and extraordinary activities have had a
positive effect in the company’s Financial Profitability.
The result of these variations is an increase of
the company’s Economic Profitability of 399,55% in the analysed period, being
equal to 8,73% in the year 2005.
The company’s sales figure grew 1,64% between
2005 and 2006.
The company’s EBIT decreased in 48,39% between
2005 and 2006.
This evolution implies a reduction in the
company’s operating profitability.
The result of these variations is a decrease of
the company’s Economic Profitability of 47,17% in the analysed period, being
this profitability of 2,74% in the year 2006.
The company’s Net Result decreased in 79,66%
between 2005 and 2006.
This evolution, compared to the EBIT’s
performance, implies that the financial and extraordinary activities have had a
negative effect in the company’s Financial Profitability.
The result of these variations is a reduction of
the company’s profitability of 79,53% in the analysed period, being equal to
1,79% in the year 2006.
ANNUAL FINANCIAL REPORT ADDITIONAL DATA
Source: annual financial
report 2005
Results Distribution
Figures given in €
|
DISTRIBUTION BASE |
DISTRIBUTION TO |
||
|
Profit and Loss |
1.189.778,33 |
Retained earnings |
118.977,83 |
|
Carry Over |
0,00 |
Voluntary Reserve |
1.070.800,50 |
|
Voluntary reserves |
0,00 |
Prior years losses |
0,00 |
|
Reserves |
0,00 |
Carry Over |
0,00 |
|
Other concepts |
0,00 |
Other funds |
0,00 |
|
Total of Amounts to be
distributed |
1.189.778,33 |
Dividends |
0,00 |
|
|
|
Other Applications |
0,00 |
COMPARATIVE SECTOR ANALYSIS
Values table
Figures expressed in %
|
|
COMPANY (2006) |
SECTOR |
DIFFERENCE |
DIFFERENCE RELATIVE |
|
|
|
|
|
|
BALANCE SHEET ANALYSIS: % on the total assets |
|
|
|
|
|
|
|
|
|
|
OWN FUNDS |
23,14 |
36,93 |
-13,79 |
-37,35 |
|
|
|
|
|
|
DEBT |
76,86 |
63,07 |
13,79 |
21,87 |
|
|
|
|
|
|
FIXED ASSETS |
66,07 |
40,43 |
25,64 |
63,41 |
|
|
|
|
|
|
|
|
|
|
|
|
|
|
|
|
|
|
COMPANY (2006) |
SECTOR |
DIFFERENCE |
DIFFERENCE RELATIVE |
|
|
|
|
|
|
PROFIT AND LOSS ACCOUNT ANALYSIS: % on the total
operating income |
|
|
|
|
|
|
|
|
|
|
SALES |
98,71 |
98,82 |
-0,11 |
-0,11 |
|
|
|
|
|
|
ADDED VALUE |
14,63 |
28,40 |
-13,76 |
-48,47 |
|
|
|
|
|
|
EBIT |
3,60 |
6,68 |
-3,08 |
-46,13 |
|
|
|
|
|
|
NET RESULT |
0,54 |
4,39 |
-3,85 |
-87,61 |
|
|
|
|
|
Sector Composition
Compared sector (NACE): 25
Number of companies: 53
Size (Sales Figure) : > 40.000.000,00 Euros
Comments on the
sectorial comparative
Compared to its sector the assets of the companies show a greater
proportion of fixed assets. Specifically the difference with the sector average
is 25,64% , which means a relative difference of 63,41% .
In liabilities composition the company appeals on a wider scale to self
financing, being the proportion of net worth of 13,79% inferior, which means a
relative difference of 37,35% 13,79% more than the sector, which means a
difference of 21,87% .
The proportion that the sales mean to the company’s total ordinary income
is 98,71%, 0,11% lower than in the sector, which means a relative difference of
0,11% .
The company’s EBIT was positive and was 3,60% with regard to the total
ordinary income, 3,08% less than the sector, which means a relative difference
of 46,13% .
The company’s capacity to generate operating income is equal to that of the
sector as its ratio EBIT/Sales is also equal.
The company’s net result was positive and equal to 0,54% with regard to the
total ordinary income, 3,85% less than the sector, which means a relative
difference of 87,61% .
The financial and
extraordinary results and the tax impact have had a negative impact on the Net
result in the company with a worse behaviour than in the sector; as a
consequence, the company shows a worse Net Result/EBIT ratio (REBEmpresa vs.
REBSector).
ADDRESSES
Current Legal Seat Address:
AVENIDA IBEROAMERICA (CARRETERA MONTEFRIO), 56
23680 ALCALA LA REAL JAÉN
Previous Seat Address:
STREET VELAZQUEZ, 61
28001 MADRID
Characteristics of the current address
Type of premises: office, factory, warehouse
Property: owned; with no official confirmation
Local Situation: main
Branches 
|
STREET |
POSTAL CODE |
TOWN |
PROVINCE |
|
STREET CRONOS 63 4º PLANTA |
28037 |
MADRID |
Madrid |
1 branches registered
CORPORATE
STRUCTURE
ADMINISTRATIVE LINKS
Main Board members, Directors and Auditor ![]()
|
POSITION |
SURNAMES AND NAME |
APPOINTMENT DATE |
|
|
SOLE ADMINISTRATOR |
DERPROCON XXI SOCIEDAD LIMITADA |
26/07/2006 |
|
|
AUDITOR |
APPOINTMENT DATE |
||
|
DELOITTE SOCIEDAD LIMITADA |
28/02/2007 |
||
Functional Managers
|
POSITION |
SURNAMES AND NAME |
|
General Manager |
TORAN ALFONSO |
|
Financial Manager |
PEDREIRA VEGA MANUEL |
|
Commercial Manager |
LOPEZ BAILLO IGNACIO |
FINANCIAL LINKS
|
|
BUSINESS NAME |
CIF / COUNTRY |
% |
SOURCE |
DATA INF. |
|
|
DERPROCON XXI SOCIEDAD LIMITADA. |
B23456205 |
100,00 |
OWN SOURCES |
29/04/2008 |
|
|
BUSINESS NAME |
CIF / COUNTRY |
% |
SOURCE |
DATA INF. |
|
|
DERCON CORPORATION |
ESTADOS UNIDOS |
100,00 |
TRADE REG. |
31/12/2004 |
CREDIT
INFORMATION
Constitution Date: 10/02/2000
Foundation Date: 01/01/2000
Founder / Origin: LA TITULAR ES LA FUNDADORA INICIAL DEL NEGOCIO
Business
activity 
Activity: Rubber industry: transformation of rubber and plastics
NACE Code: 2500
NACE Activity: Manufacture of rubber and plastic products
Business: A). FABRICACION Y TRANSFORMACION DE POLIMEROS SINTETICOS Y DE CUALQUIER
FIBRA, NATURAL, ARTIFICIAL O SINTETICA PARA LA OBTENCION DE CORDELERIA,
CAPACHOS Y CAPACHERAS, PERFILES, TUBERIAS, RAFIAS DE CUALQUIER NATURALEZA Y
Activity description: FABRICACION DE FILM DE POLIESTER METALIZADO
Employees 
Number of total employees: 80 (2008)
Number of fixed employees: 100,00%
Number of temporary employees: 0,00%
Employees evolution
COMMERCIAL
OPERATIONS 
PURCHASES
Payments (estimated):
Imports from: UNION EUROPEA
SUPPLIERS
|
BUSINESS NAME |
INTERNATIONAL |
|
CONDEPOLS SA |
NO |
1 proveedores
SALES
Collection (estimated):
Exports to: UNION EUROPEA
Banks 
|
ENTITY |
BRANCH |
ADDRESS |
TOWN OR CITY |
PROVINCE |
|
DEUTSCHE BANK, S.A.E. |
|
|
ALCALA DEL REAL |
|
|
BANCO SANTANDER, S.A. |
0118 |
CL VERA CRUZ 2 APDO. 00003 |
ALCALA LA REAL |
Jaén |
|
BNP PARIBAS ESPAÑA, S.A. |
|
|
MADRID |
|
|
BANCO BILBAO VIZCAYA ARGENTARIA, S.A. |
4000 |
ALCALA, 16 |
MADRID |
Madrid |
|
CAJA DE AHORROS Y PENSIONES DE BARCELONA |
|
|
MADRID |
|
5 bank entities registered
Brands,
Signs and Commercial Names 
FORMER NAMES:
•
PASBOR XXI S.L.
LEGAL
STRUCTURE
Constitution Data
Register Date: 10/02/2000
Register town: Madrid
Announcement number: 97325
Legal form: LIMITED LIABILITY COMPANY
Social Capital: 3.006 €
Current Legal Form: LIMITED LIABILITY COMPANY
Current Capital: 2.257.024,00 €
Legal
Aspects
Obligation to fill in Financial
Statements: YES
Chamber census: YES (2006)
Listed on a Stock Exchange: NO
B.O.R.M.E.(Official
Companies Registry Gazette) 
Registered Proceedings
|
PROCEEDINGS |
DATE |
NOTICE NUM. |
TRADE REG. |
|
Other statutory acts |
31/08/2007 |
450237 |
Jaén |
|
Appointments |
28/02/2007 |
121475 |
Jaén |
|
Resignations |
26/07/2006 |
381113 |
Jaén |
|
Appointments |
26/07/2006 |
381113 |
Jaén |
Other Proceedings published
|
PROCEEDINGS |
DATE |
NOTICE NUM. |
TRADE REG. |
|
Registration of
accounts (2006) Individual |
14/09/2007 |
518273 |
Jaén |
Press
articles 
18/10/2007 EXPANSION
ANDALUCIA (BRANCHES INFORMATION)
AURANTIA 2003 ESTA A PUNTO DE CERRAR LA COMPRA DE
LAS PLANTAS DE FABRICACION DE ENVASES DE PLASTICO Y TEJIDOS INDUSTRIALES Y
AGRICOLAS DE CONDEPOLS Y DERPOSA EN ALCALA LA REAL (JAEN). EL IMPORTE DE LA
OPERACION NO HA TRASCENDIDO.
07/07/2007 EXPANSION
ANDALUCIA (FINANCIAL INFORMATION)
DERPROSA FILM CONTINUA REFORZANDO SU PRESENCIA
EN ANDALUCIA AL OBJETO DE MANTENERSE ENTRE LOS LIDERES DE ESPAÑA EN EL SECTOR
DEL PLASTICO. LA EMPRESA, UBICADA EN ALCALA LA REAL (JAEN), VA A INVERTIR 18
MM. PARA LA PUESTA EN MARCHA DE UNA NUEVA LINEA DE PRODUCCION DE FILMS DE
ULTIMA TECNOLOGIA MONO Y BIORIOENTADO, CON LA QUE PRETENDE CREAR 20 PUESTOS DE
TRABAJO. EL PROYECTO CUENTA CON UN INCENTIVO POR VALOR DE 1,6 MM. DERPROSA
FORMA PARTE, JUNTO A CONDEPOLS, DE GRUPO DEPROCOM, QUE CERRO EL PASADO
EJERCICIO CON UNAS VENTAS DE 100 MM. Y UNA PLANTILLA DE 220 PERSONAS.
FINANCIAL
INFORMATION
The information on the last account contained in
this report is extracted from the Mercantile Register file of the legal address
of the Company and dated 28/09/2007.
BALANCE SHEET
Assets
Figures given in €
|
|
31/12/2004 (12) |
31/12/2005 (12) |
31/12/2006 (12) |
|
A) DUE FROM SHAREHOLDERS
FOR UNCALLED CAPITAL |
|
|
|
|
B) FIXED ASSETS |
42.071.894,89 |
39.798.345,79 |
38.637.060,87 |
|
I. Incorporation costs |
|
|
|
|
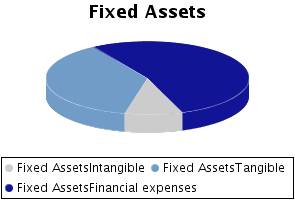
II. Intangible fixed
assets |
5.422.966,68 |
3.502.293,93 |
3.541.078,33 |
|
R & D expenses |
1.306.405,26 |
1.306.405,26 |
1.391.530,80 |
|
Concessions, patents, licences , trademarks |
|
|
|
|
Goodwill |
3.525.170,75 |
3.525.170,75 |
3.525.170,75 |
|
Acquired rights from finance leases |
|
|
|
|
Software |
|
|
|
|
Leasing |
3.567.936,56 |
1.683.000,00 |
2.303.473,58 |
|
Cash advance |
|
|
|
|
Provisions |
|
|
|
|
Depreciation |
-2.976.545,89 |
-3.012.282,08 |
-3.679.096,80 |
|
III. Tangible fixed
assets |
16.719.811,96 |
16.101.992,20 |
14.469.149,13 |
|
Property, plant and equipment |
7.413.781,06 |
7.413.781,06 |
7.413.781,06 |
|
Machinery, equipment and other |
37.847.310,19 |
39.972.283,62 |
40.467.398,92 |
|
Other property plant and equipment |
138.601,54 |
139.915,54 |
143.132,72 |
|
Prepaid expenses on fixed assets |
|
|
|
|
Other assets |
1.096.291,25 |
1.133.012,87 |
1.156.160,00 |
|
Provisions |
|
|
|
|
Depreciation |
-29.776.172,08 |
-32.557.000,89 |
-34.711.323,57 |
|
IV. Financial fixed
assets |
19.929.116,25 |
20.194.059,66 |
20.626.833,41 |
|
Shares in affiliated companies |
19.609.947,14 |
19.609.947,14 |
19.609.947,14 |
|
Receivables in affiliated companies |
109.111,11 |
320.142,20 |
712.260,56 |
|
Shares in associated companies |
|
|
|
|
Loans to associated companies |
|
|
|
|
Securities |
601,01 |
601,01 |
601,01 |
|
Other loans |
|
|
|
|
Long term deposits and guarantees |
|
|
|
|
Provisions |
|
|
|
|
Taxes receivable |
209.456,99 |
263.369,31 |
304.024,70 |
|
V.Owners equity |
|
|
|
|
VI.Long term trade
liabilities |
|
|
|
|
C) DEFERRED EXPENSES |
461.726,38 |
255.624,07 |
144.425,05 |
|
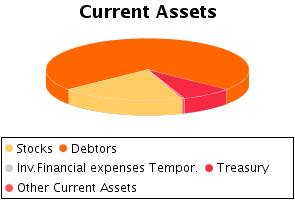
D) CURRENT ASSETS |
18.344.340,45 |
19.799.026,12 |
19.699.433,13 |
|
I. Shareholders by
required outlays |
|
|
|
|
II. Stocks |
3.879.735,93 |
3.886.821,25 |
3.879.518,68 |
|
Goods available for sale |
|
|
|
|
Raw material inventory |
1.455.191,34 |
1.671.296,43 |
1.630.144,70 |
|
Work in Progress |
|
|
|
|
Finished goods |
2.395.911,69 |
2.222.266,70 |
2.210.003,70 |
|
Subproducts and recycled materials |
98.325,77 |
139.546,77 |
105.771,80 |
|
Cash advance |
|
|
|
|
Provisions |
-69.692,87 |
-146.288,65 |
-66.401,52 |
|
III. Debtors |
13.259.224,01 |
13.794.772,61 |
14.128.942,82 |
|
Clients |
14.683.214,41 |
14.373.752,01 |
14.238.303,00 |
|
Amounts owned by affiliated companies |
17.484,16 |
8.062,31 |
8.062,31 |
|
Amounts owned by associated companies |
|
|
|
|
Other debts |
18.671,01 |
10.404,90 |
540.342,79 |
|
Staff Expenses |
512,54 |
122,78 |
212,54 |
|
Government |
120.595,20 |
281.559,92 |
326.626,49 |
|
Provisions |
-1.581.253,31 |
-879.129,31 |
-984.604,31 |
|
IV. Temporary financial
investment |
|
|
|
|
Shares in affiliated companies |
|
|
|
|
Receivables in affiliated companies |
|
|
|
|
Shares in associated companies |
|
|
|
|
Loans to associated companies |
|
|
|
|
Short term investment |
|
|
|
|
Other loans |
|
|
|
|
Short Term Deposit and guarantees |
|
|
|
|
Provisions |
|
|
|
|
V. Short-term own shares |
|
|
|
|
VI. Treasury |
1.139.172,66 |
2.064.236,31 |
1.614.004,79 |
|
VII. Periodification
adjustments |
66.207,85 |
53.195,95 |
76.966,84 |
|
ASSETS (A + B + C + D) |
60.877.961,72 |
59.852.995,98 |
58.480.919,05 |
Assets composition
Liabilities
Figures given in €
|
|
31/12/2004 (12) |
31/12/2005 (12) |
31/12/2006 (12) |
|
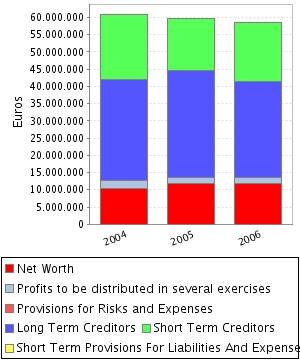
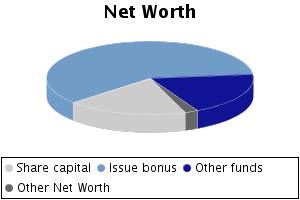
A) SHAREHOLDERS EQUITY |
10.500.226,65 |
11.690.004,98 |
11.931.968,71 |
|
I. Share capital |
2.257.024,00 |
2.257.024,00 |
2.257.024,00 |
|
II. Issue bonus |
7.148.815,96 |
7.148.815,96 |
7.148.815,96 |
|
III.Revaluation reserve |
|
|
|
|
IV.Reserves |
871.286,85 |
1.094.386,69 |
2.284.165,02 |
|
Retained earnings |
103.433,57 |
125.743,55 |
244.721,38 |
|
Sinking fund from owner equity |
|
|
|
|
Reserve for the parent company capital |
|
|
|
|
Statutory reserve |
|
|
|
|
Other funds |
767.853,28 |
968.643,14 |
2.039.443,64 |
|
Capital adjustments in Euros |
|
|
|
|
V.Results from previous
years |
|
|
|
|
Carry Over |
|
|
|
|
Prior years losses |
|
|
|
|
Loans from partners for losses compensation |
|
|
|
|
VI.Profit and Losses |
223.099,84 |
1.189.778,33 |
241.963,73 |
|
VII.Dividend paid during
the year |
|
|
|
|
VIII.Own shares for
capital reduction |
|
|
|
|
B) DEFERRED INCOME |
2.261.606,53 |
1.933.614,65 |
1.599.677,74 |
|
Capital grants |
2.228.871,20 |
1.901.639,31 |
1.598.316,40 |
|
Positive change difference |
32.735,33 |
31.975,34 |
1.361,34 |
|
Other deferred income |
|
|
|
|
Fiscal deferred income |
|
|
|
|
C) PROVISIONS FOR
LIABILITIES AND EXPENSES |
|
|
|
|
Provision for pensions plans |
|
|
|
|
Provision for taxes |
|
|
|
|
Other provisions |
|
|
|
|
Reversion fund |
|
|
|
|
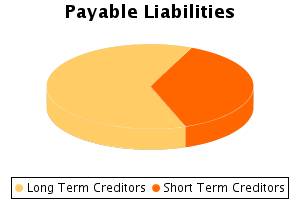
D) LONG TERM LIABILITIES |
29.254.685,45 |
30.854.465,93 |
27.935.836,87 |
|
I.Negotiable bonds and
other negotiable values |
|
|
|
|
Non convertible securities |
|
|
|
|
Convertible securities |
|
|
|
|
Other convertible debentures |
|
|
|
|
II.Debt with bank
entities |
6.327.092,82 |
10.217.677,12 |
9.883.304,59 |
|
Long term bank loans |
5.883.051,19 |
10.153.846,00 |
9.393.990,44 |
|
Leasing |
444.041,63 |
63.831,12 |
489.314,15 |
|
III.Debts with associated
and affiliated companies |
22.838.370,71 |
20.631.708,59 |
18.047.452,03 |
|
With affiliated companies |
11.839.039,51 |
11.632.377,39 |
11.048.120,83 |
|
Associated companies |
10.999.331,20 |
8.999.331,20 |
6.999.331,20 |
|
IV. Other creditors |
89.221,92 |
5.080,22 |
5.080,25 |
|
Bills payable |
|
|
|
|
Other debts |
89.221,92 |
5.080,22 |
5.080,25 |
|
Long term deposit and guaranties |
|
|
|
|
Taxes receivable |
|
|
|
|
V. Deferred debts on
shares |
|
|
|
|
From affiliated companies |
|
|
|
|
From associated companies |
|
|
|
|
Other companies |
|
|
|
|
VI. Long term debt with
creditor |
|
|
|
|
E) SHORT TERM LIABILITIES |
18.861.443,09 |
15.374.910,42 |
17.013.435,73 |
|
I.Negotiable bonds and
other negotiable values |
|
|
|
|
Non convertible securities |
|
|
|
|
Convertible securities |
|
|
|
|
Other convertible debentures |
|
|
|
|
Interests from bonds |
|
|
|
|
II.Debt with bank
entities |
5.699.087,80 |
2.960.601,17 |
3.086.902,81 |
|
Loans and other debts |
5.680.558,35 |
2.960.601,17 |
3.082.283,21 |
|
Debt interest |
18.529,45 |
|
4.619,60 |
|
Leasing |
|
|
|
|
III. Short term debts
with associated and affiliated companies |
1.434.633,54 |
721.949,57 |
1.131.568,35 |
|
With affiliated companies |
|
|
|
|
Associated companies |
1.434.633,54 |
721.949,57 |
1.131.568,35 |
|
IV. Commercial creditors |
11.086.858,10 |
11.020.346,46 |
12.131.079,93 |
|
Accounts payable |
|
|
|
|
Expenses |
11.086.858,10 |
11.020.346,46 |
12.131.079,93 |
|
Bills payable |
|
|
|
|
V. Other non-commercial
debt |
630.743,00 |
661.892,57 |
653.763,99 |
|
Government |
158.537,84 |
130.885,40 |
94.900,32 |
|
Bills payable |
|
|
|
|
Other debts |
346.968,26 |
381.488,27 |
465.345,92 |
|
Accounts receivable |
122.924,95 |
147.206,95 |
91.205,80 |
|
Short term deposits and guarantees |
2.311,95 |
2.311,95 |
2.311,95 |
|
VI. Provisions for
current assets |
10.120,65 |
10.120,65 |
10.120,65 |
|
VII. Periodification
adjustments |
|
|
|
|
F) SHORT TERM PROVISIONS
FOR LIABILITIES AND EXPENSES |
|
|
|
|
LIABILITIES (A + B + C +
D + E + F) |
60.877.961,72 |
59.852.995,98 |
58.480.919,05 |
Liabilities Composition
PROFIT AND LOSS ACCOUNT
Itams of the Profit and Loss Account
Figures given in €
|
|
31/12/2004 (12) |
31/12/2005 (12) |
31/12/2006 (12) |
|
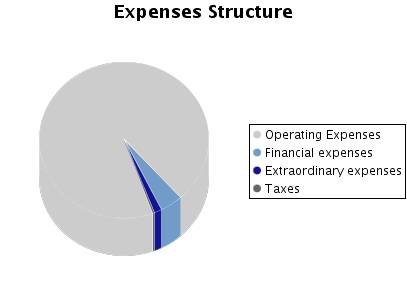
A) EXPENSES (A.1 a A.16) |
41.115.451,75 |
42.818.887,38 |
45.614.080,66 |
|
A.1.Reduction in stocks
of finished goods and work in progress |
|
132.424,00 |
46.037,97 |
|
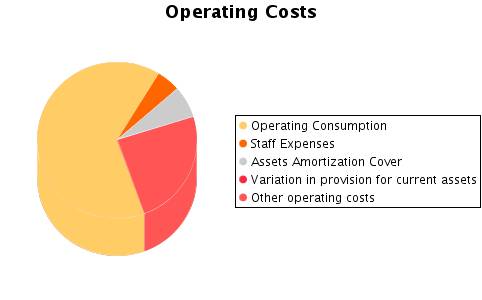
A.2.Supplies |
22.839.654,42 |
24.624.957,51 |
27.513.493,45 |
|
Material consumed |
|
|
|
|
Raw materials consumed |
22.246.485,10 |
24.058.382,17 |
26.957.390,10 |
|
Other expenses |
593.169,32 |
566.575,34 |
556.103,35 |
|
A.3. Labour cost |
2.069.820,06 |
2.126.931,33 |
2.058.345,09 |
|
Wages |
1.555.959,88 |
1.584.780,49 |
1.511.898,02 |
|
Social security expenses |
513.860,18 |
542.150,84 |
546.447,07 |
|
A.4. Assets depreciation |
2.964.170,01 |
2.816.565,00 |
2.821.137,40 |
|
A.5.Variance in the
traffic provisions |
131.181,42 |
257.597,78 |
25.587,87 |
|
Variance in provision for inventory |
-2.428,58 |
76.595,78 |
-79.887,13 |
|
Variance in provision for bad debts |
133.610,00 |
181.002,00 |
105.475,00 |
|
Variance in provision for other current assets |
|
|
|
|
A.6. Other operating
costs |
10.712.383,48 |
10.123.753,82 |
10.397.991,62 |
|
External costs |
10.608.177,27 |
10.015.649,81 |
10.290.424,88 |
|
Taxes |
104.206,21 |
108.104,01 |
107.566,74 |
|
Other day to day expenses |
|
|
|
|
Allowance to reversion fund |
|
|
|
|
A.I.OPERATING RESULT
(B.1+B.2+B.3+B.4-A.1-A.2-A.3-A.4-A.5-A.6) |
1.627.308,04 |
3.101.355,51 |
1.600.758,96 |
|
A.7.Financial expenses
and similar |
1.822.900,55 |
1.967.621,94 |
1.686.753,40 |
|
Debts with related companies |
259.191,27 |
262.300,90 |
345.663,60 |
|
Debts with associated companies |
574.126,23 |
511.353,82 |
451.075,98 |
|
Other companies debts By debts with third
parties and similar expenses |
989.583,05 |
1.193.967,22 |
890.013,82 |
|
Losses from financial investments |
|
|
|
|
A.8. Variation in
financial investment provision |
|
|
|
|
A.9.Negative exchange
difference |
507.716,98 |
412.438,82 |
330.667,19 |
|
A.II.POSITIVE FINANCIAL
RESULTS (B.5+B.6+B.7+B.8-A.7-A.8-A.9) |
|
|
|
|
A.III.PROFIT FROM
ORDINARY ACTIVITIES (A.I+A.II-B.I-B.II) |
|
1.163.771,91 |
|
|
A.10. Variation in
provision in fixed assets |
|
|
|
|
A.11. Losses in fixed
assets |
|
|
|
|
A.12. Losses from own shares and bonds |
|
|
|
|
A.13. Extraordinary charges |
90,70 |
0,02 |
604.949,56 |
|
A.14.Other exercises’ expenses and losses |
|
|
|
|
A.IV.POSITIVE EXTRAORDINARY RESULT
(B.9+B.10+B.11+B.12+B.13-A.10-A.11-A.12-A.13-A.14) |
390.770,75 |
382.603,58 |
425.563,85 |
|
A.V.PROFIT BEFORE TAXES (A.III+A.IV-B.III-B.IV) |
290.633,97 |
1.546.375,49 |
371.080,84 |
|
A.15.Corporate Taxes |
67.534,13 |
356.597,16 |
129.117,11 |
|
A.16. Other taxes |
|
|
|
|
A.VI.EXERCISE RESULT (PROFIT) (A.V-A.14-A.15) |
223.099,84 |
1.189.778,33 |
241.963,73 |
|
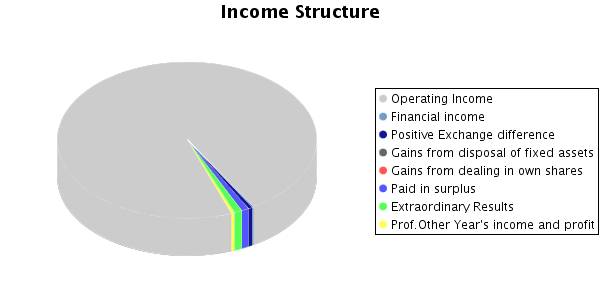
B) INCOMES (B.1 a B13) |
41.338.551,59 |
44.008.665,71 |
45.856.044,39 |
|
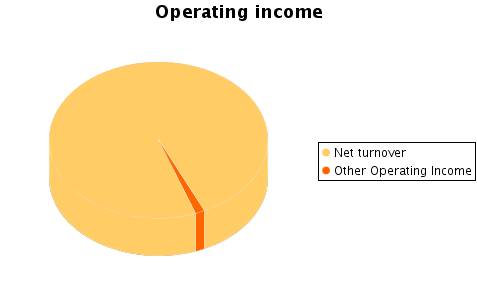
B.1. Turnover |
39.847.844,86 |
43.182.400,83 |
43.890.821,47 |
|
Sales |
41.136.185,87 |
43.836.761,54 |
44.539.434,83 |
|
Services provided |
|
|
|
|
Refunds and sale reminders |
-1.288.341,01 |
-654.360,71 |
-648.613,36 |
|
B.2.Increase in inventory
of finished goods and works in progress |
234.656,12 |
|
|
|
B.3.Expenses capitalized |
180.000,00 |
|
78.482,00 |
|
B.4. Other operating
income |
82.016,45 |
1.184,12 |
494.048,89 |
|
Other incomes |
82.016,45 |
|
493.698,89 |
|
Grants |
|
1.184,12 |
350,00 |
|
Excess in provision for liabilities and
charges |
|
|
|
|
B.I.OPERATING LOSSES (A.1+A.2+A.3+A.4+A.5+A.6-B.1-B.2-B.3-B.4) |
|
|
|
|
B.5.Incomes from share participations |
|
|
|
|
From affiliated companies |
|
|
|
|
From associated companies |
|
|
|
|
From other companies |
|
|
|
|
B.6.Income from other securities and credits to fixed assets |
|
|
|
|
From affiliated companies |
|
|
|
|
From associated companies |
|
|
|
|
Other companies |
|
|
|
|
B.7.Other interests and similar |
26.401,94 |
6.604,84 |
87.661,67 |
|
From affiliated companies |
|
|
|
|
From associated companies |
|
|
|
|
Other Interests |
26.401,94 |
6.604,84 |
87.661,67 |
|
Profits from investments |
|
|
|
|
B.8. Positive change
difference |
576.770,77 |
435.872,32 |
274.516,95 |
|
B.II. NEGATIVE FINANCIAL
RESULTS (A.7+A.8+A.9-B.5-B.6-B.7-B.8) |
1.727.444,82 |
1.937.583,60 |
1.655.241,97 |
|
B.III.LOSSES FROM
ORDINARY ACTIVITIES (B.I+B.II-A.I-A.II) |
100.136,78 |
|
54.483,01 |
|
B.9.B.9. Gains from
disposal of fixed assets |
|
|
|
|
B.10.Gains from dealing
in own shares |
|
|
|
|
B.11. Paid in surplus |
386.743,46 |
381.805,00 |
381.800,00 |
|
B.12. Extraordinary
income |
4.117,99 |
798,60 |
476.130,66 |
|
B.13.Other year’s income
and profits |
|
|
172.582,75 |
|
B.IV.NEGATIVE
EXTRAORDINARY LOSSES (A.10+A.11+A.12+A.13+A.14-B.9-B.10-B.11-B.12-B.13) |
|
|
|
|
B.V.LOSS BEFORE TAXES
(B.III+B.IV-A.III-A.IV) |
|
|
|
|
B.VI.EXERCISE RESULTS
(LOSS) (B.V+A.14+A.15) |
|
|
|
Composition of the Profit and Loss Account
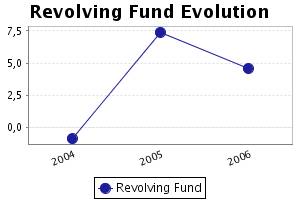
FINANCIAL BALANCE
Here the Main Capital Amounts of the company and
the Revolving Fund Evolution are analysed.
Financial Balance Table
Figures given in €
|
|
31/12/2004 (12) |
% |
31/12/2005 (12) |
% |
31/12/2006 (12) |
% |
|
A) DUE FROM SHAREHOLDERS FOR UNCALLED CAPITAL |
|
|
|
|
|
|
|
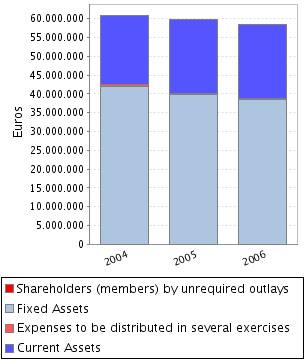
B) FIXED ASSETS |
42.071.894,89 |
69,11 |
39.798.345,79 |
66,49 |
38.637.060,87 |
66,07 |
|
C) DEFERRED EXPENSES |
461.726,38 |
0,76 |
255.624,07 |
0,43 |
144.425,05 |
0,25 |
|
D) CURRENT ASSETS |
18.344.340,45 |
30,13 |
19.799.026,12 |
33,08 |
19.699.433,13 |
33,69 |
|
ASSETS (A + B + C + D) |
60.877.961,72 |
|
59.852.995,98 |
|
58.480.919,05 |
|
|
|
||||||
|
A) SHAREHOLDERS EQUITY |
10.500.226,65 |
17,25 |
11.690.004,98 |
19,53 |
11.931.968,71 |
20,40 |
|
B) DEFERRED INCOME |
2.261.606,53 |
3,71 |
1.933.614,65 |
3,23 |
1.599.677,74 |
2,74 |
|
C) PROVISIONS FOR LIABILITIES AND EXPENSES |
|
|
|
|
|
|
|
D) LONG TERM LIABILITIES |
29.254.685,45 |
48,05 |
30.854.465,93 |
51,55 |
27.935.836,87 |
47,77 |
|
E) SHORT TERM LIABILITIES |
18.861.443,09 |
30,98 |
15.374.910,42 |
25,69 |
17.013.435,73 |
29,09 |
|
F) SHORT TERM PROVISIONS FOR LIABILITIES AND
EXPENSES |
|
|
|
|
|
|
|
LIABILITIES (A + B + C + D + E + F) |
60.877.961,72 |
|
59.852.995,98 |
|
58.480.919,05 |
|
Financial Balance Composition
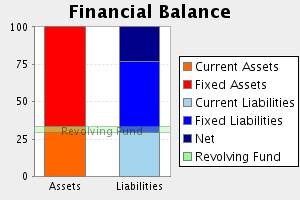
Comments on Financial Balance
In the 2004, the assets of the company were
formed in 69,87% of Fixed Assets and in 30,13% of Current Assets.This assets
were financed in 20,96% with own capitals, and in 48,05% with long term debt
and in 30,98% with current liabilities.
The result of this financial structure is a
negative turnover fund of -517.102,64 Euros, which is equivalent to -0,85%
proportion of the company’s total assets.
In the 2005, the assets of the company were
formed in 66,92% of Fixed Assets and in 33,08% of Current Assets.This assets
were financed in 22,76% with own capitals, and in 51,55% with long term debt
and in 25,69% with current liabilities.
The result of this financial structure is a
positive turnover fund of 4.424.115,70 Euros, which is equivalent to
7,39% proportion of the company’s total assets.
This measure has increased with respect to the
previous exercise in 955,56% having also increased its proportion with respect
to the total assets of the company.
In the 2006, the assets of the company were
formed in 66,31% of Fixed Assets and in 33,69% of Current Assets.This assets
were financed in 23,14% with own capitals, and in 47,77% with long term debt
and in 29,09% with current liabilities.
The result of this financial structure is a
positive turnover fund of 2.685.997,40 Euros, which is equivalent to
4,59% proportion of the company’s total assets.
This measure has diminished with respect to the
previous exercise in 39,29% having also diminished its proportion with respect
to the total assets of the company.
RATIOS
Main Ratios
|
|
31/12/2004 (12) |
31/12/2005 (12) |
31/12/2006 (12) |
|
STRUCTURAL RATIOS |
|
|
|
|
Management fund |
-517.102,64 |
4.424.115,70 |
2.685.997,40 |
|
Management Fund Requirement |
4.042.812,50 |
5.320.480,56 |
4.158.895,42 |
|
Indebtedness (%) |
79,04 |
77,24 |
76,86 |
|
External Funds on Net Worth |
3,77 |
3,39 |
3,32 |
|
GENERAL ACTIVITY RATIO |
|
|
|
|
Turnover Increase (%) |
3,22 |
8,37 |
1,64 |
|
Added value growth (%) |
-10,83 |
22,23 |
-21,64 |
|
Cash Flow |
3.318.451,27 |
4.263.941,11 |
3.088.689,00 |
|
Labour Productivity |
3,28 |
3,90 |
3,16 |
|
Assets turnover |
0,66 |
0,72 |
0,75 |
|
Breakdown Point |
36.381.120,34 |
35.915.259,19 |
40.252.759,39 |
|
Security Margin of the Breakdown Point (%) |
9,30 |
16,83 |
9,47 |
|
ACTIVITY RATIOS |
|
|
|
|
Average Payment Period |
177 |
160 |
158 |
|
Average Collection Period |
120 |
115 |
116 |
|
Inventory Turnover Period |
35 |
32 |
32 |
|
SOLVENCY RATIOS |
|
|
|
|
Payback Capacity |
0,07 |
0,09 |
0,07 |
|
Assets Guarantee |
1,26 |
1,29 |
1,30 |
|
Short Term Debts Proportion (%) |
39,20 |
33,26 |
37,85 |
|
Interest Coverage |
1,15 |
1,75 |
1,00 |
|
LIQUIDITY RATIOS |
|
|
|
|
Current Ratio |
0,97 |
1,29 |
1,16 |
|
Immediate liquidity |
0,06 |
0,13 |
0,10 |
|
Treasury |
-4.559.915,14 |
-896.364,86 |
-1.472.898,02 |
|
Sales on Current Assets |
782 |
785 |
802 |
Results Analysis Ratios
|
|
31/12/2004 (12) |
31/12/2005 (12) |
31/12/2006 (12) |
|
Economic profitability (%) |
2,67 |
5,18 |
2,74 |
|
Operating Profitability (%) |
4,08 |
7,18 |
3,65 |
|
Equity gearing |
-0,29 |
1,65 |
-0,15 |
|
Financial profitability (%) |
1,75 |
8,73 |
1,79 |
|
General Profitability (%) |
0,56 |
2,76 |
0,55 |
Comments on the Results Analysis Ratios
The economic profitability in the year2005 achieved
a 5,18% positive level, due to a 7,18% economic margin and to an assets
turnover of0,72%.
The economic profitability in the year has
increased from 2,67% up to 5,18%. This growth is due to the economic margin
increase, from 4,08% to the current 7,18Y%, and to the assets turnover index,
which in the last period has achieved 0,72, compared to 0,66 del 2004.
Financial profitability on 2005 achieved a
8,73%.
The company’s financial structure has instigated
its economic profitability with an indebtedness level of 1,65.
The general profitability on 2005 achieved a
2,76%.
The economic profitability in the year2006
achieved a 2,74% positive level, due to a 3,65% economic margin and to an
assets turnover of0,75%.
The economic profitability in the year has reduced
from 5,18% up to 2,74% of2006, even if it remains positive. Assets turnover
increase whose index has passed from 0,72 to 0,75, could not compensate
operating profitability reduction from7,18% to the current level of 3,65%.
Financial profitability on 2006 achieved a
1,79%.
The company’s financial structure has endangered
its profitability with an indebtedness level -0,15.
The general profitability on 2006 achieved a
0,55%.
SECTORIAL ANÁLYSIS
Large Capital Amounts and Financial Balance
Figures given in %
|
|
COMPANY (2006) |
SECTOR |
DIFFERENCE |
DIFFERENCE RELATIVE |
|
|
|
|
|
|
ASSETS |
|
|
|
|
|
|
|
|
|
|
A) DUE FROM SHAREHOLDERS FOR UNCALLED CAPITAL |
|
0,00 |
|
|
|
|
|
|
|
|
B) FIXED ASSETS |
66,07 |
40,43 |
25,64 |
63,41 |
|
|
|
|
|
|
C) DEFERRED EXPENSES |
0,25 |
0,18 |
0,07 |
38,89 |
|
|
|
|
|
|
D) CURRENT ASSETS |
33,69 |
59,39 |
-25,70 |
-43,27 |
|
|
|
|
|
|
ASSETS (A + B + C + D) |
100 |
100 |
|
|
|
|
|
|
|
|
|
|
|
|
|
|
|
|
|
|
|
|
COMPANY (2006) |
SECTOR |
DIFFERENCE |
DIFFERENCE RELATIVE |
|
|
|
|
|
|
LIABILITIES |
|
|
|
|
|
|
|
|
|
|
A) SHAREHOLDERS EQUITY |
20,40 |
36,21 |
-15,81 |
-43,66 |
|
|
|
|
|
|
B) DEFERRED INCOME |
2,74 |
0,72 |
2,02 |
277,93 |
|
|
|
|
|
|
C) PROVISIONS FOR LIABILITIES AND EXPENSES |
|
5,97 |
|
|
|
|
|
|
|
|
D) LONG TERM LIABILITIES |
47,77 |
8,68 |
39,09 |
450,47 |
|
|
|
|
|
|
E) SHORT TERM LIABILITIES |
29,09 |
48,33 |
-19,24 |
-39,81 |
|
|
|
|
|
|
F) SHORT TERM PROVISIONS FOR LIABILITIES AND EXPENSES |
|
0,09 |
|
|
|
|
|
|
|
|
LIABILITIES (A + B + C + D + E + F) |
100 |
100 |
|
|
|
|
|
|
|
Sectorial Financial Balance Comparison
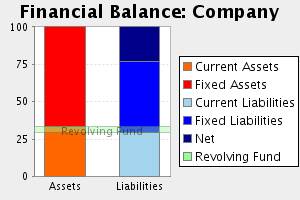
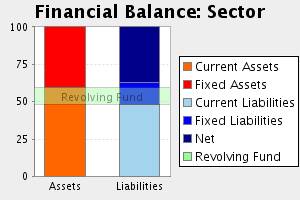
Comments to the Sectorial Analysis
In the 2006, the assets of the company were
formed in 66,31% of fixed assets and in 33,69Current Assets % In the sector,
the proportion of fixed assets was of 40,61%, 63,28% inferior, and the
proportion of current assets was of 59,39%, 43,27% superior.
The assets were financed in the company in
23,14% with own capitals , in 47,77% with fixed liabilities and in 29,09% with
current liabilities In the sector, the self financing represented 36,93%,
37,34% superior. On the other hand the long term debts represented in the
sector an average of 14,65% financing, with a relative difference of 226,05% in
favour of the companyAnd, short term liabilities represented in the sector an
average of 48,42% financing, with a relative difference of 39,92% favourable to
the sector
The result of this company’s financial structure
is a turnover fund that represents 4,59% of the total assets; in the sector,
this same proportion is 10,97%, therefore, we can say that the company’s
turnover fund is 58,17% smaller than the sector one.
Analytical Account of Results
Figures given in %
|
|
COMPANY (2006) |
SECTOR |
DIFFERENCE |
DIFFERENCE RELATIVE |
|
Turnover |
98,71 |
98,82 |
-0,11 |
-0,12 |
|
Other operating income |
1,29 |
1,18 |
0,11 |
9,69 |
|
Production Value |
100,00 |
100,00 |
0,00 |
0,00 |
|
Operating expenses |
61,98 |
56,38 |
5,60 |
9,93 |
|
Other operation expenses |
23,39 |
15,22 |
8,17 |
53,65 |
|
Added value |
14,63 |
28,40 |
-13,76 |
-48,48 |
|
Labour cost |
4,63 |
17,02 |
-12,39 |
-72,80 |
|
Gross Economic Result |
10,00 |
11,38 |
-1,38 |
-12,10 |
|
Assets depreciation |
6,34 |
4,57 |
1,77 |
38,85 |
|
Variation in provision for current assets and
bad debt losses |
0,06 |
0,13 |
-0,07 |
-52,76 |
|
Net Economic Result |
3,60 |
6,68 |
-3,08 |
-46,13 |
|
Financial income |
0,81 |
0,64 |
0,17 |
26,37 |
|
Financial Charges |
4,54 |
0,94 |
3,60 |
380,93 |
|
Variation in financial investment provision |
|
0,00 |
|
|
|
Ordinary Activities
Result |
-0,12 |
6,38 |
-6,50 |
-101,88 |
|
Extraordinary income |
2,32 |
1,12 |
1,20 |
107,70 |
|
Extraordinary charges |
1,36 |
1,06 |
0,30 |
28,67 |
|
Variation in provision in fixed assets |
|
0,09 |
|
|
|
Results before Taxes |
0,83 |
6,35 |
-5,52 |
-86,93 |
|
Corporate taxes |
0,29 |
1,96 |
-1,67 |
-85,17 |
|
Net Result |
0,54 |
4,39 |
-3,85 |
-87,71 |
|
Assets depreciation |
6,34 |
4,57 |
1,77 |
38,85 |
|
Change of Provisions |
0,06 |
0,22 |
-0,16 |
-72,60 |
|
Net Self-Financing |
6,95 |
9,18 |
-2,23 |
-24,27 |
Main
Ratios
|
|
COMPANY (2006) |
PTILE25 |
PTILE50 |
PTILE75 |
|
STRUCTURAL RATIOS |
|
|
|
|
|
Management fund |
2.685.997,40 |
1.848,26 |
8.185,40 |
16.715,79 |
|
Management Fund Requirement |
4.158.895,42 |
-9.780,31 |
-102,20 |
6.097,21 |
|
Indebtedness (%) |
76,86 |
42,88 |
54,40 |
70,07 |
|
External Funds on Net Worth |
3,32 |
0,75 |
1,19 |
2,34 |
|
GENERAL ACTIVITY RATIO |
|
|
|
|
|
Turnover Increase (%) |
1,64 |
-0,54 |
7,75 |
19,58 |
|
Added value growth (%) |
-21,64 |
-5,88 |
3,14 |
17,10 |
|
Cash Flow |
3.088.689,00 |
3.597,48 |
5.062,49 |
8.013,44 |
|
Labour Productivity |
3,16 |
1,46 |
1,78 |
2,12 |
|
Assets turnover |
0,75 |
0,98 |
1,29 |
1,57 |
|
Breakdown Point |
40.252.759,39 |
37.571.935,55 |
49.536.596,54 |
72.424.788,43 |
|
Security Margin of the Breakdown Point (%) |
9,47 |
6,50 |
12,65 |
21,44 |
|
ACTIVITY RATIOS |
|
|
|
|
|
Average Payment Period |
158 |
60 |
84 |
125 |
|
Average Collection Period |
116 |
80 |
106 |
123 |
|
Inventory Turnover Period |
32 |
30 |
44 |
55 |
|
SOLVENCY RATIOS |
|
|
|
|
|
Payback Capacity |
0,07 |
0,12 |
0,22 |
0,30 |
|
Assets Guarantee |
1,30 |
1,41 |
1,84 |
2,28 |
|
Short Term Debts Proportion (%) |
37,85 |
70,09 |
88,52 |
97,53 |
|
Interest Coverage |
1,00 |
3,79 |
7,06 |
20,36 |
|
LIQUIDITY RATIOS |
|
|
|
|
|
Current Ratio |
1,16 |
1,09 |
1,33 |
1,84 |
|
Immediate liquidity |
0,10 |
0,02 |
0,08 |
0,28 |
|
Treasury |
-1.472.898,02 |
-5.988,26 |
-884,65 |
1.980,90 |
|
Sales on Current Assets |
802 |
636 |
767 |
945 |
Results Analysis Ratios
|
|
COMPANY (2006) |
PTILE25 |
PTILE50 |
PTILE75 |
|
Economic profitability (%) |
2,74 |
2,97 |
5,91 |
10,70 |
|
Operating Profitability (%) |
3,65 |
2,32 |
4,80 |
7,99 |
|
Equity gearing |
-0,15 |
1,76 |
2,22 |
3,20 |
|
Financial profitability (%) |
1,79 |
4,42 |
9,84 |
18,38 |
|
General Profitability (%) |
0,55 |
1,55 |
3,38 |
5,99 |
FOREIGN EXCHANGE
RATES
|
Currency |
Unit
|
Indian Rupees |
|
US Dollar |
1 |
Rs.43.23 |
|
UK Pound |
1 |
Rs.80.89 |
|
Euro |
1 |
Rs.63.80 |
RATING
EXPLANATIONS
|
RATING |
STATUS |
PROPOSED CREDIT LINE |
|
|
>86 |
Aaa |
Possesses an extremely sound financial base with the strongest
capability for timely payment of interest and principal sums |
Unlimited |
|
71-85 |
Aa |
Possesses adequate working capital. No caution needed for credit transaction.
It has above average (strong) capability for payment of interest and
principal sums |
Large |
|
56-70 |
A |
Financial & operational base are regarded healthy. General unfavourable
factors will not cause fatal effect. Satisfactory capability for payment of
interest and principal sums |
Fairly Large |
|
41-55 |
Ba |
Overall operation is considered normal. Capable to meet normal
commitments. |
Satisfactory |
|
26-40 |
B |
Unfavourable & favourable factors carry similar weight in credit
consideration. Capability to overcome financial difficulties seems
comparatively below average. |
Small |
|
11-25 |
Ca |
Adverse factors are apparent. Repayment of interest and principal sums
in default or expected to be in default upon maturity |
Limited with
full security |
|
<10 |
C |
Absolute credit risk exists. Caution needed to be exercised |
Credit not
recommended |
|
NR |
In view of the lack of information, we have no basis upon which to
recommend credit dealings |
No Rating |
|
This score serves as a reference to assess SC’s credit risk
and to set the amount of credit to be extended. It is calculated from a composite
of weighted scores obtained from each of the major sections of this report. The
assessed factors and their relative weights (as indicated through %) are as
follows:
Financial
condition (40%) Ownership
background (20%) Payment
record (10%)
Credit history
(10%) Market trend
(10%) Operational
size (10%)