![]()
MIRA
INFORM REPORT
|
Report Date : |
14.08.2008 |
IDENTIFICATION
DETAILS
|
Name : |
MAYORAL MODA
INFANTIL SA |
|
|
|
|
Registered Office : |
|
|
|
|
|
Country : |
Spain |
|
|
|
|
Financials (as on) : |
31.12.2006 |
|
|
|
|
Date of Incorporation : |
14.12.1981 |
|
|
|
|
Legal Form : |
Joint Stock Company |
|
|
|
|
Line of Business : |
RATING &
COMMENTS
|
MIRA’s Rating : |
A |
|
RATING |
STATUS |
PROPOSED CREDIT LINE |
|
|
56-70 |
A |
Financial & operational base are regarded healthy. General
unfavourable factors will not cause fatal effect. Satisfactory capability for
payment of interest and principal sums |
Fairly Large |
|
Maximum Credit Limit : |
2.459.000,00 € |
|
|
|
|
Status : |
Good |
|
|
|
|
Payment Behaviour : |
Regular |
|
|
|
|
Litigation : |
Clear |
FINANCIAL
REPORT
MAYORAL MODA INFANTIL SA
TAX NUMBER: A29076049
EXECUTIVE
SUMMARY
Identification
Current Business Name: MAYORAL MODA INFANTIL SA
Commercial Name: MAYORAL
Other names: YES
Current Address: STREET LA
OROTAVA, 118, CP 29006, MALAGA MÁLAGA
Telephone number: 952045204 Fax: 952045200
URL: www.mayoral.es Corporate
e-mail: ventas@mayoral.es
Commercial
Risk
Credit Appraisal: 2.459.000,00 €
Legal Actions: NO
Financial
Information
Latest Balance sheet sales (2006): 109.235.883,06 €
(MERCANTILE REGISTER)
Result:
12.964.576,37 €
Total Assets: 113.080.917,92 €
Social Capital: 2.033.000,00 €
Employees: 213
Commercial
Information
Constitution Date: 14/12/1981
Business activity: Mass textile mfg. of kids clothes
NACE Code: 1820
International Operations: Exports
Corporate
Structure
Sole Administrator:
Parent Company:
Participations: 8
Other Complementary Information
Latest proceeding published in BORME: 10/01/2008 Change of statutes
Latest press article: 16/07/2007 SUR (INFORMATION ON LEGAL ANNOUNCE)
Bank Entities: Yes
Credit
Appraisal
Maximum Credit
Favourable to 2.459.000,00 €
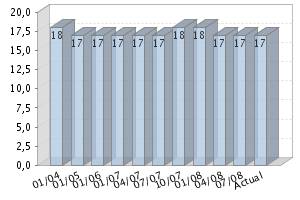
Rating
Evolution
Financial
Situation
Fiscal year2006
|
Treasury |
Excellent |
|
Indebtedness |
Very Weak |
|
Profitability |
Good |
|
Balance |
Excellent |
Performance
|
Legal Actions |
None or Negligible |
|
Business Trajectory |
Excellent |
INCIDENTS 
Summary
LEGAL ACTIONS: No legal incidences registered
CLAIM FILED AGAINST THE ADMINISTRATION: No administrative claims registered
AFFECTED BY:
1 Company / Companies in Insolvency
Proceedings.
FINANCIAL
ELEMENTS AND SECTORIAL COMPARATIVE
FINANCIAL ELEMENTS
Figures given in €
|
|
2004 (12) |
2005 (12) |
2006 (12) |
% ASSETS |
|
|
|
|
|
|
BALANCE SHEET ANALYSIS |
|
|
|
|
|
|
|
|
|
|
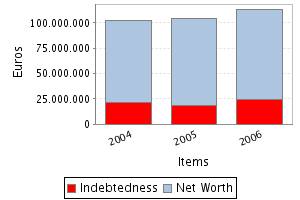
OWN FUNDS |
81.034.888,27 |
85.603.123,02 |
89.094.949,39 |
78,79 |
|
|
|
|
|
|
DEBT |
21.818.404,96 |
18.516.500,34 |
23.985.968,53 |
21,21 |
|
|
|
|
|
|
FIXED ASSETS |
24.970.363,59 |
24.692.722,16 |
27.156.851,52 |
24,02 |
|
|
|
|
|
|
TOTAL ASSETS |
102.853.293,23 |
104.119.623,36 |
113.080.917,92 |
|
|
|
|
|
|
|
|
|
|
|
|
|
|
|
|
|
|
|
2004 (12) |
2005 (12) |
2006 (12) |
% SALES |
|
|
|
|
|
|
PROFIT AND LOSS ACCOUNT ANALYSIS |
|
|
|
|
|
|
|
|
|
|
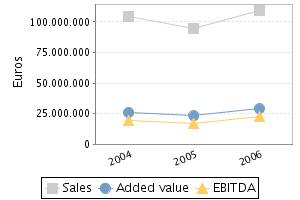
SALES |
104.184.426,59 |
94.840.726,72 |
109.235.883,06 |
|
|
|
|
|
|
|
ADDED VALUE |
25.796.154,76 |
23.025.961,68 |
28.754.139,29 |
26,32 |
|
|
|
|
|
|
EBITDA |
19.161.370,72 |
17.061.090,18 |
22.666.932,52 |
20,75 |
|
|
|
|
|
|
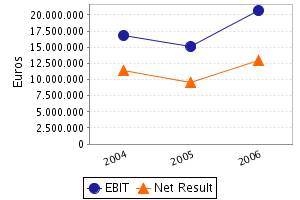
EBIT |
16.838.480,04 |
15.120.792,09 |
20.668.967,04 |
18,92 |
|
|
|
|
|
|
NET RESULT |
11.362.685,58 |
9.568.234,75 |
12.964.576,37 |
11,87 |
|
|
|
|
|
Balance Sheets Items Analysis
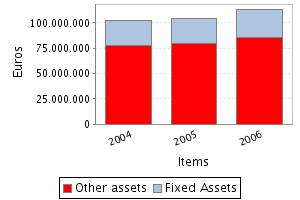
Balance Sheet Comments
Total assets of the company grew 1,23% between
2004 and 2005.
In spite of the assets’ growth, the fixed assets
decreased 1,11%.
This growth has been financed with a
Shareholders’ equity increase of 5,64% this company’s net increase has also
covered the reduction of the company’s indebtedness of 15,13% of company’s
indebtedness.
Total assets of the company grew 8,61% between
2005 and 2006.
This growth is a consequence of the fixed assets
increase of 9,98%.
This growth has been mainly financed with a debt
increase of 29,54%. Nevertheless the net worth increased 4,08%.
Profit and Loss Account Analysis
Profit and Loss Account Comments
The company’s sales figure decreased in 8,97%
between 2004 and 2005.
The company’s EBIT decreased in 10,20% between
2004 and 2005.
This evolution implies a reduction in the
company’s operating profitability.
The result of these variations is a decrease of
the company’s Economic Profitability of 11,29% in the analysed period, being
this profitability of 14,52% in the year 2005.
The company’s Net Result decreased in 15,79%
between 2004 and 2005.
This evolution, compared to the EBIT’s
performance, implies that the financial and extraordinary activities have had a
negative effect in the company’s Financial Profitability.
The result of these variations is a reduction of
the company’s profitability of 20,29% in the analysed period, being equal to
11,18% in the year 2005.
The company’s sales figure grew 15,18% between
2005 and 2006.
The company’s EBIT grew 36,69% between 2005 and
2006.
This evolution implies an increase in the
company’s operating profitability.
The result of these variations is an increase of
the company’s Economic Profitability of 25,86% in the analysed period, being
this profitability of 18,28% in the year 2006.
The company’s Net Result grew 35,50% between
2005 and 2006.
This evolution, compared to the EBIT’s
performance, implies that the financial and extraordinary activities have had a
negative effect in the company’s Financial Profitability.
The result of these variations is an increase of
the company’s Economic Profitability of 30,19% in the analysed period, being
equal to 14,55% in the year 2006.
ANNUAL FINANCIAL REPORT ADDITIONAL DATA
Source: annual financial
report 2005
Results Distribution
Figures given in €
|
DISTRIBUTION BASE |
DISTRIBUTION TO |
||
|
Profit and Loss |
9.568.234,75 |
Retained earnings |
0,00 |
|
Carry Over |
0,00 |
Voluntary Reserve |
95.484,75 |
|
Voluntary reserves |
0,00 |
Prior years losses |
0,00 |
|
Reserves |
0,00 |
Carry Over |
0,00 |
|
Other concepts |
0,00 |
Other funds |
0,00 |
|
Total of Amounts to be
distributed |
9.568.234,75 |
Dividends |
9.472.750,00 |
|
|
|
Other Applications |
0,00 |
Auditing
Auditors’ opinion: FAVOURABLE
Auditor: TEAM AUDITORES SL
COMPARATIVE SECTOR ANALYSIS
Values table
Figures expressed in %
|
|
COMPANY (2006) |
SECTOR |
DIFFERENCE |
DIFFERENCE RELATIVE |
|
|
|
|
|
|
BALANCE SHEET ANALYSIS: % on the total assets |
|
|
|
|
|
|
|
|
|
|
OWN FUNDS |
78,79 |
45,97 |
32,82 |
71,41 |
|
|
|
|
|
|
DEBT |
21,21 |
54,03 |
-32,82 |
-60,74 |
|
|
|
|
|
|
FIXED ASSETS |
24,02 |
26,33 |
-2,32 |
-8,80 |
|
|
|
|
|
|
|
|
|
|
|
|
|
|
|
|
|
|
COMPANY (2006) |
SECTOR |
DIFFERENCE |
DIFFERENCE RELATIVE |
|
|
|
|
|
|
PROFIT AND LOSS ACCOUNT
ANALYSIS: % on the total operating income |
|
|
|
|
|
|
|
|
|
|
SALES |
99,57 |
98,19 |
1,38 |
1,41 |
|
|
|
|
|
|
ADDED VALUE |
26,21 |
25,34 |
0,87 |
3,43 |
|
|
|
|
|
|
EBIT |
18,84 |
8,43 |
10,41 |
123,57 |
|
|
|
|
|
|
NET RESULT |
11,82 |
5,28 |
6,54 |
124,03 |
|
|
|
|
|
Sector Composition
Compared sector (NACE): 182
Number of companies: 19
Size (Sales Figure) : > 40.000.000,00 Euros
Comments on the sectorial comparative
Compared to its sector the assets of the
companies show an inferior proportion of fixed assets. Specifically the
difference with the sector average is -2,32% , which means a relative
difference of -8,80% .
In liabilities composition the company appeals
on a wider scale to self financing, being the proportion of net worth of 32,82%
superior, which means a relative difference of 71,41% . As a consequence,
external financing sources are less used by the company in 32,82% less than the
sector, which means a difference of 60,74% .
The proportion that the sales mean to the
company’s total ordinary income is 99,57%, 1,38% higher than in the sector,
which means a relative difference of 1,41% .
The company’s EBIT was positive and was 18,84%
with regard to the total ordinary income, 10,41% higher than in the sector,
which means a relative difference of 123,57% .
The company’s capacity to generate operating
income is higher than the one of the sector as its ratio EBIT/Sales is higher
(ES Company versus ES Sector).
The company’s net result was positive and equal
to 11,82% with regard to the total ordinary income, 6,54% less than the sector,
which means a relative difference of 124,03% .
The financial and extraordinary results and the
tax impact have had a less negative impact on the Net result in the company
than in the sector; as a consequence, the company shows a better Net
Result/EBIT ratio (REBEmpresa vs. REBSector).
ADDRESSES
Current Legal Seat Address:
STREET LA OROTAVA, 118
29006 MALAGA MÁLAGA
Previous Seat Address:
CAMINO PRADOS, S/N
29006 MALAGA MÁLAGA
Characteristics of the current address
Type of premises: office, factory, warehouse
Property: owned; with no official confirmation
Local Situation: secondary
CORPORATE
STRUCTURE
ADMINISTRATIVE LINKS
Main Board members, Directors and Auditor ![]()
|
POSITION |
SURNAMES AND NAME |
APPOINTMENT DATE |
|
|
SOLE ADMINISTRATOR |
INDUMENTA PUERI SL |
09/03/2005 |
|
|
AUDITOR |
APPOINTMENT DATE |
||
|
TEAM AUDITORES SL |
06/03/2007 |
||
Functional Managers
|
POSITION |
SURNAMES AND NAME |
|
General Manager |
DOMINGUEZ DE LA MASA MANUEL |
|
Financial Manager |
MERINO GONZALEZ ISIDRO |
|
Commercial Manager |
DOMINGUEZ RAFAEL |
|
Exports Manager |
DEL MONTE FERNANDO |
|
IT Manager |
ABOLAFIO GOMEZ FRANCISCO |
FINANCIAL
LINKS
|
|
BUSINESS NAME |
CIF / COUNTRY |
% |
SOURCE |
DATA INF. |
|
|
INDUMENTA PUERI SL. |
B92549781 |
100,00 |
OWN SOURCES |
13/05/2008 |
|
|
BUSINESS NAME |
CIF / COUNTRY |
% |
SOURCE |
DATA INF. |
|
|
MAYORAL ITALIA SRL |
ITALY |
100,00 |
TRADE REG. |
31/12/2005 |
|
|
MAYORAL HELLAS SRL |
GREECE |
100,00 |
TRADE REG. |
31/12/2005 |
|
|
MAYORAL INTERNATIONAL STORES S.A. |
A92027804 |
100,00 |
OWN SOURCES |
16/04/2008 |
|
|
MODA INFANTIL MAYORAL SA |
MEXICO |
99,99 |
TRADE REG. |
31/12/2005 |
|
|
MAYORAL FRANCE, S.A. |
FRANCIA |
99,95 |
TRADE REG. |
31/12/2005 |
|
|
MAYORAL PORTUGAL CONFECOES, SA |
PORTUGAL |
99,85 |
TRADE REG. |
31/12/2005 |
CREDIT
INFORMATION
Constitution Date: 14/12/1981
Business
activity 
Activity: Mass textile mfg. of kids clothes
NACE Code: 1820
NACE Activity: Manufacture of other wearing apparel and accessories
Business: FABRICACION, DISTRIBUCION Y VENTA DE MODA INFANTIL
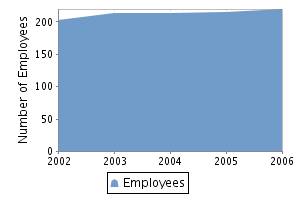
Employees 
Number of total employees: 213 (2008)
Number of fixed employees: 75,00%
Number of temporary employees: 25,00%
Employees evolution
COMMERCIAL
OPERATIONS 
PURCHASES
Payments (estimated):
National Distribution: 100%
SALES
Collection (estimated):
Cash sales percentage: 40%
On a credit basis: 60%
Export Percentage: 30%
Exports to: Portugal y Francia
National Distribution: 70%
Banks 
|
ENTITY |
BRANCH |
ADDRESS |
TOWN OR CITY |
PROVINCE |
|
BANCO BILBAO VIZCAYA ARGENTARIA, S.A. |
|
|
MALAGA |
|
|
BANCO ESPAÑOL DE CREDITO, S.A. |
|
|
MALAGA |
|
2 bank entities registered
Brands,
Signs and Commercial Names 
FORMER NAMES:
•
CONFECCIONES MAYORAL SA
Brand name: BERTA (Valid)
Type: JOINT
Date: 30/10/2003
Brand name: EL DESAFIO DE OCELOT (Valid)
Type: JOINT
Date: 17/03/2003
Brand name: TONO (Valid)
Type: JOINT
Date: 17/03/2003
Brand name: HELEN (Valid)
Type: JOINT
Date: 17/03/2003
Brand name: MAYORAL (Valid)
Type: JOINT
Date: 07/01/2003
LEGAL
STRUCTURE
Constitution Data
Register Date: 14/12/1981
Current
structure data 
Current Legal Form: JOINT STOCK COMPANY
Current Capital: 2.033.000,00 €
Legal
Aspects
Obligation to fill in Financial
Statements: YES
Chamber census: YES (2006)
Listed on a Stock Exchange: NO
B.O.R.M.E.(Official
Companies Registry Gazette) 
Registered Proceedings
|
PROCEEDINGS |
DATE |
NOTICE NUM. |
TRADE REG. |
|
Change of statutes |
10/01/2008 |
11550 |
Málaga |
|
Change of name |
10/01/2008 |
11550 |
Málaga |
|
Appointments |
06/03/2007 |
132272 |
Málaga |
|
Change of powers of atorney |
06/03/2007 |
132271 |
Málaga |
Other Proceedings published
|
PROCEEDINGS |
DATE |
NOTICE NUM. |
TRADE REG. |
|
Registration of
accounts (2006) Individual |
10/09/2007 |
413166 |
Málaga |
Press
articles 
16/07/2007 SUR (INFORMATION ON LEGAL
ANNOUNCE)
LA JUNTA UNIVERSAL DE CONFECCIONES MAYORAL SA
CELEBRADA EL 30/06/07, ACORDO MODIFICAR LA DENOMINACION SOCIAL POR LA DE
MAYORAL MODA INFANTIL SA.
15/10/2006 FOMENTO (FINANCIAL
INFORMATION)
LAS VENTAS GLOBALES DE CONFECCIONES MAYORAL EN
EL EJERCICIO 2005 BAJARON DE 104 A 95 MM. DE EUROS Y EL BENEFICIO NETO PASO DE
11,3 A 9,5 MM. LAS VENTAS CONSOLIDADAS LLEGARON A 105 MM. DE EUROS, CON UN
DESCENSO DEL 5%. LA FIRMA POSEE 39 TIENDAS PROPIAS Y 33 FRANQUICIAS, REPARTIDAS
ENTRE ESPAÑA (62 ESTABLECIMIENTOS) Y EL EXTERIOR (10). DE LAS ULTIMAS, SEIS SE
HALLAN EN LA ISLA DE TAIWAN Y LAS OTRAS CUATRO SE UBICAN EN CHIPRE, REPUBLICA
CHECA, ITALIA Y MALTA. POSEE CINCO FILIALES COMERCIALES EN EL EXTERIOR,
CONCRETAMENTE EN FRANCIA, PORTUGAL, ITALIA, GRECIA Y MEJICO Y PREVE EXTENDER SU
PRESENCIA HACIA TURQUIA Y RUSIA.
Complementary Information
Segun BORME (SECCION
SEGUNDA) de fecha 3/12/04, la empresa esta en
proceso de escision parcial, siendo beneficiaria INDUMENTA PUERI SL
NIF: B92549781.
FINANCIAL
INFORMATION
The information on the last account contained in
this report is extracted from the Mercantile Register file of the legal address
of the Company and dated 19/09/2007.
BALANCE SHEET
Assets
Figures given in €
|
|
31/12/2004 (12) |
31/12/2005 (12) |
31/12/2006 (12) |
|
A) DUE FROM SHAREHOLDERS
FOR UNCALLED CAPITAL |
|
|
|
|
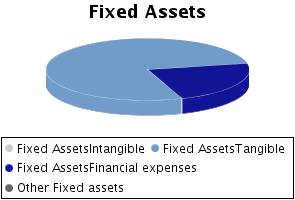
B) FIXED ASSETS |
24.970.363,59 |
24.692.722,16 |
27.156.851,52 |
|
I. Incorporation costs |
|
|
|
|
II. Intangible fixed
assets |
52.732,04 |
16.231,70 |
48.245,47 |
|
R & D expenses |
|
|
|
|
Concessions, patents, licences , trademarks |
6.010,12 |
6.010,12 |
6.010,12 |
|
Goodwill |
|
|
|
|
Acquired rights from finance leases |
|
|
|
|
Software |
416.789,08 |
416.789,08 |
458.898,08 |
|
Leasing |
|
|
|
|
Cash advance |
|
|
|
|
Provisions |
|
|
|
|
Depreciation |
-370.067,16 |
-406.567,50 |
-416.662,73 |
|
III. Tangible fixed
assets |
20.489.195,92 |
19.839.260,26 |
20.963.748,82 |
|
Property, plant and equipment |
13.576.656,98 |
13.576.656,98 |
13.576.656,98 |
|
Machinery, equipment and other |
478.610,33 |
549.098,33 |
2.885.119,79 |
|
Other property plant and equipment |
7.435.511,37 |
7.535.077,57 |
8.203.464,20 |
|
Prepaid expenses on fixed assets |
|
498.500,00 |
71.982,00 |
|
Other assets |
6.041.766,02 |
6.447.560,85 |
6.870.791,94 |
|
Provisions |
|
|
|
|
Depreciation |
-7.043.348,78 |
-8.767.633,47 |
-10.644.266,09 |
|
IV. Financial fixed
assets |
4.428.435,63 |
4.837.230,20 |
6.144.857,23 |
|
Shares in affiliated companies |
4.891.975,12 |
7.174.074,04 |
10.490.298,16 |
|
Receivables in affiliated companies |
|
|
|
|
Shares in associated companies |
|
|
|
|
Loans to associated companies |
|
|
|
|
Securities |
|
|
|
|
Other loans |
40.614,59 |
68.439,59 |
56.464,59 |
|
Long term deposits and guarantees |
6.017,36 |
6.017,36 |
6.017,36 |
|
Provisions |
-510.171,44 |
-2.411.300,79 |
-4.407.922,88 |
|
Taxes receivable |
|
|
|
|
V.Owners equity |
|
|
|
|
VI.Long term trade
liabilities |
|
|
|
|
C) DEFERRED EXPENSES |
|
|
|
|
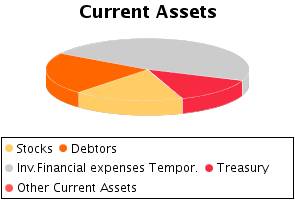
D) CURRENT ASSETS |
77.882.929,64 |
79.426.901,20 |
85.924.066,40 |
|
I. Shareholders by
required outlays |
|
|
|
|
II. Stocks |
14.673.181,23 |
10.975.687,34 |
15.002.588,13 |
|
Goods available for sale |
11.403.934,21 |
9.303.457,82 |
12.570.021,79 |
|
Raw material inventory |
1.507.719,17 |
687.381,38 |
769.067,65 |
|
Work in Progress |
114.747,15 |
22.399,49 |
|
|
Finished goods |
1.641.780,70 |
957.448,65 |
1.638.824,19 |
|
Subproducts and recycled materials |
|
|
|
|
Cash advance |
5.000,00 |
5.000,00 |
24.674,50 |
|
Provisions |
|
|
|
|
III. Debtors |
17.658.180,08 |
13.649.274,57 |
18.855.391,42 |
|
Clients |
6.244.925,74 |
4.789.370,43 |
6.666.187,88 |
|
Amounts owned by affiliated companies |
9.946.380,87 |
8.614.904,16 |
11.784.497,62 |
|
Amounts owned by associated companies |
|
|
|
|
Other debts |
524.754,28 |
273.106,80 |
126.461,69 |
|
Staff Expenses |
2.561,65 |
3.385,41 |
2.561,65 |
|
Government |
2.413.372,69 |
1.578.419,19 |
1.693.668,21 |
|
Provisions |
-1.473.815,15 |
-1.609.911,42 |
-1.417.985,63 |
|
IV. Temporary financial
investment |
38.223.922,26 |
49.291.136,99 |
40.457.083,25 |
|
Shares in affiliated companies |
|
|
|
|
Receivables in affiliated companies |
|
8.166.136,99 |
7.508.222,31 |
|
Shares in associated companies |
|
|
|
|
Loans to associated companies |
|
|
|
|
Short term investment |
38.222.381,06 |
41.125.000,00 |
32.948.860,94 |
|
Other loans |
|
|
|
|
Short Term Deposit and guarantees |
1.541,20 |
|
|
|
Provisions |
|
|
|
|
V. Short-term own shares |
|
|
|
|
VI. Treasury |
7.327.646,07 |
5.460.143,02 |
11.583.673,96 |
|
VII. Periodification
adjustments |
|
50.659,28 |
25.329,64 |
|
ASSETS (A + B + C + D) |
102.853.293,23 |
104.119.623,36 |
113.080.917,92 |
Assets composition

Liabilities
Figures given in €
|
|
31/12/2004 (12) |
31/12/2005 (12) |
31/12/2006 (12) |
|
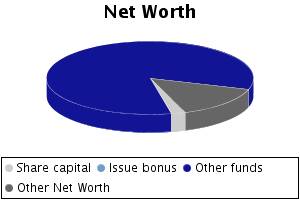
A) SHAREHOLDERS EQUITY |
81.034.888,27 |
85.603.123,02 |
89.094.949,39 |
|
I. Share capital |
2.033.000,00 |
2.033.000,00 |
2.033.000,00 |
|
II. Issue bonus |
|
|
|
|
III.Revaluation reserve |
|
|
|
|
IV.Reserves |
67.639.202,69 |
74.001.888,27 |
74.097.373,02 |
|
Retained earnings |
500.000,00 |
500.000,00 |
500.000,00 |
|
Sinking fund from owner equity |
|
|
|
|
Reserve for the parent company capital |
|
|
|
|
Statutory reserve |
|
|
|
|
Other funds |
67.139.202,69 |
73.501.888,27 |
73.597.373,02 |
|
Capital adjustments in Euros |
|
|
|
|
V.Results from previous
years |
|
|
|
|
Carry Over |
|
|
|
|
Prior years losses |
|
|
|
|
Loans from partners for losses compensation |
|
|
|
|
VI.Profit and Losses |
11.362.685,58 |
9.568.234,75 |
12.964.576,37 |
|
VII.Dividend paid during
the year |
|
|
|
|
VIII.Own shares for
capital reduction |
|
|
|
|
B) DEFERRED INCOME |
|
|
|
|
Capital grants |
|
|
|
|
Positive change difference |
|
|
|
|
Other deferred income |
|
|
|
|
Fiscal deferred income |
|
|
|
|
C) PROVISIONS FOR
LIABILITIES AND EXPENSES |
118.266,27 |
|
|
|
Provision for pensions plans |
|
|
|
|
Provision for taxes |
|
|
|
|
Other provisions |
118.266,27 |
|
|
|
Reversion fund |
|
|
|
|
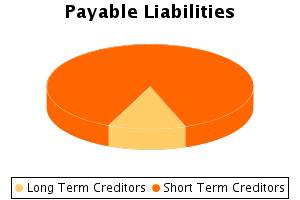
D) LONG TERM LIABILITIES |
4.355.299,79 |
3.672.154,09 |
2.898.756,53 |
|
I.Negotiable bonds and
other negotiable values |
|
|
|
|
Non convertible securities |
|
|
|
|
Convertible securities |
|
|
|
|
Other convertible debentures |
|
|
|
|
II.Debt with bank
entities |
|
|
|
|
Long term bank loans |
|
|
|
|
Leasing |
|
|
|
|
III.Debts with associated
and affiliated companies |
|
|
|
|
With affiliated companies |
|
|
|
|
Associated companies |
|
|
|
|
IV. Other creditors |
4.355.299,79 |
3.672.154,09 |
2.898.756,53 |
|
Bills payable |
|
|
|
|
Other debts |
4.355.299,79 |
3.663.754,09 |
2.890.356,53 |
|
Long term deposit and guaranties |
|
8.400,00 |
8.400,00 |
|
Taxes receivable |
|
|
|
|
V. Deferred debts on
shares |
|
|
|
|
From affiliated companies |
|
|
|
|
From associated companies |
|
|
|
|
Other companies |
|
|
|
|
VI. Long term debt with
creditor |
|
|
|
|
E) SHORT TERM LIABILITIES |
17.344.838,90 |
14.844.346,25 |
21.087.212,00 |
|
I.Negotiable bonds and
other negotiable values |
|
|
|
|
Non convertible securities |
|
|
|
|
Convertible securities |
|
|
|
|
Other convertible debentures |
|
|
|
|
Interests from bonds |
|
|
|
|
II.Debt with bank
entities |
46.486,00 |
|
|
|
Loans and other debts |
46.486,00 |
|
|
|
Debt interest |
|
|
|
|
Leasing |
|
|
|
|
III. Short term debts
with associated and affiliated companies |
2.907.047,32 |
2.990.768,41 |
4.032.882,34 |
|
With affiliated companies |
2.907.047,32 |
2.990.768,41 |
4.032.882,34 |
|
Associated companies |
|
|
|
|
IV. Commercial creditors |
10.411.334,04 |
8.727.377,26 |
12.888.659,65 |
|
Accounts payable |
83.683,80 |
98.443,85 |
104.254,05 |
|
Expenses |
10.327.650,24 |
8.628.933,41 |
12.784.405,60 |
|
Bills payable |
|
|
|
|
V. Other non-commercial
debt |
3.979.971,54 |
3.126.200,58 |
4.165.670,01 |
|
Government |
2.666.224,49 |
1.824.461,33 |
2.810.378,08 |
|
Bills payable |
|
|
|
|
Other debts |
789.279,34 |
799.262,81 |
839.574,30 |
|
Accounts receivable |
524.467,71 |
502.476,44 |
515.717,63 |
|
Short term deposits and guarantees |
|
|
|
|
VI. Provisions for
current assets |
|
|
|
|
VII. Periodification
adjustments |
|
|
|
|
F) SHORT TERM PROVISIONS
FOR LIABILITIES AND EXPENSES |
|
|
|
|
LIABILITIES (A + B + C +
D + E + F) |
102.853.293,23 |
104.119.623,36 |
113.080.917,92 |
Liabilities Composition
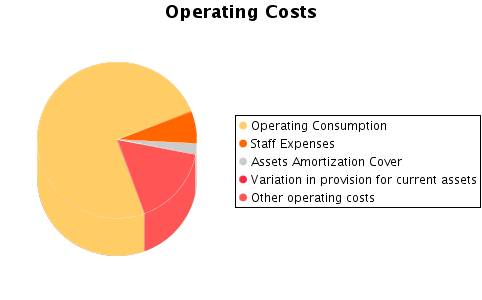
PROFIT AND LOSS ACCOUNT
Itams of the Profit and Loss Account
Figures given in €
|
|
31/12/2004 (12) |
31/12/2005 (12) |
31/12/2006 (12) |
|
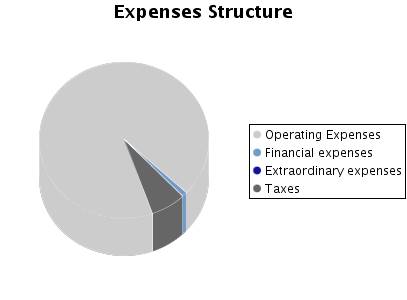
A) EXPENSES (A.1 a A.16) |
94.458.590,73 |
87.466.477,06 |
98.991.974,24 |
|
A.1.Reduction in stocks
of finished goods and work in progress |
2.576.647,99 |
776.679,71 |
|
|
A.2.Supplies |
64.009.015,70 |
59.609.846,63 |
66.990.575,30 |
|
Material consumed |
27.946.354,82 |
34.913.534,00 |
42.527.097,15 |
|
Raw materials consumed |
19.691.363,27 |
14.326.955,10 |
15.810.711,44 |
|
Other expenses |
16.371.297,61 |
10.369.357,53 |
8.652.766,71 |
|
A.3. Labour cost |
6.634.784,04 |
5.964.871,50 |
6.087.206,77 |
|
Wages |
5.139.780,76 |
4.610.481,53 |
4.801.778,36 |
|
Social security expenses |
1.495.003,28 |
1.354.389,97 |
1.285.428,41 |
|
A.4. Assets depreciation |
1.497.483,68 |
1.760.785,03 |
1.886.727,85 |
|
A.5.Variance in the
traffic provisions |
825.407,00 |
179.513,06 |
111.237,63 |
|
Variance in provision for inventory |
|
|
|
|
Variance in provision for bad debts |
825.407,00 |
179.513,06 |
111.237,63 |
|
Variance in provision for other current assets |
|
|
|
|
A.6. Other operating
costs |
12.009.921,43 |
11.857.013,17 |
14.621.315,02 |
|
External costs |
11.943.704,05 |
11.775.714,95 |
14.551.373,98 |
|
Taxes |
66.217,38 |
81.298,22 |
69.941,04 |
|
Other day to day expenses |
|
|
|
|
Allowance to reversion fund |
|
|
|
|
A.I.OPERATING RESULT
(B.1+B.2+B.3+B.4-A.1-A.2-A.3-A.4-A.5-A.6) |
16.838.480,04 |
15.120.792,09 |
20.668.967,04 |
|
A.7.Financial expenses
and similar |
304.833,10 |
334.381,49 |
336.317,09 |
|
Debts with related companies |
|
|
|
|
Debts with associated companies |
|
|
|
|
Other companies debts By debts with third
parties and similar expenses |
304.833,10 |
334.381,49 |
336.317,09 |
|
Losses from financial investments |
|
|
|
|
A.8. Variation in
financial investment provision |
|
|
|
|
A.9.Negative exchange
difference |
56.143,58 |
79.562,74 |
531.837,60 |
|
A.II.POSITIVE FINANCIAL
RESULTS (B.5+B.6+B.7+B.8-A.7-A.8-A.9) |
1.017.853,73 |
1.319.779,49 |
702.277,29 |
|
A.III.PROFIT FROM ORDINARY
ACTIVITIES (A.I+A.II-B.I-B.II) |
17.856.333,77 |
16.440.571,58 |
21.371.244,33 |
|
A.10. Variation in
provision in fixed assets |
60.709,40 |
1.901.129,35 |
1.996.622,09 |
|
A.11. Losses in fixed
assets |
270.949,71 |
|
|
|
A.12. Losses from own
shares and bonds |
|
|
|
|
A.13. Extraordinary
charges |
114.957,95 |
97.077,85 |
52.900,00 |
|
A.14.Other exercises’
expenses and losses |
57.542,88 |
12.464,84 |
25.756,09 |
|
A.IV.POSITIVE
EXTRAORDINARY RESULT (B.9+B.10+B.11+B.12+B.13-A.10-A.11-A.12-A.13-A.14) |
|
|
|
|
A.V.PROFIT BEFORE TAXES
(A.III+A.IV-B.III-B.IV) |
17.402.879,85 |
14.461.386,44 |
19.316.055,17 |
|
A.15.Corporate Taxes |
6.040.194,27 |
4.893.151,69 |
6.351.478,80 |
|
A.16. Other taxes |
|
|
|
|
A.VI.EXERCISE RESULT
(PROFIT) (A.V-A.14-A.15) |
11.362.685,58 |
9.568.234,75 |
12.964.576,37 |
|
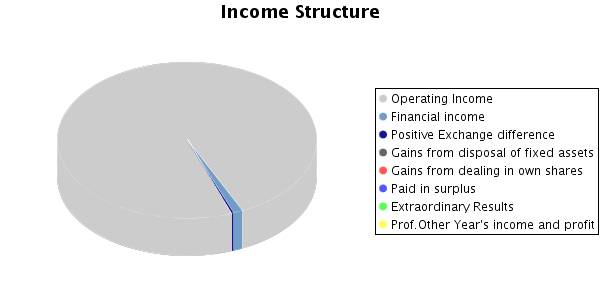
B) INCOMES (B.1 a B13) |
105.821.276,31 |
97.034.711,81 |
111.956.550,61 |
|
B.1. Turnover |
104.184.426,59 |
94.840.726,72 |
109.235.883,06 |
|
Sales |
105.881.254,54 |
96.576.292,28 |
111.197.095,81 |
|
Services provided |
29.207,95 |
36.186,03 |
18.510,75 |
|
Refunds and sale reminders |
-1.726.035,90 |
-1.771.751,59 |
-1.979.723,50 |
|
B.2.Increase in inventory
of finished goods and works in progress |
|
|
658.976,05 |
|
B.3.Expenses capitalized |
|
|
|
|
B.4. Other operating
income |
207.313,29 |
428.774,47 |
471.170,50 |
|
Other incomes |
176.509,20 |
334.253,54 |
343.848,48 |
|
Grants |
30.804,09 |
88.154,40 |
127.322,02 |
|
Excess in provision for liabilities and
charges |
|
6.366,53 |
|
|
B.I.OPERATING LOSSES (A.1+A.2+A.3+A.4+A.5+A.6-B.1-B.2-B.3-B.4) |
|
|
|
|
B.5.Incomes from share
participations |
|
|
|
|
From affiliated companies |
|
|
|
|
From associated companies |
|
|
|
|
From other companies |
|
|
|
|
B.6.Income from other
securities and credits to fixed assets |
563.828,43 |
686.351,82 |
758.628,87 |
|
From affiliated companies |
|
|
|
|
From associated companies |
|
|
|
|
Other companies |
563.828,43 |
686.351,82 |
758.628,87 |
|
B.7.Other interests and
similar |
152.733,39 |
317.048,99 |
525.991,83 |
|
From affiliated companies |
|
166.136,99 |
342.085,32 |
|
From associated companies |
|
|
|
|
Other Interests |
152.733,39 |
150.912,00 |
183.906,51 |
|
Profits from investments |
|
|
|
|
B.8. Positive change
difference |
662.268,59 |
730.322,91 |
285.811,28 |
|
B.II. NEGATIVE FINANCIAL
RESULTS (A.7+A.8+A.9-B.5-B.6-B.7-B.8) |
|
|
|
|
B.III.LOSSES FROM
ORDINARY ACTIVITIES (B.I+B.II-A.I-A.II) |
|
|
|
|
B.9.B.9. Gains from
disposal of fixed assets |
948,11 |
|
|
|
B.10.Gains from dealing
in own shares |
|
|
|
|
B.11. Paid in surplus |
|
|
|
|
B.12. Extraordinary
income |
19.443,53 |
9.786,70 |
|
|
B.13.Other year’s income
and profits |
30.314,38 |
21.700,20 |
20.089,02 |
|
B.IV.NEGATIVE
EXTRAORDINARY LOSSES (A.10+A.11+A.12+A.13+A.14-B.9-B.10-B.11-B.12-B.13) |
453.453,92 |
1.979.185,14 |
2.055.189,16 |
|
B.V.LOSS BEFORE TAXES
(B.III+B.IV-A.III-A.IV) |
|
|
|
|
B.VI.EXERCISE RESULTS
(LOSS) (B.V+A.14+A.15) |
|
|
|
Composition of the Profit and Loss Account
FINANCIAL
BALANCE
Here the Main Capital Amounts of the company and
the Revolving Fund Evolution are analysed.
Financial Balance Table
Figures given in €
|
|
31/12/2004 (12) |
% |
31/12/2005 (12) |
% |
31/12/2006 (12) |
% |
|
A) DUE FROM SHAREHOLDERS FOR UNCALLED CAPITAL |
|
|
|
|
|
|
|
B) FIXED ASSETS |
24.970.363,59 |
24,28 |
24.692.722,16 |
23,72 |
27.156.851,52 |
24,02 |
|
C) DEFERRED EXPENSES |
|
|
|
|
|
|
|
D) CURRENT ASSETS |
77.882.929,64 |
75,72 |
79.426.901,20 |
76,28 |
85.924.066,40 |
75,98 |
|
ASSETS (A + B + C + D) |
102.853.293,23 |
|
104.119.623,36 |
|
113.080.917,92 |
|
|
|
||||||
|
A) SHAREHOLDERS EQUITY |
81.034.888,27 |
78,79 |
85.603.123,02 |
82,22 |
89.094.949,39 |
78,79 |
|
B) DEFERRED INCOME |
|
|
|
|
|
|
|
C) PROVISIONS FOR LIABILITIES AND EXPENSES |
118.266,27 |
0,11 |
|
|
|
|
|
D) LONG TERM LIABILITIES |
4.355.299,79 |
4,23 |
3.672.154,09 |
3,53 |
2.898.756,53 |
2,56 |
|
E) SHORT TERM LIABILITIES |
17.344.838,90 |
16,86 |
14.844.346,25 |
14,26 |
21.087.212,00 |
18,65 |
|
F) SHORT TERM PROVISIONS FOR LIABILITIES AND EXPENSES |
|
|
|
|
|
|
|
LIABILITIES (A + B + C + D + E + F) |
102.853.293,23 |
|
104.119.623,36 |
|
113.080.917,92 |
|
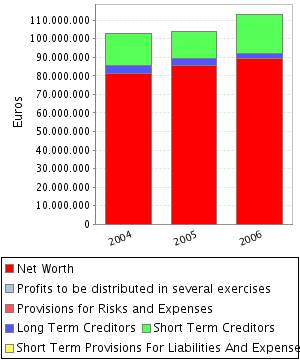
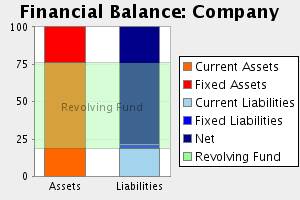
Financial Balance Composition
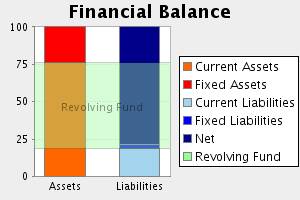
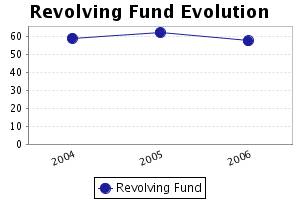
Comments on Financial Balance
In the 2004, the assets of the company were
formed in 24,28% of Fixed Assets and in 75,72% of Current Assets.This assets
were financed in 78,79% with own capitals, and in 4,35% with long term debt and
in 16,86% with current liabilities.
The result of this financial structure is a
positive turnover fund of 60.538.090,74 Euros, which is equivalent to
58,86% proportion of the company’s total assets.
In the 2005, the assets of the company were
formed in 23,72% of Fixed Assets and in 76,28% of Current Assets.This assets
were financed in 82,22% with own capitals, and in 3,53% with long term debt and
in 14,26% with current liabilities.
The result of this financial structure is a
positive turnover fund of 64.582.554,95 Euros, which is equivalent to
62,03% proportion of the company’s total assets.
This measure has increased with respect to the previous
exercise in 6,68% having also increased its proportion with respect to the
total assets of the company.
In the 2006, the assets of the company were
formed in 24,02% of Fixed Assets and in 75,98% of Current Assets.This assets
were financed in 78,79% with own capitals, and in 2,56% with long term debt and
in 18,65% with current liabilities.
The result of this financial structure is a
positive turnover fund of 64.836.854,40 Euros, which is equivalent to
57,34% proportion of the company’s total assets.
This measure has increased with respect to the
previous exercise in 0,39% having, however, diminished its proportion with
respect to the total assets of the company.
RATIOS
Main Ratios
|
|
31/12/2004 (12) |
31/12/2005 (12) |
31/12/2006 (12) |
|
STRUCTURAL RATIOS |
|
|
|
|
Management fund |
60.538.090,74 |
64.582.554,95 |
64.836.854,40 |
|
Management Fund Requirement |
15.033.008,41 |
9.831.274,94 |
12.796.097,19 |
|
Indebtedness (%) |
21,21 |
17,78 |
21,21 |
|
External Funds on Net Worth |
0,27 |
0,22 |
0,27 |
|
GENERAL ACTIVITY RATIO |
|
|
|
|
Turnover Increase (%) |
-0,40 |
-8,97 |
15,18 |
|
Added value growth (%) |
-8,17 |
-10,74 |
24,88 |
|
Cash Flow |
13.746.285,66 |
13.409.662,19 |
16.959.163,94 |
|
Labour Productivity |
3,89 |
3,86 |
4,72 |
|
Assets turnover |
1,01 |
0,91 |
0,97 |
|
Breakdown Point |
57.896.615,14 |
53.972.842,11 |
57.430.218,42 |
|
Security Margin of the Breakdown Point (%) |
44,54 |
43,35 |
47,65 |
|
ACTIVITY RATIOS |
|
|
|
|
Average Payment Period |
56 |
52 |
70 |
|
Average Collection Period |
61 |
52 |
62 |
|
Inventory Turnover Period |
51 |
42 |
49 |
|
SOLVENCY RATIOS |
|
|
|
|
Payback Capacity |
0,63 |
0,72 |
0,71 |
|
Assets Guarantee |
4,71 |
5,62 |
4,71 |
|
Short Term Debts Proportion (%) |
79,50 |
80,17 |
87,92 |
|
Interest Coverage |
40,21 |
29,14 |
37,80 |
|
LIQUIDITY RATIOS |
|
|
|
|
Current Ratio |
4,49 |
5,35 |
4,08 |
|
Immediate liquidity |
2,63 |
3,69 |
2,47 |
|
Treasury |
45.505.082,33 |
54.751.280,01 |
52.040.757,21 |
|
Sales on Current Assets |
482 |
430 |
458 |
Results Analysis Ratios
|
|
31/12/2004 (12) |
31/12/2005 (12) |
31/12/2006 (12) |
|
Economic profitability (%) |
16,37 |
14,52 |
18,28 |
|
Operating Profitability (%) |
16,16 |
15,94 |
18,92 |
|
Equity gearing |
1,35 |
1,32 |
1,31 |
|
Financial profitability (%) |
14,02 |
11,18 |
14,55 |
|
General Profitability (%) |
10,91 |
10,09 |
11,87 |
Comments on the Results Analysis Ratios
The economic profitability in the year2005
achieved a 14,52% positive level, due to a 15,94% economic margin and to an
assets turnover of0,91%.
The economic profitability in the year has
reduced from 16,37% up to 14,52% of2005, even if it remains positive. This fall
is due to the decrease in operating profitability, that has passe from 16,16%
to 15,94%, as assets turnover whose index has passed from 1,01 to 0,91%.
Financial profitability on 2005 achieved a
11,18%.
The company’s financial structure has instigated
its economic profitability with an indebtedness level of 1,32.
The general profitability on 2005 achieved a
10,09%.
The economic profitability in the year2006
achieved a 18,28% positive level, due to a 18,92% economic margin and to an
assets turnover of0,97%.
The economic profitability in the year has
increased from 14,52% up to 18,28%. This growth is due to the economic margin
increase, from 15,94% to the current 18,92Y%, and to the assets turnover index,
which in the last period has achieved 0,97, compared to 0,91 del 2005.
Financial profitability on 2006 achieved a
14,55%.
The company’s financial structure has instigated
its economic profitability with an indebtedness level of 1,31.
The general profitability on 2006 achieved a
11,87%.
SECTORIAL ANÁLYSIS
Large Capital Amounts and Financial Balance
Figures given in %
|
|
COMPANY (2006) |
SECTOR |
DIFFERENCE |
DIFFERENCE RELATIVE |
|
|
|
|
|
|
ASSETS |
|
|
|
|
|
|
|
|
|
|
A) DUE FROM SHAREHOLDERS FOR UNCALLED CAPITAL |
|
0,00 |
|
|
|
|
|
|
|
|
B) FIXED ASSETS |
24,02 |
26,33 |
-2,31 |
-8,79 |
|
|
|
|
|
|
C) DEFERRED EXPENSES |
|
0,02 |
|
|
|
|
|
|
|
|
D) CURRENT ASSETS |
75,98 |
73,65 |
2,33 |
3,17 |
|
|
|
|
|
|
ASSETS (A + B + C + D) |
100 |
100 |
|
|
|
|
|
|
|
|
|
|
|
|
|
|
|
|
|
|
|
|
COMPANY (2006) |
SECTOR |
DIFFERENCE |
DIFFERENCE RELATIVE |
|
|
|
|
|
|
LIABILITIES |
|
|
|
|
|
|
|
|
|
|
A) SHAREHOLDERS EQUITY |
78,79 |
45,73 |
33,06 |
72,30 |
|
|
|
|
|
|
B) DEFERRED INCOME |
|
0,24 |
|
|
|
|
|
|
|
|
C) PROVISIONS FOR LIABILITIES AND EXPENSES |
|
0,69 |
|
|
|
|
|
|
|
|
D) LONG TERM LIABILITIES |
2,56 |
4,78 |
-2,22 |
-46,39 |
|
|
|
|
|
|
E) SHORT TERM LIABILITIES |
18,65 |
48,45 |
-29,80 |
-61,51 |
|
|
|
|
|
|
F) SHORT TERM PROVISIONS FOR LIABILITIES AND EXPENSES |
|
0,12 |
|
|
|
|
|
|
|
|
LIABILITIES (A + B + C + D + E + F) |
100 |
100 |
|
|
|
|
|
|
|
Sectorial Financial Balance Comparison
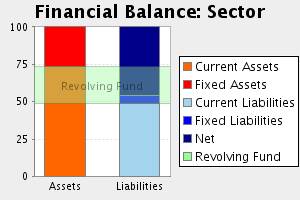
Comments to the Sectorial Analysis
In the 2006, the assets of the company were
formed in 24,02% of fixed assets and in 75,98Current Assets % In the sector,
the proportion of fixed assets was of 26,35%, 8,85% superior, and the
proportion of current assets was of 73,65%, 3,17% inferior.
The assets were financed in the company in
78,79% with own capitals , in 2,56% with fixed liabilities and in 18,65% with
current liabilities In the sector, the self financing represented 45,97%,
71,41% inferior. On the other hand the long term debts represented in the
sector an average of 5,46% financing, with a relative difference of 53,14%
favourable to the sectorAnd, short term liabilities represented in the sector
an average of 48,57% financing, with a relative difference of 61,60% favourable
to the sector
The result of this company’s financial structure
is a turnover fund that represents 57,34% of the total assets; in the sector,
this same proportion is 25,08%, therefore, we can say that the company’s
turnover fund is 128,66% higher than the one in of the sector.
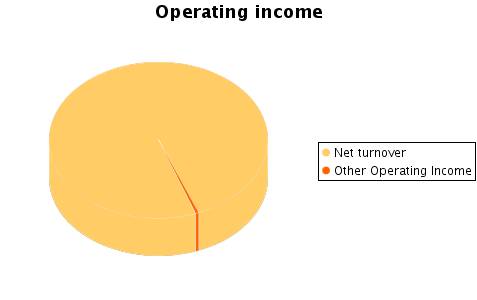
Analytical Account of Results
Figures given in %
|
|
COMPANY (2006) |
SECTOR |
DIFFERENCE |
DIFFERENCE RELATIVE |
|
Turnover |
99,57 |
98,19 |
1,38 |
1,41 |
|
Other operating income |
0,43 |
1,81 |
-1,38 |
-76,30 |
|
Production Value |
100,00 |
100,00 |
0,00 |
0,00 |
|
Operating expenses |
60,46 |
62,81 |
-2,35 |
-3,74 |
|
Other operation expenses |
13,33 |
11,85 |
1,48 |
12,45 |
|
Added value |
26,21 |
25,34 |
0,87 |
3,43 |
|
Labour cost |
5,55 |
15,28 |
-9,73 |
-63,67 |
|
Gross Economic Result |
20,66 |
10,06 |
10,60 |
105,31 |
|
Assets depreciation |
1,72 |
1,76 |
-0,04 |
-2,49 |
|
Variation in provision for current assets and
bad debt losses |
0,10 |
-0,13 |
0,23 |
-178,12 |
|
Net Economic Result |
18,84 |
8,43 |
10,41 |
123,57 |
|
Financial income |
1,43 |
0,42 |
1,01 |
241,29 |
|
Financial Charges |
0,79 |
0,83 |
-0,04 |
-4,36 |
|
Variation in financial investment provision |
|
0,08 |
|
|
|
Ordinary Activities Result |
19,48 |
7,94 |
11,54 |
145,37 |
|
Extraordinary income |
0,02 |
0,64 |
-0,62 |
-96,89 |
|
Extraordinary charges |
0,07 |
0,35 |
-0,28 |
-80,11 |
|
Variation in provision in fixed assets |
1,82 |
0,39 |
1,43 |
366,67 |
|
Results before Taxes |
17,61 |
7,84 |
9,77 |
124,59 |
|
Corporate taxes |
5,79 |
2,57 |
3,22 |
125,64 |
|
Net Result |
11,82 |
5,28 |
6,54 |
124,08 |
|
Assets depreciation |
1,72 |
1,76 |
-0,04 |
-2,49 |
|
Change of Provisions |
1,92 |
0,34 |
1,58 |
459,77 |
|
Net Self-Financing |
15,46 |
7,38 |
8,08 |
109,43 |
Main Ratios
|
|
COMPANY (2006) |
PTILE25 |
PTILE50 |
PTILE75 |
|
STRUCTURAL RATIOS |
|
|
|
|
|
Management fund |
64.836.854,40 |
4.087,06 |
9.337,85 |
26.511,00 |
|
Management Fund Requirement |
12.796.097,19 |
-973,51 |
5.071,65 |
9.831,28 |
|
Indebtedness (%) |
21,21 |
48,18 |
55,26 |
76,13 |
|
External Funds on Net Worth |
0,27 |
0,93 |
1,24 |
3,19 |
|
GENERAL ACTIVITY RATIO |
|
|
|
|
|
Turnover Increase (%) |
15,18 |
-5,89 |
2,68 |
17,53 |
|
Added value growth (%) |
24,88 |
-11,25 |
1,10 |
18,84 |
|
Cash Flow |
16.959.163,94 |
1.819,74 |
3.124,72 |
13.409,66 |
|
Labour Productivity |
4,72 |
1,38 |
1,92 |
2,99 |
|
Assets turnover |
0,97 |
1,07 |
1,95 |
3,01 |
|
Breakdown Point |
57.430.218,42 |
32.919.904,32 |
53.972.842,11 |
95.015.481,18 |
|
Security Margin of the Breakdown Point (%) |
47,65 |
9,58 |
27,75 |
55,15 |
|
ACTIVITY RATIOS |
|
|
|
|
|
Average Payment Period |
70 |
17 |
44 |
82 |
|
Average Collection Period |
62 |
61 |
88 |
105 |
|
Inventory Turnover Period |
49 |
13 |
37 |
49 |
|
SOLVENCY RATIOS |
|
|
|
|
|
Payback Capacity |
0,71 |
0,06 |
0,24 |
0,33 |
|
Assets Guarantee |
4,71 |
1,31 |
1,81 |
2,08 |
|
Short Term Debts Proportion (%) |
87,92 |
82,84 |
95,64 |
99,50 |
|
Interest Coverage |
37,80 |
1,03 |
19,64 |
16.511,32 |
|
LIQUIDITY RATIOS |
|
|
|
|
|
Current Ratio |
4,08 |
1,19 |
1,74 |
2,04 |
|
Immediate liquidity |
2,47 |
0,04 |
0,17 |
0,34 |
|
Treasury |
52.040.757,21 |
-3.088,04 |
2.346,32 |
16.468,00 |
|
Sales on Current Assets |
458 |
558 |
947 |
1.141 |
Results Analysis Ratios
|
|
COMPANY (2006) |
PTILE25 |
PTILE50 |
PTILE75 |
|
Economic profitability (%) |
18,28 |
4,11 |
15,94 |
20,53 |
|
Operating Profitability (%) |
18,92 |
2,42 |
6,51 |
15,49 |
|
Equity gearing |
1,31 |
1,63 |
2,03 |
2,32 |
|
Financial profitability (%) |
14,55 |
3,20 |
17,02 |
25,92 |
|
General Profitability (%) |
11,87 |
0,34 |
3,60 |
10,02 |
FOREIGN EXCHANGE
RATES
|
Currency |
Unit
|
Indian Rupees |
|
US Dollar |
1 |
Rs. |
|
UK Pound |
1 |
Rs. |
|
Euro |
1 |
Rs. |
RATING
EXPLANATIONS
|
RATING |
STATUS |
PROPOSED CREDIT LINE |
|
|
>86 |
Aaa |
Possesses an extremely sound financial base with the strongest
capability for timely payment of interest and principal sums |
Unlimited |
|
71-85 |
Aa |
Possesses adequate working capital. No caution needed for credit transaction.
It has above average (strong) capability for payment of interest and
principal sums |
Large |
|
56-70 |
A |
Financial & operational base are regarded healthy. General unfavourable
factors will not cause fatal effect. Satisfactory capability for payment of
interest and principal sums |
Fairly Large |
|
41-55 |
Ba |
Overall operation is considered normal. Capable to meet normal
commitments. |
Satisfactory |
|
26-40 |
B |
Unfavourable & favourable factors carry similar weight in credit
consideration. Capability to overcome financial difficulties seems
comparatively below average. |
Small |
|
11-25 |
Ca |
Adverse factors are apparent. Repayment of interest and principal sums
in default or expected to be in default upon maturity |
Limited with
full security |
|
<10 |
C |
Absolute credit risk exists. Caution needed to be exercised |
Credit not
recommended |
|
NR |
In view of the lack of information, we have no basis upon which to
recommend credit dealings |
No Rating |
|
This score serves as a reference to assess SC’s credit risk
and to set the amount of credit to be extended. It is calculated from a composite
of weighted scores obtained from each of the major sections of this report. The
assessed factors and their relative weights (as indicated through %) are as
follows:
Financial
condition (40%) Ownership
background (20%) Payment
record (10%)
Credit history
(10%) Market trend
(10%) Operational
size (10%)