![]()
MIRA
INFORM REPORT
|
Report Date : |
19.08.2008 |
IDENTIFICATION
DETAILS
|
Name : |
MITSUI ENGINEERING & SHIPBUILDING CO LTD |
|
|
|
|
Registered Office : |
5-6-4 Tsukiji Chuoku Tokyo 104-8439 |
|
|
|
|
Country : |
Japan |
|
|
|
|
Financials (as on) : |
31.03.2008 |
|
|
|
|
Date of Incorporation : |
July 1937 |
|
|
|
|
Legal Form : |
Limited Company (Kabushiki Kaisha) |
|
|
|
|
Line of Business : |
Manufacturer of Shipbuilding and Heavy Machinery |
RATING &
COMMENTS
|
MIRA’s Rating : |
Aa |
|
RATING |
STATUS |
PROPOSED CREDIT LINE |
|
|
71-85 |
Aa |
Possesses adequate working capital. No caution needed for credit
transaction. It has above average (strong) capability for payment of interest
and principal sums |
Large |
|
Maximum Credit Limit : |
YEN 11,966.8 Million |
|
|
|
|
Status : |
Very Good |
|
|
|
|
Payment Behaviour : |
Regular |
name & address
MITSUI ENGINEERING
& SHIPBUILDING CO LTD
REGD NAME: Mitsui Zosen KK
MAIN OFFICE: 5-6-4 Tsukiji Chuoku Tokyo 104-8439 JAPAN
Tel:
033544-3147 Fax: 03-3544-3050
E-Mail address: prdept@mes.co.jp
ACTIVITIES
Shipbuilding & heavy machinery mfg
BRANCHES
Osaka, Nagoya, other
FACTORY(IES)
Tamano (as given), Ichihara (Chiba), Oita
CHIEF EXEC
YASUHIKO KATOH, PRES
Yen Amount: In
million Yen, unless otherwise stated
SUMMARY
FINANCES FAIR A/SALES Yen 659,215 M
PAYMENTS REGULAR CAPITAL Yen 44,384 M
TREND STEADY WORTH Yen 175,642 M
STARTED 1937 EMPLOYES 9,910
COMMENT
SHIPBUILDING
& MFG OF HEAVY ELECTRIC MACHINERY.
FINANCIAL
SITUATION CONSIDERED FAIR AND GOOD FOR ORDINARY
BUSINESS
ENGAGEMENTS.
MAX CREDIT LIMIT: YEN 11,966.8 MILLION, 30 DAYS NORMAL TERMS.
Forecast
(or estimated) figures for 31/03/2009 fiscal term
HIGHLIGHTS
The
subject company is one of major mfrs in shipbuilding and heavy electric
machinery. Ranked top in marine diesel
engine production in Japan. One of core
members of Mitsui Group firms.
Shipbuilding is the core which alone account for about 45% of total
sales. Group shipping firm, Mitsui-OSK
Lines, is aggressively ordering dry bulkers of 50/60,000 ton size, on the back
of robust transportation needs into and from China. Actively advancing into new businesses, including cogeneration,
environment-related business & IT sector including clean rooms. Employees were reduced due to restructuring.
FINANCIAL INFORMATIIN
The
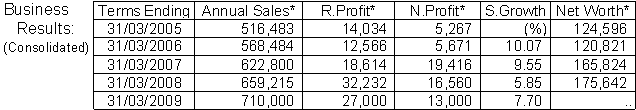
sales volume for Mar/2008 fiscal term amounted to Yen 659,215 million, a 5.9%
up from Yen 622,800 million in the previous term. Newbuilding ship orders exceeded Yen 800 billion for three
consecutive years. By divisions,
Shipbuilding up 18.9% to Yen 302,337 million, supported by robust demand for
bulk carriers, container ships, tankers, etc particularly transportation needs
into China; Steel Structure Construction was down 8.7% to Yen 53,787 million,
due to decreased public works orders; Machinery up 3.2% to Yen 7,444 million,
the highest record; Plants up 24.3% to Yen 100,062 million, supported by robust
plastic plants orders into S/E Asia.
Operating profits and recurring profits recorded the highest levels,
except the net profits. The operating
profit was posted at Yen 36,116 million and the recurring profit at Yen 32,232
million, respectively, compared with Yen 20,712 million operating profit and
Yen 18,614 million recurring profit, respectively, a year ago. The net profit, however, decreased to Yen
16,560 million from Yen 19,416 million, due largely to skyrocketing oil prices
and material steel costs.
(Apr/Jun/2008
results): Sales Yen 132,675 million (down 9.14%), operating loss Yen 435
million (down from Yen 8,883 million profit), recurring loss Yen 475 million
(down from Yen 8,742 million), net losses Yen 919 million (down from 4,985
million). (% compares with the
corresponding period a year ago).
Shipbuilding prices increased, which pushed the sales upwards, but
higher material steel prices and increased subcontracting expenses hurt badly.
For
the current term ending Mar 2009 the recurring profit is projected at Yen
27,000 million and the net profit at Yen 13,000 million, respectively, on a
7.7% rise in turnover, to Yen 710,000 million.
While the shipbuilding will continue to expand but building costs,
including materials and fuel oils, will eat into profits. Now the shipbuilding accounts for 46% of
total sales. Plants & bridges will
improve.
The
financial situation is considered FAIR and good for ORDINARY business
engagements. Max credit limit is
estimated at Yen 11,966.8 million, on 30 days normal terms.
REGISTRATION
Date
Registered: Jul 1937
Legal
Status: Limited Company
(Kabushiki Kaisha)
Authorized: 1,500 million shares
Issued: 830,987,176 shares
Sum: Yen 44,384 million
Major shareholders (%)
Mitsui
& Co (5.1), Japan Trustee Services Bank T (4.6), Master Trust Bank of Japan T (3.7), Goldman Sachs
Int’l (3.6), Hyakujushi Bank (3.4), JTSB (Chuo Mitsui Trust & Banking) (2.8), Mitsui Life Ins (1.9), SMBC
(1.6), Mitsui Sumitomo Marine Ins (1.6); foreign
owners (19.1)
No. of
shareholders: 66,939
Listed
on the S/Exchange (s) of: Tokyo, Osaka, Nagoya, Sapporo, Fukuoka
Managements
Takao Motoyama,
ch; Yasuhiko Katoh, pres; Yoshiharu Saito, v pres; Saburo Sakamaki, mgn dir;
Yutaka Raijo, mgn dir; Tamayoshi Iwasaki, mgn dir; Akihiko Nakauchi, mgn dir; Makoto Sakurai, mgn dir; Norio
Nagata, mgn dir; Kazuo Masuyama, dir
Nothing detrimental is known as to the commercial morality
of executives.
Related companies
Modec
Inc, Mitsui Babcock Energy (UK), Mitsui Zosen Plant Engineering, PACECO Corp (USA), Brumeister & Wain
Scandinavian Contractor A/S (Denmark), other
OPERATION
Activities: Shipbuilding
and heavy electrical machinery mfr (sales breakdown by divisions): Shipbuilding
(46%), steel structure construction (8%), machinery (27%), plants (15%), others
3%).
Products list:
Ships & Oceans: LNG carriers, bulk carriers (grain,
ore, coal, lumber), Oil tankers, FPSO (facility for production, storage and
offloading of crude oil drilled from submarine oil field), Underwater TV
vehicles, R-One robot (autonomous underwater vehicle to search wide underwater
area), Techno super liner, destroyer (equipped with anti-aircraft missile),
patrol ship (for Japan Coast Guard), ship handling simulator, dynamic
positioning system (automatically keep position of ships), other;
Energy systems: marine diesel engines, nuclear fuel
cycles, radioactive waste treatment, cask & containers, diesel generating
plant, gas turbine combined cycle power plants, gas turbine co-generation
system, steam turbine generating system, process compressors, top pressure
recovery turbine (TRT) generating system, natural gas hydrate project;
Environment—Recycling: Mitsui Recycling 21 (thermal
dioxin decomposition system for ash from incinerators), Diobreaker, Mitsui
Fluidized bed waste incinerator, Templar 21 (recycling of kitchen garbage),
Expanded polystyrene recycling system, biogas plant, fluidized bed sludge
incinerator, ultra activated sludge water treatment process;
Plant Engineering: inorganic chemistry plant,
seawater desalination plant;
IT-Related Activities: MapInfo (mapping system for PC version
covering all kinds of map & statistic data), NeoShip (computational fluid
dynamics (CFD) system for ship design);
Logistics Systems: Quayside container crane,
transfer crane in container yard, container terminal management system;
Construction of Social Infrastructure: bridges,
Watergates & penstocks, radar detectors, elementary particle (neutrino)
detectors, floating piers & pontoons;
Advanced Machinery Systems: power electronics equipment, ion
implanter for low-temp poly-silicon TFT, testing system/prober for FPD, CVD-SiC
coating (semiconductor mfg equipment using CVD)
Overseas trading ratio
60.4%: Asia 13.3% (China, Singapore, Malaysia, Thailand); Europe 15.6% (UK); Mid/Near East 2.8% (Iran,
Bahrain); Latin America 17.6% (Panama, Brazil, Ba hamas); others 11.1%.
Clients
[Mfrs, wholesalers] Mitsubishi Corp, Mitsui & Co,
Sumihiro Co, Imabari Shipbuilding, other.
No. of accounts: 2,000
Domestic areas of activities: Nationwide
Suppliers
[Mfrs, wholesalers] Mitsui &
Co, IHI, Okaya & Co, Mitsubishi Corp, other.
Payment
record: Regular
Location: Business area in
Tokyo. Office premises at the caption
address are owned and maintained satisfactorily.
Bank References
SMBC (H/O)
Mizuho Corporate Bank (H/O)
Relations: Satisfactory
FINANCES: (In Million Yen)
|
FINANCES: (Consolidated
in million yen) |
|
|||||
|
|
|
Terms Ending: |
31/03/2008 |
31/03/2007 |
||
|
INCOME STATEMENT |
|
|
||||
|
|
Annual Sales |
|
659,215 |
622,800 |
||
|
|
Cost of Sales |
581,748 |
566,158 |
|||
|
|
GROSS PROFIT |
77,466 |
56,641 |
|||
|
|
Selling & Adm Costs |
41,347 |
35,928 |
|||
|
|
OPERATING PROFIT |
36,118 |
20,712 |
|||
|
|
Non-Operating P/L |
-3,886 |
-2,098 |
|||
|
|
RECURRING PROFIT |
32,232 |
18,614 |
|||
|
|
NET PROFIT |
16,560 |
19,416 |
|||
|
BALANCE SHEET |
|
|
|
|||
|
|
Cash |
|
53,907 |
77,087 |
||
|
|
Receivables |
|
128,358 |
119,337 |
||
|
|
Inventory |
|
96,366 |
87,978 |
||
|
|
Securities, Marketable |
6,469 |
422 |
|||
|
|
Other Current Assets |
108,420 |
84,912 |
|||
|
|
TOTAL CURRENT ASSETS |
393,520 |
369,736 |
|||
|
|
Property & Equipment |
192,749 |
192,974 |
|||
|
|
Intangibles |
|
16,056 |
18,313 |
||
|
|
Investments, Other Fixed Assets |
109,220 |
122,413 |
|||
|
|
TOTAL ASSETS |
711,545 |
703,436 |
|||
|
|
Payables |
|
153,999 |
140,594 |
||
|
|
Short-Term Bank Loans |
32,567 |
50,011 |
|||
|
|
|
|
|
|
||
|
|
Other Current Liabs |
222,893 |
189,915 |
|||
|
|
TOTAL CURRENT LIABS |
409,459 |
380,520 |
|||
|
|
Debentures |
|
15,520 |
16,070 |
||
|
|
Long-Term Bank Loans |
62,969 |
84,462 |
|||
|
|
Reserve for Retirement Allw |
7,476 |
13,912 |
|||
|
|
Other Debts |
|
40,479 |
42,648 |
||
|
|
TOTAL LIABILITIES |
535,903 |
537,612 |
|||
|
|
MINORITY INTERESTS |
|
|
|||
|
|
Common
stock |
44,384 |
44,384 |
|||
|
|
Additional
paid-in capital |
18,194 |
18,186 |
|||
|
|
Retained
earnings |
52,331 |
38,695 |
|||
|
|
Evaluation
p/l on investments/securities |
9,415 |
15,902 |
|||
|
|
Others |
|
51,884 |
49,019 |
||
|
|
Treasury
stock, at cost |
(566) |
(362) |
|||
|
|
TOTAL S/HOLDERS` EQUITY |
175,642 |
165,824 |
|||
|
|
TOTAL EQUITIES |
711,545 |
703,436 |
|||
|
CONSOLIDATED CASH FLOWS |
|
|
||||
|
|
|
Terms ending: |
31/03/2008 |
31/03/2007 |
||
|
|
Cash
Flows from Operating Activities |
|
48,338 |
67,873 |
||
|
|
Cash
Flows from Investment Activities |
-18,040 |
-26,986 |
|||
|
|
Cash
Flows from Financing Activities |
-36,960 |
-26,574 |
|||
|
|
Cash,
Bank Deposits at the Term End |
|
89,400 |
96,521 |
||
|
ANALYTICAL RATIOS Terms
ending: |
31/03/2008 |
31/03/2007 |
||||
|
|
|
Net Worth
(S/Holders' Equity) |
175,642 |
165,824 |
||
|
|
|
Current
Ratio (%) |
96.11 |
97.17 |
||
|
|
|
Net
Worth Ratio (%) |
24.68 |
23.57 |
||
|
|
|
Recurring
Profit Ratio (%) |
4.89 |
2.99 |
||
|
|
|
Net
Profit Ratio (%) |
2.51 |
3.12 |
||
|
|
|
Return
On Equity (%) |
9.43 |
11.71 |
||
FOREIGN EXCHANGE
RATES
|
Currency |
Unit
|
Indian Rupees |
|
US Dollar |
1 |
Rs.43.23 |
|
UK Pound |
1 |
Rs.80.89 |
|
Euro |
1 |
Rs.63.80 |
RATING EXPLANATIONS
|
RATING |
STATUS |
PROPOSED CREDIT LINE |
|
|
>86 |
Aaa |
Possesses an extremely sound financial base with the strongest
capability for timely payment of interest and principal sums |
Unlimited |
|
71-85 |
Aa |
Possesses adequate working capital. No caution needed for credit
transaction. It has above average (strong) capability for payment of interest
and principal sums |
Large |
|
56-70 |
A |
Financial & operational base are regarded healthy. General unfavourable
factors will not cause fatal effect. Satisfactory capability for payment of
interest and principal sums |
Fairly Large |
|
41-55 |
Ba |
Overall operation is considered normal. Capable to meet normal
commitments. |
Satisfactory |
|
26-40 |
B |
Unfavourable & favourable factors carry similar weight in credit
consideration. Capability to overcome financial difficulties seems
comparatively below average. |
Small |
|
11-25 |
Ca |
Adverse factors are apparent. Repayment of interest and principal sums
in default or expected to be in default upon maturity |
Limited with
full security |
|
<10 |
C |
Absolute credit risk exists. Caution needed to be exercised |
Credit not
recommended |
|
NR |
In view of the lack of information, we have no basis upon which to
recommend credit dealings |
No Rating |
|
This score serves as a reference to assess SC’s credit risk
and to set the amount of credit to be extended. It is calculated from a composite
of weighted scores obtained from each of the major sections of this report. The
assessed factors and their relative weights (as indicated through %) are as
follows:
Financial
condition (40%) Ownership
background (20%) Payment
record (10%)
Credit history
(10%) Market trend
(10%) Operational
size (10%)