![]()
MIRA
INFORM REPORT
|
Report Date : |
22.08.2008 |
IDENTIFICATION
DETAILS
|
Name : |
DISEDIS SL |
|
|
|
|
Registered Office : |
Street Paris
(Pq Empresarial Europolis), 2, Cp 28232, Las Rozas De
Madrid Madrid |
|
|
|
|
Country : |
Spain |
|
|
|
|
Financials (as on) : |
31.12.2006 |
|
|
|
|
Date of Incorporation : |
|
|
|
|
|
Legal Form : |
Limited Liability Company |
|
|
|
|
Line of Business : |
RATING &
COMMENTS
|
MIRA’s Rating : |
A |
|
RATING |
STATUS |
PROPOSED CREDIT LINE |
|
|
56-70 |
A |
Financial & operational base are regarded healthy. General
unfavourable factors will not cause fatal effect. Satisfactory capability for
payment of interest and principal sums |
Fairly Large |
|
Maximum Credit Limit : |
406.284,18 € |
|
|
|
|
Status : |
Good |
|
|
|
|
Payment Behaviour : |
Regular |
|
|
|
|
Litigation : |
Clear |
FINANCIAL REPORT
DISEDIS SL
TAX NUMBER: B79380069
EXECUTIVE SUMMARY
Identification
Current Business Name: DISEDIS SL
Other names: NO
Current
Address: STREET PARIS
(PQ EMPRESARIAL EUROPOLIS), 2, CP 28232, LAS ROZAS DE
MADRID MADRID
Branches: 1
Telephone number: 916363180
Fax: 916363184
URL: www.amichi.es
Commercial Risk
Credit Appraisal: 406.284,18 €
RAI: NO
Legal Actions: YES
Financial Information
Latest Balance sheet sales (2006): 20.481.863,00 € (MERCANTILE REGISTER)
Result: 1.652.674 €
Total Assets: 13.863.539 €
Social Capital: 3.719.066,00 €
Employees: 240
Commercial Information
Constitution Date: 01/03/1990
Business activity: Wholesale of
clothing (outerwear)
NACE Code: 5142
International Operations: Imports and
Exports
Corporate Structure
Administrator:
Participations: 1
Other Complementary Information
Latest proceeding published in BORME: 19/10/2007 Re-elections
Latest press article: 15/10/2006 EL
PAIS (BRANCHES INFORMATION)
Bank Entities: Yes
Credit Appraisal
Maximum Credit
Favourable to
406.284,18 €
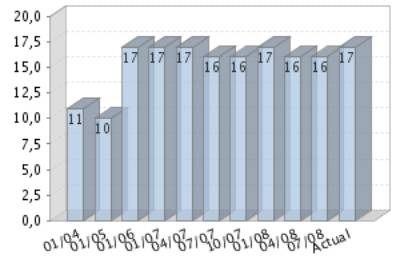
Rating Evolution
Financial Situation
Fiscal year2006
|
Treasury |
Excellent |
|
Indebtedness |
Very Weak |
|
Profitability |
Sufficient |
|
Balance |
Excellent |
Performance
|
Legal Actions |
None or
Negligible |
|
Business Trajectory |
Excellent |
RAI 
COMPANY NOT REGISTERED IN THE R.A.I.
This company is not registered in the Disputed Bills register (R.A.I.)
DATE AND TIME OF THE CONSULTATION: 14/08/2008
09:08:31
INCIDENTS

Summary
LEGAL ACTIONS: No legal
incidences registered
|
CLAIM FILED AGAINST THE ADMINISTRATION: 3 ( First:
26/11/2003, last: 16/11/2007 )With the Social Security: |
0 |
|
With the Tax
Authorities: |
0 |
|
With Other
Official bodies: |
3 |
AFFECTED BY: No significant
element.
Last claim filed against the administration
Figures expressed
in €
WITH OTHER
OFFICIAL BODIES
3 claim(s)
Seizures
|
DATE |
ORGANIZATION |
AMOUNT |
|
03/12/2004 |
DEPUTATION/
DELEGATION PROVINCIAL DE SEVILLA |
513,06 |
|
26/11/2003 |
TOWN/ CITY
HALL DE SEVILLA |
|
Executive
|
DATE |
ORGANIZATION |
AMOUNT |
|
16/11/2007 |
TOWN/ CITY
HALL CONCELLO DE SANTIAGO DE COMPOSTELA |
704,96 |
FINANCIAL ELEMENTS AND SECTORIAL
COMPARATIVE
FINANCIAL ELEMENTS
Figures given in €
|
|
2004 (12) |
2005 (12) |
2006 (12) |
% ASSETS |
|
|
|
|
|
|
BALANCE SHEET ANALYSIS |
|
|
|
|
|
|
|
|
|
|
OWN FUNDS |
5.722.100,00 |
6.981.315,00 |
8.324.634,00 |
60,05 |
|
|
|
|
|
|
DEBT |
2.812.985,00 |
4.392.298,00 |
5.538.905,00 |
39,95 |
|
|
|
|
|
|
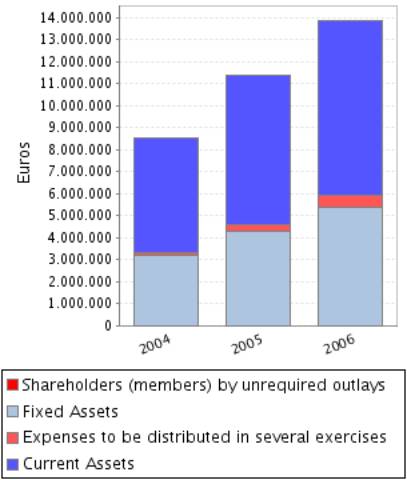
FIXED ASSETS |
3.215.436,00 |
4.258.739,00 |
5.400.928,00 |
38,96 |
|
|
|
|
|
|
TOTAL ASSETS |
8.535.085,00 |
11.373.613,00 |
13.863.539,00 |
|
|
|
|
|
|
|
|
|
|
|
|
|
|
|
|
|
|
|
2004 (12) |
2005 (12) |
2006 (12) |
% SALES |
|
|
|
|
|
|
PROFIT AND LOSS ACCOUNT ANALYSIS |
|
|
|
|
|
|
|
|
|
|
SALES |
16.636.634,00 |
17.916.483,00 |
20.481.863,00 |
|
|
|
|
|
|
|
ADDED VALUE |
6.183.792,00 |
6.948.579,00 |
7.754.101,00 |
37,86 |
|
|
|
|
|
|
EBITDA |
2.846.669,00 |
3.078.582,00 |
3.162.566,00 |
15,44 |
|
|
|
|
|
|
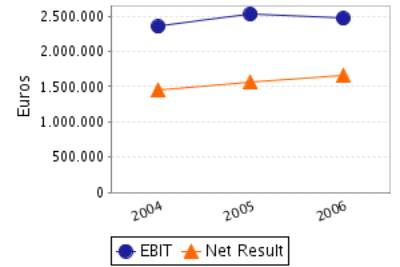
EBIT |
2.352.235,00 |
2.527.901,00 |
2.468.361,00 |
12,05 |
|
|
|
|
|
|
NET RESULT |
1.458.416,00 |
1.559.292,00 |
1.652.674,00 |
8,07 |
|
|
|
|
|
Balance Sheets Items
Analysis
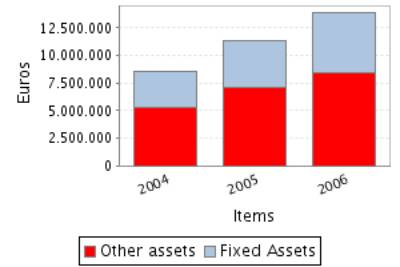
Balance Sheet Comments
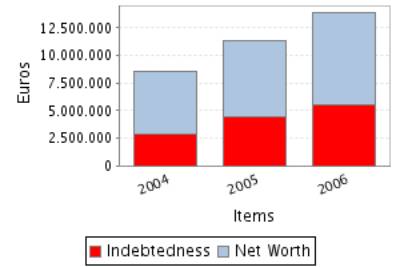
Total assets of the company grew 33,26% between 2004 and 2005.
This growth has been inferior in the case of the fixed assets that
increased just in 32,45%.
This growth has been mainly financed with a debt increase of 56,14%.
Nevertheless the net worth increased 22,01%.
Total assets of the company grew 21,89% between 2005 and 2006.
This growth is a consequence of the fixed assets increase of 26,82%.
This growth has been mainly financed with a debt increase of 26,10%.
Nevertheless the net worth increased 19,24%.
Profit and Loss Account Analysis
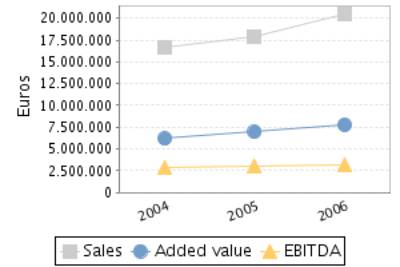
Profit and Loss Account Comments
The company’s sales figure grew 7,69% between 2004 and 2005.
The company’s EBIT grew 7,47% between 2004 and 2005.
This evolution implies a reduction in the company’s operating
profitability.
The result of these variations is a decrease of the company’s Economic
Profitability of 19,35% in the analysed period, being this profitability of
22,23% in the year 2005.
The company’s Net Result grew 6,92% between 2004 and 2005.
This evolution, compared to the EBIT’s performance, implies that the
financial and extraordinary activities have had a negative effect in the
company’s Financial Profitability.
The result of these variations is a reduction of the company’s
profitability of 12,37% in the analysed period, being equal to 22,34% in the
year 2005.
The company’s sales figure grew 14,32% between 2005 and 2006.
The company’s EBIT decreased in 2,36% between 2005 and 2006.
This evolution implies a reduction in the company’s operating
profitability.
The result of these variations is a decrease of the company’s Economic
Profitability of 19,89% in the analysed period, being this profitability of
17,80% in the year 2006.
The company’s Net Result grew 5,99% between 2005 and 2006.
This evolution, compared to the EBIT’s performance, implies that the
financial and extraordinary activities have had a positive effect in the
company’s Financial Profitability.
The result of these variations is a reduction of the company’s
profitability of 11,11% in the analysed period, being equal to 19,85% in the
year 2006.
ANNUAL FINANCIAL REPORT
ADDITIONAL DATA
Source: annual financial
report 2006
Results Distribution
Figures given in €
|
DISTRIBUTION
BASE |
DISTRIBUTION TO |
||
|
Profit and Loss |
1.652.674,00 |
Retained earnings |
165.267,00 |
|
Carry Over |
0,00 |
Voluntary Reserve |
998.715,00 |
|
Voluntary reserves |
0,00 |
Prior years losses |
0,00 |
|
Reserves |
0,00 |
Carry Over |
0,00 |
|
Other concepts |
0,00 |
Other funds |
0,00 |
|
Total of Amounts to be distributed |
1.652.674,00 |
Dividends |
488.692,00 |
|
|
|
Other Applications |
0,00 |
Auditing
Auditors’ opinion: FAVOURABLE
Auditor: AUDIT S.L. (AUDITORES ASESORES)
COMPARATIVE SECTOR ANALYSIS
Values table
Figures expressed
in %
|
|
COMPANY (2006) |
SECTOR |
DIFFERENCE |
DIFFERENCE RELATIVE |
|
|
|
|
|
|
BALANCE SHEET ANALYSIS: % on the total assets |
|
|
|
|
|
|
|
|
|
|
OWN FUNDS |
60,05 |
38,61 |
21,44 |
55,52 |
|
|
|
|
|
|
DEBT |
39,95 |
61,39 |
-21,44 |
-34,92 |
|
|
|
|
|
|
FIXED ASSETS |
38,96 |
20,07 |
18,88 |
94,07 |
|
|
|
|
|
|
|
|
|
|
|
|
|
|
|
|
|
|
COMPANY (2006) |
SECTOR |
DIFFERENCE |
DIFFERENCE RELATIVE |
|
|
|
|
|
|
PROFIT AND LOSS ACCOUNT ANALYSIS: % on the total operating income |
|
|
|
|
|
|
|
|
|
|
SALES |
99,15 |
98,43 |
0,72 |
0,73 |
|
|
|
|
|
|
ADDED VALUE |
37,54 |
15,12 |
22,42 |
148,26 |
|
|
|
|
|
|
EBIT |
11,95 |
4,75 |
7,20 |
151,56 |
|
|
|
|
|
|
NET RESULT |
8,00 |
3,09 |
4,91 |
158,92 |
|
|
|
|
|
Sector Composition
Compared sector (NACE): 514
Number of companies: 635
Size (Sales Figure) : 7.000.000,00
- 40.000.000,00 Euros
Comments on the sectorial comparative
Compared to its sector the assets of the companies show a greater
proportion of fixed assets. Specifically the difference with the sector average
is 18,88% , which means a relative difference of 94,07% .
In liabilities composition the company appeals on a wider scale to self
financing, being the proportion of net worth of 21,44% superior, which means a
relative difference of 55,52% . As a consequence, external financing sources
are less used by the company in 21,44% less than the sector, which means a
difference of 34,92% .
The proportion that the sales mean to the company’s total ordinary
income is 99,15%, 0,72% higher than in the sector, which means a relative
difference of 0,73% .
The company’s EBIT
was positive and was 11,95% with regard to the total ordinary income, 7,20%
higher than in the sector, which means a relative difference of 151,56% .
The company’s capacity to generate operating income is higher than the
one of the sector as its ratio EBIT/Sales is higher (ES Company versus ES
Sector).
The company’s net result was positive and equal to 8,00% with regard to
the total ordinary income, 4,91% higher than in the sector, which means a
relative difference of 158,92% .
The financial and extraordinary results and the tax impact have had a
less negative impact on the Net result in the company than in the sector; as a
consequence, the company shows a better Net Result/EBIT ratio (REBEmpresa vs.
REBSector).
ADDRESSES
Current Legal Seat Address:
STREET PARIS (PQ EMPRESARIAL EUROPOLIS), 2
28232 LAS ROZAS DE MADRID MADRID
Previous Seat Address:
STREET JUAN DE AUSTRIA, 6
28010
MADRID
Characteristics of the current
address
Type of premises: store
Property: shared
Property Description: Malla Sl
Local Situation: secondary
Branches 
|
STREET |
POSTAL CODE |
TOWN |
PROVINCE |
|
CARRETERA ROZAS
AL ESCORIAL KM 2 |
28230 |
LAS ROZAS DE
MADRID |
Madrid |
1 branches
registered
CORPORATE STRUCTURE
ADMINISTRATIVE LINKS
Main Board members, Directors and Auditor ![]()
|
POSITION |
SURNAMES AND
NAME |
APPOINTMENT DATE |
|
|
ADMINISTRATOR |
AMICH ELIZALDE JUAN CARLOS |
05/04/2004 |
|
|
ADMINISTRATOR |
AMICH ELIZALDE THAIS |
05/04/2004 |
|
|
AUDITOR |
APPOINTMENT DATE |
||
|
AUDIT SL |
19/10/2007 |
||
Functional Managers
|
POSITION |
SURNAMES AND
NAME |
|
General Manager |
AMICH ELIZALDE
JUAN CARLOS |
FINANCIAL LINKS
|
|
BUSINESS NAME |
CIF / COUNTRY |
% |
SOURCE |
DATA INF. |
|
|
AMICH TINTORER JUAN CARLOS |
|
50,00 |
OWN SOURCES |
04/06/2008 |
|
|
AMICH ELIZALDE THAIS |
|
15,00 |
OWN SOURCES |
04/06/2008 |
|
|
AMICH ELIZALDE CAROLINA |
|
15,00 |
OWN SOURCES |
04/06/2008 |
|
|
AMICH ELIZALDE JUAN CARLOS |
|
15,00 |
OWN SOURCES |
04/06/2008 |
|
|
MARTINEZ DE LECEA GARCIA E |
|
5,00 |
OWN SOURCES |
25/04/2008 |
|
|
BUSINESS NAME |
CIF / COUNTRY |
% |
SOURCE |
DATA INF. |
|
|
MANUFACTURAS TRICOT DISTRIBUCION S.L. |
B81147779 |
50,00 |
OWN SOURCES |
25/04/2008 |
![]() Company
with solvency rating below 7
Company
with solvency rating below 7
CREDIT INFORMATION
Constitution Date: 01/03/1990
Foundation Date: 01/01/1990
Founder / Origin: LA TITULAR ES LA
FUNDADORA INICIAL DEL NEGOCIO
Business activity 
Activity: Wholesale of clothing (outerwear)
NACE Code: 5142
NACE Activity: Wholesale of
clothing and footwear
Business: COMERCIO AL MAYOR DE CONFECCION
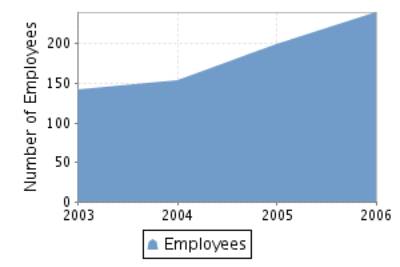
Employees 
Number of total employees: 240 (2008)
Number of fixed employees: 100,00%
Number of temporary employees: 0,00%
Employees evolution
SUPPLIERS
|
BUSINESS NAME |
INTERNATIONAL |
|
TRASTIS 2005 SL |
NO |
|
ZILEMA 2005 SL |
NO |
|
MALLA 3 SL |
NO |
3 proveedores
SALES
Collection (estimated):
Cash sales percentage: 20%
On a credit basis: 80%
National Distribution: 100%
CLIENTS
|
BUSINESS NAME |
INTERNATIONAL |
|
MALLA 3 SL |
NO |
1 clientes
Banks 
|
ENTITY |
BRANCH |
ADDRESS |
TOWN OR CITY |
PROVINCE |
|
BANCO DE
SABADELL, S.A. |
|
|
MADRID |
|
|
BANCO POPULAR
ESPAÑOL, S.A. |
0438 |
GRAN VIA, 23 |
MAJADAHONDA |
Madrid |
|
BANCO BILBAO
VIZCAYA ARGENTARIA, S.A. |
|
|
|
|
|
BANCO ESPAÑOL DE
CREDITO, S.A. |
|
|
|
|
|
BANCO SANTANDER, S.A. |
|
|
|
|
6 bank entities registered
LEGAL STRUCTURE
Constitution Data
Register Date: 01/03/1990
Register town: Madrid
Announcement number: 46053
Legal form: LIMITED LIABILITY
COMPANY
Social Capital: 12.020,24 €
Current Legal Form: LIMITED LIABILITY
COMPANY
Current Capital:
3.719.066,00 €
Legal Aspects
Obligation to fill in Financial
Statements: YES
Chamber census: YES (2006)
Listed on a Stock Exchange: NO
B.O.R.M.E.(Official Companies
Registry Gazette) 
Registered Proceedings
|
PROCEEDINGS |
DATE |
NOTICE NUM. |
TRADE REG. |
|
Re-elections |
19/10/2007 |
524452 |
Madrid |
|
Re-elections |
14/11/2006 |
542055 |
Madrid |
Other Proceedings published
|
PROCEEDINGS |
DATE |
NOTICE NUM. |
TRADE REG. |
|
Registration of
accounts (2006) Individual |
17/10/2007 |
845021 |
Madrid |
|
Registration of
accounts (2005) Individual |
13/11/2006 |
865453 |
Madrid |
|
Registration of
accounts (2004) Individual |
10/10/2005 |
686894 |
Madrid |
Press articles

15/10/2006 EL PAIS (BRANCHES INFORMATION)
LA CADENA DE MODA AMICHI, CENTRADA EN LA FRANQUICIA Y QUE CUENTA CON 111
TIENDAS, DE LAS CUALES 14 SE UBICAN EN EL EXTRANJERO, HA EMPEZADO RECIENTEMENTE
SU EXPANSION EN ESTADOS UNIDOS.
31/05/2006 CINCO DIAS (BRANCHES
INFORMATION)
AMICHI INAUGURA UNA NUEVA TIENDA EN EL CENTRO COMERCIAL PLENILUNIO, EN
MADRID. CON ESTA APERTURA, LA FIRMA CUENTA YA CON 108 PUNTOS DE VENTA EN
ESPA/A, 47 PROPIAS Y 61 FRANQUICIADAS. LA NUEVA TIENDA TIENE 220 METROS
CUADRADOS DISTRIBUIDOS EN UNA SOLA PLANTA. LA CIA. ESPERA ABRIR PROXIMAMENTE
OTRO ESTABLECIMIENTO EN VIGO.
FINANCIAL INFORMATION
The information on the last account contained in this report is
extracted from the Mercantile Register file of the legal address of the Company
and dated 14/12/2007.
BALANCE SHEET
Assets
Figures given in €
|
|
31/12/2004 (12) |
31/12/2005 (12) |
31/12/2006 (12) |
|
A) DUE FROM SHAREHOLDERS FOR UNCALLED
CAPITAL |
|
|
|
|
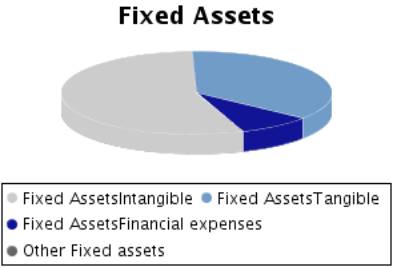
B) FIXED ASSETS |
3.215.436,00 |
4.258.739,00 |
5.400.928,00 |
|
I. Incorporation costs |
24.178,00 |
7.271,00 |
2.251,00 |
|
II. Intangible fixed assets |
497.651,00 |
1.703.095,00 |
2.973.164,00 |
|
R & D expenses |
|
|
|
|
Concessions, patents, licences , trademarks |
|
|
|
|
Goodwill |
|
|
|
|
Acquired rights from finance leases |
142.339,00 |
142.339,00 |
391.637,00 |
|
Software |
|
|
|
|
Leasing |
394.387,00 |
1.723.542,00 |
2.985.849,00 |
|
Cash advance |
|
|
|
|
Provisions |
|
|
|
|
Depreciation |
-39.075,00 |
-162.786,00 |
-404.322,00 |
|
III. Tangible fixed assets |
2.359.904,00 |
2.123.652,00 |
1.953.299,00 |
|
Property, plant and equipment |
389.619,00 |
389.619,00 |
389.619,00 |
|
Machinery, equipment and other |
3.303.093,00 |
3.273.033,00 |
3.464.244,00 |
|
Other property plant and equipment |
291.259,00 |
291.574,00 |
312.106,00 |
|
Prepaid expenses on fixed assets |
|
|
|
|
Other assets |
333.112,00 |
380.083,00 |
430.859,00 |
|
Provisions |
|
|
|
|
Depreciation |
-1.957.179,00 |
-2.210.657,00 |
-2.643.529,00 |
|
IV. Financial fixed assets |
333.703,00 |
424.721,00 |
472.214,00 |
|
Shares in affiliated companies |
21.035,00 |
21.035,00 |
21.035,00 |
|
Receivables in affiliated companies |
|
|
|
|
Shares in associated companies |
|
|
|
|
Loans to associated companies |
|
|
|
|
Securities |
|
|
|
|
Other loans |
9.015,00 |
9.015,00 |
9.015,00 |
|
Long term deposits and guarantees |
333.703,00 |
424.721,00 |
472.214,00 |
|
Provisions |
-30.050,00 |
-30.050,00 |
-30.050,00 |
|
Taxes receivable |
|
|
|
|
V.Owners equity |
|
|
|
|
VI.Long term trade liabilities |
|
|
|
|
C) DEFERRED EXPENSES |
81.231,00 |
315.790,00 |
498.604,00 |
|
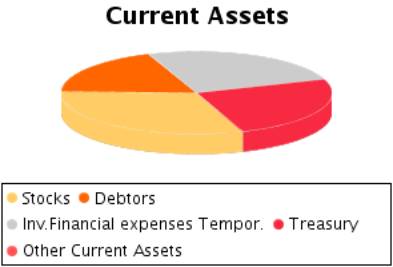
D) CURRENT ASSETS |
5.238.418,00 |
6.799.084,00 |
7.964.007,00 |
|
I. Shareholders by required outlays |
|
|
|
|
II. Stocks |
1.648.742,00 |
1.832.448,00 |
2.475.234,00 |
|
Goods available for sale |
|
|
|
|
Raw material inventory |
371.260,00 |
260.025,00 |
180.807,00 |
|
Work in Progress |
|
|
|
|
Finished goods |
1.277.482,00 |
1.572.423,00 |
2.294.427,00 |
|
Subproducts and recycled materials |
|
|
|
|
Cash advance |
|
|
|
|
Provisions |
|
|
|
|
III. Debtors |
1.335.902,00 |
1.601.553,00 |
1.491.775,00 |
|
Clients |
1.494.435,00 |
1.754.161,00 |
1.683.026,00 |
|
Amounts owned by affiliated companies |
|
|
|
|
Amounts owned by associated companies |
|
|
|
|
Other debts |
97.389,00 |
101.256,00 |
64.490,00 |
|
Staff Expenses |
7.781,00 |
9.839,00 |
7.963,00 |
|
Government |
30.529,00 |
30.529,00 |
30.528,00 |
|
Provisions |
-294.232,00 |
-294.232,00 |
-294.232,00 |
|
IV. Temporary financial investment |
887.068,00 |
1.976.845,00 |
2.023.674,00 |
|
Shares in affiliated companies |
|
|
|
|
Receivables in affiliated companies |
|
|
|
|
Shares in associated companies |
|
|
|
|
Loans to associated companies |
|
|
|
|
Short term investment |
|
|
|
|
Other loans |
887.068,00 |
1.976.845,00 |
2.023.674,00 |
|
Short Term Deposit and guarantees |
|
|
|
|
Provisions |
|
|
|
|
V. Short-term own shares |
|
|
|
|
VI. Treasury |
1.366.706,00 |
1.388.238,00 |
1.973.324,00 |
|
VII. Periodification adjustments |
|
|
|
|
ASSETS (A + B + C + D) |
8.535.085,00 |
11.373.613,00 |
13.863.539,00 |
Assets composition
Liabilities
Figures given in €
|
|
31/12/2004 (12) |
31/12/2005 (12) |
31/12/2006 (12) |
|
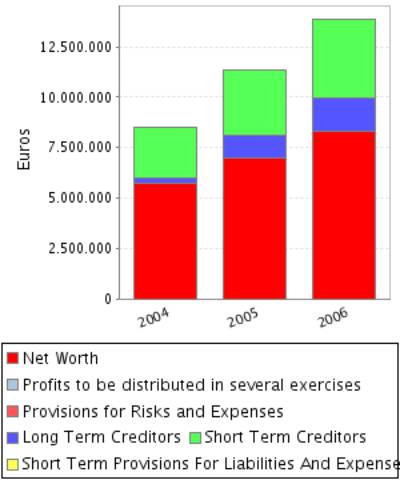
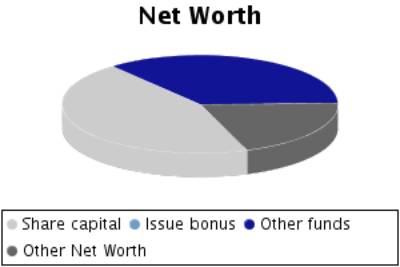
A) SHAREHOLDERS EQUITY |
5.722.100,00 |
6.981.315,00 |
8.324.634,00 |
|
I. Share capital |
3.719.066,00 |
3.719.066,00 |
3.719.066,00 |
|
II. Issue bonus |
|
|
|
|
III.Revaluation reserve |
|
|
|
|
IV.Reserves |
544.618,00 |
1.702.957,00 |
2.952.894,00 |
|
Retained earnings |
84.222,00 |
230.063,00 |
385.992,00 |
|
Sinking fund from owner equity |
|
|
|
|
Reserve for the parent company capital |
|
|
|
|
Statutory reserve |
|
|
|
|
Other funds |
460.396,00 |
1.472.894,00 |
2.566.902,00 |
|
Capital adjustments in Euros |
|
|
|
|
V.Results from previous years |
|
|
|
|
Carry Over |
|
|
|
|
Prior years losses |
|
|
|
|
Loans from partners for losses compensation |
|
|
|
|
VI.Profit and Losses |
1.458.416,00 |
1.559.292,00 |
1.652.674,00 |
|
VII.Dividend paid during the year |
|
|
|
|
VIII.Own shares for capital reduction |
|
|
|
|
B) DEFERRED INCOME |
|
|
|
|
Capital grants |
|
|
|
|
Positive change difference |
|
|
|
|
Other deferred income |
|
|
|
|
Fiscal deferred income |
|
|
|
|
C) PROVISIONS FOR LIABILITIES AND EXPENSES |
|
|
|
|
Provision for pensions plans |
|
|
|
|
Provision for taxes |
|
|
|
|
Other provisions |
|
|
|
|
Reversion fund |
|
|
|
|
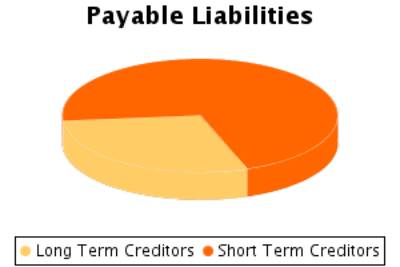
D) LONG TERM LIABILITIES |
252.798,00 |
1.107.073,00 |
1.608.341,00 |
|
I.Negotiable bonds and other negotiable
values |
|
|
|
|
Non convertible securities |
|
|
|
|
Convertible securities |
|
|
|
|
Other convertible debentures |
|
|
|
|
II.Debt with bank entities |
252.798,00 |
1.107.073,00 |
1.608.341,00 |
|
Long term bank loans |
|
|
|
|
Leasing |
252.798,00 |
1.107.073,00 |
1.608.341,00 |
|
III.Debts with associated and affiliated
companies |
|
|
|
|
With affiliated companies |
|
|
|
|
Associated companies |
|
|
|
|
IV. Other creditors |
|
|
|
|
Bills payable |
|
|
|
|
Other debts |
|
|
|
|
Long term deposit and guaranties |
|
|
|
|
Taxes receivable |
|
|
|
|
V. Deferred debts on shares |
|
|
|
|
From affiliated companies |
|
|
|
|
From associated companies |
|
|
|
|
Other companies |
|
|
|
|
VI. Long term debt with creditor |
|
|
|
|
E) SHORT TERM LIABILITIES |
2.560.187,00 |
3.285.225,00 |
3.930.564,00 |
|
I.Negotiable bonds and other negotiable
values |
|
|
|
|
Non convertible securities |
|
|
|
|
Convertible securities |
|
|
|
|
Other convertible debentures |
|
|
|
|
Interests from bonds |
|
|
|
|
II.Debt with bank entities |
168.023,00 |
573.607,00 |
983.967,00 |
|
Loans and other debts |
|
|
|
|
Debt interest |
|
|
|
|
Leasing |
168.023,00 |
573.607,00 |
983.967,00 |
|
III. Short term debts with associated and
affiliated companies |
|
|
10.730,00 |
|
With affiliated companies |
|
|
10.730,00 |
|
Associated companies |
|
|
|
|
IV. Commercial creditors |
1.127.228,00 |
1.181.478,00 |
1.851.939,00 |
|
Accounts payable |
|
|
|
|
Expenses |
1.127.228,00 |
774.841,00 |
1.400.146,00 |
|
Bills payable |
|
406.637,00 |
451.793,00 |
|
V. Other non-commercial debt |
1.264.936,00 |
1.530.140,00 |
1.083.928,00 |
|
Government |
828.611,00 |
949.194,00 |
958.930,00 |
|
Bills payable |
|
|
|
|
Other debts |
436.325,00 |
406.637,00 |
|
|
Accounts receivable |
|
174.309,00 |
124.998,00 |
|
Short term deposits and guarantees |
|
|
|
|
VI. Provisions for current assets |
|
|
|
|
VII. Periodification adjustments |
|
|
|
|
F) SHORT TERM PROVISIONS FOR LIABILITIES AND
EXPENSES |
|
|
|
|
LIABILITIES (A + B + C + D + E + F) |
8.535.085,00 |
11.373.613,00 |
13.863.539,00 |
Liabilities
Composition
PROFIT AND LOSS ACCOUNT
Itams of the Profit and Loss Account
Figures given in €
|
|
31/12/2004 (12) |
31/12/2005 (12) |
31/12/2006 (12) |
|
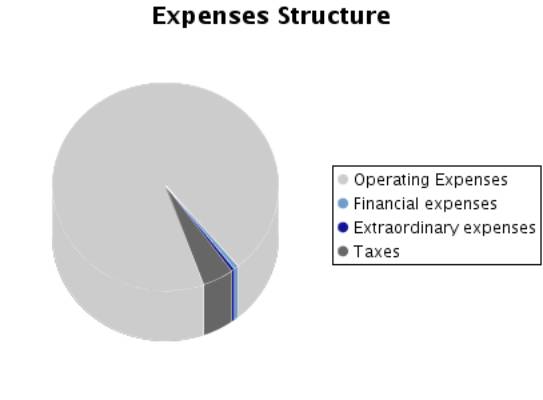
A) EXPENSES (A.1 a A.16) |
15.377.531,00 |
16.754.353,00 |
19.883.684,00 |
|
A.1.Reduction in stocks of finished goods
and work in progress |
42.416,00 |
|
|
|
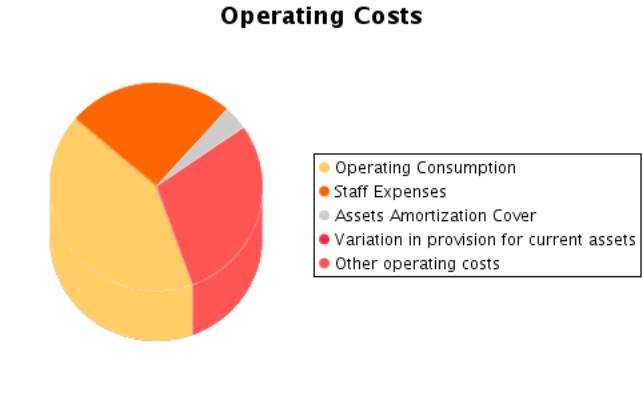
A.2.Supplies |
6.870.985,00 |
7.102.478,00 |
8.265.194,00 |
|
Material consumed |
6.870.985,00 |
7.102.478,00 |
8.265.194,00 |
|
Raw materials consumed |
|
|
|
|
Other expenses |
|
|
|
|
A.3. Labour cost |
3.337.123,00 |
3.869.997,00 |
4.591.535,00 |
|
Wages |
2.682.576,00 |
3.080.605,00 |
3.643.628,00 |
|
Social security expenses |
654.547,00 |
789.392,00 |
947.907,00 |
|
A.4. Assets depreciation |
467.623,00 |
550.681,00 |
694.205,00 |
|
A.5.Variance in the traffic provisions |
26.811,00 |
|
|
|
Variance in provision for inventory |
|
|
|
|
Variance in provision for bad debts |
26.811,00 |
|
|
|
Variance in provision for other current assets |
|
|
|
|
A.6. Other operating costs |
3.716.591,00 |
4.228.607,00 |
5.280.449,00 |
|
External costs |
3.652.626,00 |
4.116.710,00 |
5.182.323,00 |
|
Taxes |
63.965,00 |
111.897,00 |
98.126,00 |
|
Other day to day expenses |
|
|
|
|
Allowance to reversion fund |
|
|
|
|
A.I.OPERATING RESULT (B.1+B.2+B.3+B.4-A.1-A.2-A.3-A.4-A.5-A.6) |
2.352.235,00 |
2.527.901,00 |
2.468.361,00 |
|
A.7.Financial expenses and similar |
66.316,00 |
93.366,00 |
120.702,00 |
|
Debts with related companies |
|
|
|
|
Debts with associated companies |
|
|
|
|
Other companies debts By debts with third parties and similar expenses |
66.316,00 |
93.366,00 |
120.702,00 |
|
Losses from financial investments |
|
|
|
|
A.8. Variation in financial investment
provision |
|
|
|
|
A.9.Negative exchange difference |
|
|
|
|
A.II.POSITIVE FINANCIAL RESULTS
(B.5+B.6+B.7+B.8-A.7-A.8-A.9) |
|
|
112.884,00 |
|
A.III.PROFIT FROM ORDINARY ACTIVITIES
(A.I+A.II-B.I-B.II) |
2.302.173,00 |
2.462.506,00 |
2.581.245,00 |
|
A.10. Variation in provision in fixed assets |
|
|
|
|
A.11. Losses in fixed assets |
66.964,00 |
69.606,00 |
78.618,00 |
|
A.12. Losses from own shares and bonds |
|
|
|
|
A.13. Extraordinary charges |
124,00 |
|
458,00 |
|
A.14.Other exercises’ expenses and losses |
|
|
|
|
A.IV.POSITIVE EXTRAORDINARY RESULT
(B.9+B.10+B.11+B.12+B.13-A.10-A.11-A.12-A.13-A.14) |
|
|
|
|
A.V.PROFIT BEFORE TAXES
(A.III+A.IV-B.III-B.IV) |
2.240.994,00 |
2.398.910,00 |
2.505.197,00 |
|
A.15.Corporate Taxes |
782.578,00 |
839.618,00 |
852.523,00 |
|
A.16. Other taxes |
|
|
|
|
A.VI.EXERCISE RESULT (PROFIT)
(A.V-A.14-A.15) |
1.458.416,00 |
1.559.292,00 |
1.652.674,00 |
|
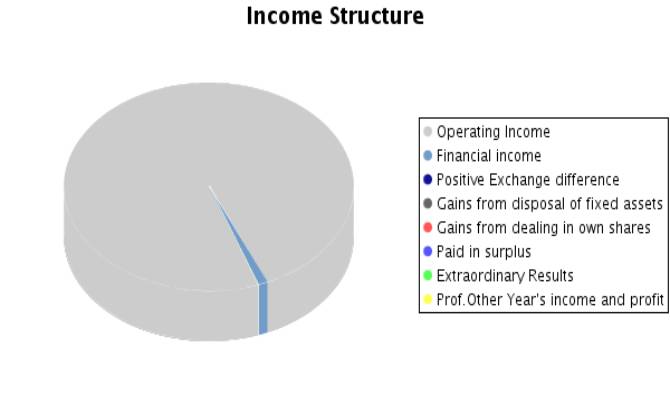
B) INCOMES (B.1 a B13) |
16.835.947,00 |
18.313.645,00 |
21.536.358,00 |
|
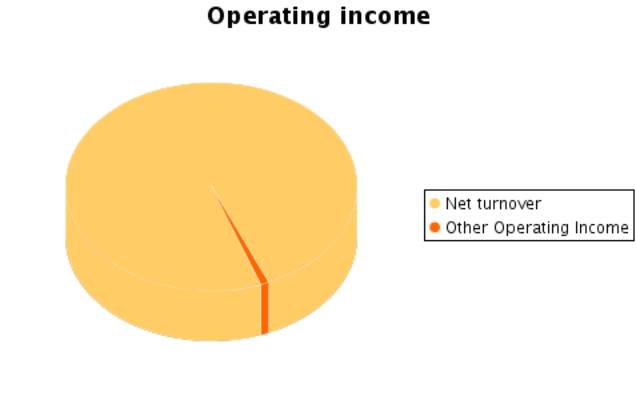
B.1. Turnover |
16.636.634,00 |
17.916.483,00 |
20.481.863,00 |
|
Sales |
16.636.634,00 |
17.916.483,00 |
20.481.863,00 |
|
Services provided |
|
|
|
|
Refunds and sale reminders |
|
|
|
|
B.2.Increase in inventory of finished goods
and works in progress |
|
183.706,00 |
642.786,00 |
|
B.3.Expenses capitalized |
|
|
|
|
B.4. Other operating income |
177.150,00 |
179.475,00 |
175.095,00 |
|
Other incomes |
177.150,00 |
179.475,00 |
175.095,00 |
|
Grants |
|
|
|
|
Excess in provision for liabilities and charges |
|
|
|
|
B.I.OPERATING LOSSES
(A.1+A.2+A.3+A.4+A.5+A.6-B.1-B.2-B.3-B.4) |
|
|
|
|
B.5.Incomes from share participations |
|
|
|
|
From affiliated companies |
|
|
|
|
From associated companies |
|
|
|
|
From other companies |
|
|
|
|
B.6.Income from other securities and credits
to fixed assets |
|
|
|
|
From affiliated companies |
|
|
|
|
From associated companies |
|
|
|
|
Other companies |
|
|
|
|
B.7.Other interests and similar |
16.254,00 |
27.971,00 |
233.586,00 |
|
From affiliated companies |
|
|
|
|
From associated companies |
|
|
|
|
Other Interests |
16.254,00 |
27.971,00 |
233.586,00 |
|
Profits from investments |
|
|
|
|
B.8. Positive change difference |
|
|
|
|
B.II. NEGATIVE FINANCIAL RESULTS
(A.7+A.8+A.9-B.5-B.6-B.7-B.8) |
50.062,00 |
65.395,00 |
|
|
B.III.LOSSES FROM ORDINARY ACTIVITIES
(B.I+B.II-A.I-A.II) |
|
|
|
|
B.9.B.9. Gains from disposal of fixed assets |
|
|
|
|
B.10.Gains from dealing in own shares |
|
|
|
|
B.11. Paid in surplus |
|
|
|
|
B.12. Extraordinary income |
5.909,00 |
6.010,00 |
3.028,00 |
|
B.13.Other year’s income and profits |
|
|
|
|
B.IV.NEGATIVE EXTRAORDINARY LOSSES
(A.10+A.11+A.12+A.13+A.14-B.9-B.10-B.11-B.12-B.13) |
61.179,00 |
63.596,00 |
76.048,00 |
|
B.V.LOSS BEFORE TAXES
(B.III+B.IV-A.III-A.IV) |
|
|
|
|
B.VI.EXERCISE RESULTS (LOSS) (B.V+A.14+A.15) |
|
|
|
Composition of the
Profit and Loss Account
FINANCIAL BALANCE
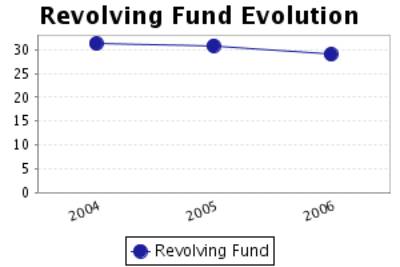
Here the Main Capital Amounts of the company and the Revolving Fund
Evolution are analysed.
Financial Balance Table
Figures given in €
|
|
31/12/2004 (12) |
% |
31/12/2005 (12) |
% |
31/12/2006 (12) |
% |
|
A) DUE FROM
SHAREHOLDERS FOR UNCALLED CAPITAL |
|
|
|
|
|
|
|
B) FIXED ASSETS |
3.215.436,00 |
37,67 |
4.258.739,00 |
37,44 |
5.400.928,00 |
38,96 |
|
C) DEFERRED
EXPENSES |
81.231,00 |
0,95 |
315.790,00 |
2,78 |
498.604,00 |
3,60 |
|
D) CURRENT
ASSETS |
5.238.418,00 |
61,38 |
6.799.084,00 |
59,78 |
7.964.007,00 |
57,45 |
|
ASSETS (A + B +
C + D) |
8.535.085,00 |
|
11.373.613,00 |
|
13.863.539,00 |
|
|
|
||||||
|
A) SHAREHOLDERS
EQUITY |
5.722.100,00 |
67,04 |
6.981.315,00 |
61,38 |
8.324.634,00 |
60,05 |
|
B) DEFERRED INCOME |
|
|
|
|
|
|
|
C) PROVISIONS
FOR LIABILITIES AND EXPENSES |
|
|
|
|
|
|
|
D) LONG TERM
LIABILITIES |
252.798,00 |
2,96 |
1.107.073,00 |
9,73 |
1.608.341,00 |
11,60 |
|
E) SHORT TERM
LIABILITIES |
2.560.187,00 |
30,00 |
3.285.225,00 |
28,88 |
3.930.564,00 |
28,35 |
|
F) SHORT TERM
PROVISIONS FOR LIABILITIES AND EXPENSES |
|
|
|
|
|
|
|
LIABILITIES (A +
B + C + D + E + F) |
8.535.085,00 |
|
11.373.613,00 |
|
13.863.539,00 |
|
Financial Balance
Composition
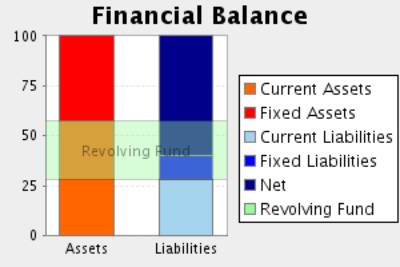
Comments on Financial Balance
In the 2004, the assets of the company were formed in 38,62% of Fixed
Assets and in 61,38% of Current Assets.This assets were financed in 67,04% with
own capitals, and in 2,96% with long term debt and in 30,00% with current
liabilities.
The result of this financial structure is a positive turnover fund of
2.678.231,00 Euros, which is equivalent to 31,38% proportion of the
company’s total assets.
In the 2005, the assets of the company were formed in 40,22% of Fixed
Assets and in 59,78% of Current Assets.This assets were financed in 61,38% with
own capitals, and in 9,73% with long term debt and in 28,88% with current
liabilities.
The result of this financial structure is a positive turnover fund of
3.513.859,00 Euros, which is equivalent to 30,89% proportion of the
company’s total assets.
This measure has increased with respect to the previous exercise in
31,20% having, however, diminished its proportion with respect to the total
assets of the company.
In the 2006, the assets of the company were formed in 42,55% of Fixed
Assets and in 57,45% of Current Assets.This assets were financed in 60,05% with
own capitals, and in 11,60% with long term debt and in 28,35% with current
liabilities.
The result of this financial structure is a positive turnover fund of
4.033.443,00 Euros, which is equivalent to 29,09% proportion of the
company’s total assets.
This measure has increased with respect to the previous exercise in
14,79% having, however, diminished its proportion with respect to the total
assets of the company.
RATIOS
Main Ratios
|
|
31/12/2004 (12) |
31/12/2005 (12) |
31/12/2006 (12) |
|
STRUCTURAL RATIOS |
|
|
|
|
Management fund |
2.678.231,00 |
3.513.859,00 |
4.033.443,00 |
|
Management Fund Requirement |
592.480,00 |
722.383,00 |
1.020.412,00 |
|
Indebtedness (%) |
32,96 |
38,62 |
39,95 |
|
External Funds on Net Worth |
0,49 |
0,63 |
0,66 |
|
GENERAL ACTIVITY RATIO |
|
|
|
|
Turnover Increase (%) |
5,28 |
7,69 |
14,32 |
|
Added value growth (%) |
25,80 |
12,37 |
11,59 |
|
Cash Flow |
1.952.850,00 |
2.109.973,00 |
2.346.879,00 |
|
Labour Productivity |
1,85 |
1,80 |
1,69 |
|
Assets turnover |
1,95 |
1,58 |
1,48 |
|
Breakdown Point |
12.818.991,96 |
14.003.265,05 |
16.745.136,76 |
|
Security Margin of the Breakdown Point (%) |
23,76 |
22,62 |
18,94 |
|
ACTIVITY RATIOS |
|
|
|
|
Average Payment Period |
59 |
61 |
87 |
|
Average Collection Period |
29 |
32 |
26 |
|
Inventory Turnover Period |
36 |
37 |
44 |
|
SOLVENCY RATIOS |
|
|
|
|
Payback Capacity |
0,69 |
0,48 |
0,42 |
|
Assets Guarantee |
3,00 |
2,52 |
2,41 |
|
Short Term Debts Proportion (%) |
91,01 |
74,80 |
70,96 |
|
Interest Coverage |
29,11 |
20,27 |
12,16 |
|
LIQUIDITY RATIOS |
|
|
|
|
Current Ratio |
2,05 |
2,07 |
2,03 |
|
Immediate liquidity |
0,88 |
1,02 |
1,02 |
|
Treasury |
2.085.751,00 |
2.791.476,00 |
3.013.031,00 |
|
Sales on Current Assets |
1.143 |
949 |
926 |
Results Analysis
Ratios
|
|
31/12/2004 (12) |
31/12/2005 (12) |
31/12/2006 (12) |
|
Economic profitability (%) |
27,56 |
22,23 |
17,80 |
|
Operating Profitability (%) |
14,14 |
14,11 |
12,05 |
|
Equity gearing |
1,46 |
1,59 |
1,74 |
|
Financial profitability (%) |
25,49 |
22,34 |
19,85 |
|
General Profitability (%) |
8,77 |
8,70 |
8,07 |
Comments on the
Results Analysis Ratios
The economic profitability in the year2005 achieved a 22,23% positive
level, due to a 14,11% economic margin and to an assets turnover of1,58%.
The economic profitability in the year has reduced from 27,56% up to
22,23% of2005, even if it remains positive. This fall is due to the decrease in
operating profitability, that has passe from 14,14% to 14,11%, as assets
turnover whose index has passed from 1,95 to 1,58%.
Financial profitability on 2005 achieved a 22,34%.
The company’s financial structure has instigated its economic
profitability with an indebtedness level of 1,59.
The general profitability on 2005 achieved a 8,70%.
The economic profitability in the year2006 achieved a 17,80% positive
level, due to a 12,05% economic margin and to an assets turnover of1,48%.
The economic profitability in the year has reduced from 22,23% up to
17,80% of2006, even if it remains positive. This fall is due to the decrease in
operating profitability, that has passe from 14,11% to 12,05%, as assets
turnover whose index has passed from 1,58 to 1,48%.
Financial profitability on 2006 achieved a 19,85%.
The company’s financial structure has instigated its economic
profitability with an indebtedness level of 1,74.
The general profitability on 2006 achieved a 8,07%.
SECTORIAL ANÁLYSIS
Large Capital Amounts and Financial Balance
Figures given in
%
|
|
COMPANY (2006) |
SECTOR |
DIFFERENCE |
DIFFERENCE RELATIVE |
|
|
|
|
|
|
ASSETS |
|
|
|
|
|
|
|
|
|
|
A) DUE FROM
SHAREHOLDERS FOR UNCALLED CAPITAL |
|
0,07 |
|
|
|
|
|
|
|
|
B) FIXED ASSETS |
38,96 |
20,07 |
18,89 |
94,08 |
|
|
|
|
|
|
C) DEFERRED
EXPENSES |
3,60 |
0,26 |
3,34 |
1.268,82 |
|
|
|
|
|
|
D) CURRENT
ASSETS |
57,45 |
79,59 |
-22,14 |
-27,82 |
|
|
|
|
|
|
ASSETS (A + B +
C + D) |
100 |
100 |
|
|
|
|
|
|
|
|
|
|
|
|
|
|
|
|
|
|
|
|
COMPANY (2006) |
SECTOR |
DIFFERENCE |
DIFFERENCE RELATIVE |
|
|
|
|
|
|
LIABILITIES |
|
|
|
|
|
|
|
|
|
|
A) SHAREHOLDERS
EQUITY |
60,05 |
38,48 |
21,57 |
56,04 |
|
|
|
|
|
|
B) DEFERRED
INCOME |
|
0,13 |
|
|
|
|
|
|
|
|
C) PROVISIONS
FOR LIABILITIES AND EXPENSES |
|
0,18 |
|
|
|
|
|
|
|
|
D) LONG TERM
LIABILITIES |
11,60 |
6,37 |
5,23 |
82,16 |
|
|
|
|
|
|
E) SHORT TERM
LIABILITIES |
28,35 |
54,83 |
-26,48 |
-48,30 |
|
|
|
|
|
|
F) SHORT TERM
PROVISIONS FOR LIABILITIES AND EXPENSES |
|
0,01 |
|
|
|
|
|
|
|
|
LIABILITIES (A + B + C + D + E + F) |
100 |
100 |
|
|
|
|
|
|
|
Sectorial Financial
Balance Comparison
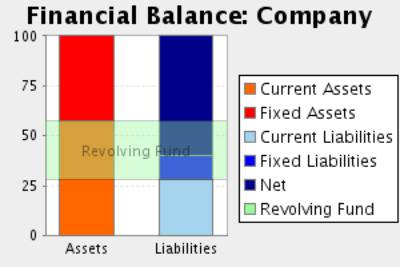
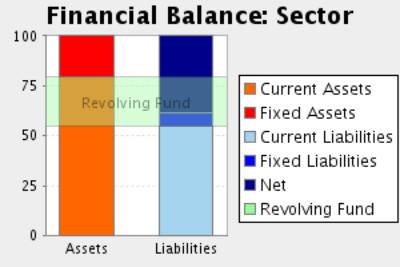
Comments to the Sectorial Analysis
In the 2006, the assets of the company were formed in 42,55% of fixed
assets and in 57,45Current Assets % In the sector, the proportion of fixed
assets was of 20,41%, 108,48% inferior, and the proportion of current assets
was of 79,59%, 27,82% superior.
The assets were financed in the company in 60,05% with own capitals , in
11,60% with fixed liabilities and in 28,35% with current liabilities In the
sector, the self financing represented 38,61%, 55,53% inferior. On the other
hand the long term debts represented in the sector an average of 6,55%
financing, with a relative difference of 77,07% in favour of the companyAnd,
short term liabilities represented in the sector an average of 54,84%
financing, with a relative difference of 48,30% favourable to the sector
The result of this company’s financial structure is a turnover fund that
represents 29,09% of the total assets; in the sector, this same proportion is
24,75%, therefore, we can say that the company’s turnover fund is 17,53% higher
than the one in of the sector.
Analytical Account of Results
Figures given in
%
|
|
COMPANY (2006) |
SECTOR |
DIFFERENCE |
DIFFERENCE RELATIVE |
|
Turnover |
99,15 |
98,43 |
0,72 |
0,73 |
|
Other operating income |
0,85 |
1,57 |
-0,72 |
-45,83 |
|
Production Value |
100,00 |
100,00 |
0,00 |
0,00 |
|
Operating expenses |
36,90 |
72,35 |
-35,45 |
-49,00 |
|
Other operation expenses |
25,56 |
12,53 |
13,03 |
103,94 |
|
Added value |
37,54 |
15,12 |
22,42 |
148,28 |
|
Labour cost |
22,23 |
8,98 |
13,25 |
147,63 |
|
Gross Economic Result |
15,31 |
6,14 |
9,17 |
149,19 |
|
Assets depreciation |
3,36 |
1,12 |
2,24 |
201,08 |
|
Variation in provision for current assets and bad debt losses |
|
0,28 |
|
|
|
Net Economic Result |
11,95 |
4,75 |
7,20 |
151,58 |
|
Financial income |
1,13 |
0,66 |
0,47 |
72,52 |
|
Financial Charges |
0,58 |
1,02 |
-0,44 |
-43,03 |
|
Variation in financial investment provision |
|
0,01 |
|
|
|
Ordinary Activities Result |
12,50 |
4,38 |
8,12 |
185,58 |
|
Extraordinary income |
0,01 |
0,42 |
-0,40 |
-97,59 |
|
Extraordinary charges |
0,38 |
0,25 |
0,13 |
49,61 |
|
Variation in provision in fixed assets |
|
0,03 |
|
|
|
Results before Taxes |
12,13 |
4,51 |
7,62 |
169,20 |
|
Corporate taxes |
4,13 |
1,42 |
2,72 |
191,87 |
|
Net Result |
8,00 |
3,09 |
4,91 |
158,90 |
|
Assets depreciation |
3,36 |
1,12 |
2,24 |
201,08 |
|
Change of Provisions |
|
0,32 |
|
|
|
Net Self-Financing |
11,36 |
4,53 |
6,83 |
150,94 |
Main Ratios
|
|
COMPANY (2006) |
PTILE25 |
PTILE50 |
PTILE75 |
|
STRUCTURAL RATIOS |
|
|
|
|
|
Management fund |
4.033.443,00 |
610,51 |
1.586,83 |
3.187,42 |
|
Management Fund
Requirement |
1.020.412,00 |
-1.491,45 |
-89,41 |
1.323,52 |
|
Indebtedness (%) |
39,95 |
47,21 |
65,48 |
80,34 |
|
External Funds
on Net Worth |
0,66 |
0,89 |
1,90 |
4,09 |
|
GENERAL ACTIVITY RATIO |
|
|
|
|
|
Turnover Increase (%) |
14,32 |
-3,56 |
4,33 |
12,92 |
|
Added value growth (%) |
11,59 |
-6,74 |
5,05 |
18,01 |
|
Cash Flow |
2.346.879,00 |
214,98 |
431,17 |
834,43 |
|
Labour Productivity |
1,69 |
1,31 |
1,64 |
2,14 |
|
Assets turnover |
1,48 |
1,28 |
1,68 |
2,18 |
|
Breakdown Point |
16.745.136,76 |
7.497.656,71 |
10.370.635,11 |
15.788.682,26 |
|
Security Margin of the Breakdown Point (%) |
18,94 |
7,18 |
15,84 |
25,64 |
|
ACTIVITY RATIOS |
|
|
|
|
|
Average Payment Period |
87 |
28 |
73 |
120 |
|
Average Collection Period |
26 |
63 |
97 |
135 |
|
Inventory Turnover Period |
44 |
25 |
46 |
71 |
|
SOLVENCY RATIOS |
|
|
|
|
|
Payback Capacity |
0,42 |
0,04 |
0,09 |
0,19 |
|
Assets Guarantee |
2,41 |
1,24 |
1,52 |
2,11 |
|
Short Term Debts Proportion (%) |
70,96 |
86,30 |
96,58 |
100,00 |
|
Interest Coverage |
12,16 |
1,21 |
4,22 |
11,65 |
|
LIQUIDITY RATIOS |
|
|
|
|
|
Current Ratio |
2,03 |
1,14 |
1,39 |
1,93 |
|
Immediate liquidity |
1,02 |
0,05 |
0,14 |
0,36 |
|
Treasury |
3.013.031,00 |
-1.320,43 |
39,57 |
793,71 |
|
Sales on Current Assets |
926 |
581 |
729 |
992 |
Results Analysis
Ratios
|
|
COMPANY (2006) |
PTILE25 |
PTILE50 |
PTILE75 |
|
Economic profitability (%) |
17,80 |
2,70 |
5,55 |
10,54 |
|
Operating Profitability (%) |
12,05 |
1,44 |
3,51 |
6,25 |
|
Equity gearing |
1,74 |
1,56 |
2,34 |
3,90 |
|
Financial profitability (%) |
19,85 |
5,41 |
11,40 |
20,75 |
|
General Profitability (%) |
8,07 |
0,79 |
2,08 |
4,25 |
FOREIGN EXCHANGE
RATES
|
Currency |
Unit
|
Indian Rupees |
|
US Dollar |
1 |
Rs.43.58 |
|
UK Pound |
1 |
Rs81.43. |
|
Euro |
1 |
Rs.64.52 |
RATING
EXPLANATIONS
|
RATING |
STATUS |
PROPOSED CREDIT LINE |
|
|
>86 |
Aaa |
Possesses an extremely sound financial base with the strongest
capability for timely payment of interest and principal sums |
Unlimited |
|
71-85 |
Aa |
Possesses adequate working capital. No caution needed for credit
transaction. It has above average (strong) capability for payment of interest
and principal sums |
Large |
|
56-70 |
A |
Financial & operational base are regarded healthy. General unfavourable
factors will not cause fatal effect. Satisfactory capability for payment of
interest and principal sums |
Fairly Large |
|
41-55 |
Ba |
Overall operation is considered normal. Capable to meet normal
commitments. |
Satisfactory |
|
26-40 |
B |
Unfavourable & favourable factors carry similar weight in credit
consideration. Capability to overcome financial difficulties seems
comparatively below average. |
Small |
|
11-25 |
Ca |
Adverse factors are apparent. Repayment of interest and principal sums
in default or expected to be in default upon maturity |
Limited with
full security |
|
<10 |
C |
Absolute credit risk exists. Caution needed to be exercised |
Credit not
recommended |
|
NR |
In view of the lack of information, we have no basis upon which to
recommend credit dealings |
No Rating |
|
This score serves as a reference to assess SC’s credit risk
and to set the amount of credit to be extended. It is calculated from a composite
of weighted scores obtained from each of the major sections of this report. The
assessed factors and their relative weights (as indicated through %) are as
follows:
Financial
condition (40%) Ownership
background (20%) Payment
record (10%)
Credit history
(10%) Market trend
(10%) Operational
size (10%)