![]()
MIRA
INFORM REPORT
|
Report Date : |
25.08.2008 |
IDENTIFICATION
DETAILS
|
Name : |
ROMETA SA |
|
|
|
|
Registered Office : |
|
|
|
|
|
Country : |
Spain |
|
|
|
|
Financials (as on) : |
31.12.2006 |
|
|
|
|
Date of Incorporation : |
|
|
|
|
|
Legal Form : |
Joint Stock Company |
|
|
|
|
Line of Business : |
Manufacturer of Machinery |
RATING &
COMMENTS
|
MIRA’s Rating : |
Ba |
|
RATING |
STATUS |
PROPOSED CREDIT LINE |
|
|
41-55 |
Ba |
Overall operation is considered normal. Capable to meet normal
commitments. |
Satisfactory |
|
Maximum Credit Limit : |
49.998,20 € |
|
|
|
|
Status : |
Satisfactory |
|
|
|
|
Payment Behaviour : |
Regular |
|
|
|
|
Litigation : |
Clear |
FINANCIAL REPORT
ROMETA SA
TAX NUMBER: A58110131
EXECUTIVE SUMMARY
Identification
Current Business Name: ROMETA SA
Other names: NO
Current Address: RONDA CONQUES,
21 - 23, CP 08180, MOIA BARCELONA
Telephone number: 938208181 Fax: 938208213
URL: www.rometa.es Corporate e-mail:
rometa@rometa.es
Commercial Risk
Credit Appraisal: 49.998,20 €
RAI: NO
Legal Actions: NO
Financial Information
Latest sales known (2007): 1.800.000,00 € (Estimated)
Latest Balance sheet sales (2006): 909.321,25 € (MERCANTILE REGISTER)
Result: -92.244,24 €
Total Assets:
1.429.709,77 €
Social Capital: 60.110,00 €
Employees: 15
Commercial Information
Constitution Date: 30/12/1985
Business activity: Mfg. of
machinery nec.
NACE Code: 2924
International Operations: Exports
Corporate Structure
Sole Administrator:
Parent Company:
Other Complementary Information
Latest proceeding published in BORME: 04/01/2008 Registration
of accounts
Latest press article: 01/05/2002 ESTRATEGIA
EMPRESARIAL (GENERAL INFORMATION)
Bank Entities: Yes
Credit Appraisal
Maximum Credit
(from 0 a 6,000,000 €)
Favourable to 49.998,20 €
Rating Evolution
Financial Situation
Fiscal year2006
|
Treasury |
Excellent |
|
Indebtedness |
Weak |
|
Profitability |
Very Negative |
|
Balance |
Excellent |
Performance
|
Legal Actions |
None or Negligible |
|
Business
Trajectory |
Excellent |
RAI 
COMPANY NOT REGISTERED IN THE R.A.I.
This company is not registered in the Disputed Bills register (R.A.I.)
DATE AND TIME OF THE CONSULTATION: 13/08/2008
08:08:25
INCIDENTS

Summary
LEGAL ACTIONS: No legal incidences registered
CLAIM FILED AGAINST THE ADMINISTRATION: No administrative
claims registered
AFFECTED BY: No significant element.
FINANCIAL ELEMENTS AND SECTORIAL
COMPARATIVE
FINANCIAL ELEMENTS
Figures given in €
|
|
2005 (12) |
2006 (12) |
2007 |
|
|
|
|
|
BALANCE SHEET
ANALYSIS |
|
|
|
|
|
|
|
|
OWN FUNDS |
685.783,08 |
593.538,84 |
|
|
|
|
|
|
DEBT |
801.670,34 |
836.170,93 |
|
|
|
|
|
|
FIXED ASSETS |
144.257,83 |
127.155,95 |
|
|
|
|
|
|
TOTAL ASSETS |
1.487.453,42 |
1.429.709,77 |
|
|
|
|
|
|
|
|
|
|
|
|
|
|
|
|
2005 (12) |
2006 (12) |
2007 |
|
|
|
|
|
PROFIT AND LOSS
ACCOUNT ANALYSIS |
|
|
|
|
|
|
|
|
SALES |
1.750.465,28 |
909.321,25 |
1.800.000,00 |
|
|
|
|
|
ADDED VALUE |
663.573,58 |
462.016,10 |
|
|
|
|
|
|
EBITDA |
67.319,09 |
-44.273,22 |
|
|
|
|
|
|
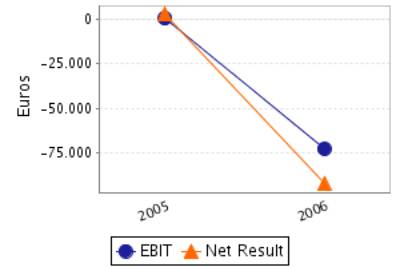
EBIT |
378,91 |
-72.607,97 |
|
|
|
|
|
|
NET RESULT |
2.999,10 |
-92.244,24 |
|
|
|
|
|
Balance Sheets Items
Analysis
Balance Sheet Comments
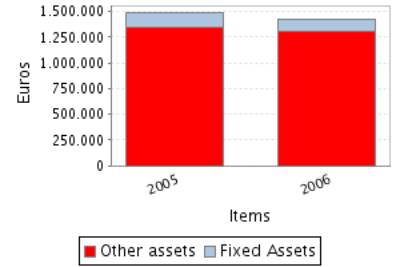
Total assets of the company decreased in 3,88% between 2005 and 2006.
This decrease has been greater in the fixed assets that reduced in
-11,86%.
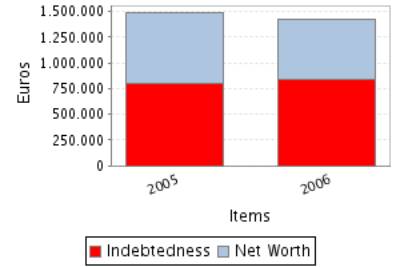
This assets reduction has meant a net worth decrease of 13,45%.
Nevertheless, indebtedness has experienced a growth of 4,30%.
Profit and Loss Account Analysis
Profit and Loss Account Comments
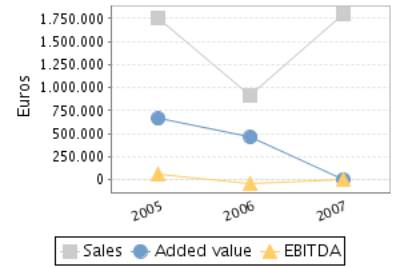
The company’s sales figure decreased in 48,05% between 2005 and 2006.
The company’s EBIT decreased in 19.262,33% between 2005 and 2006.
This evolution implies a reduction in the company’s operating
profitability.
The result of these variations is a decrease of the company’s Economic
Profitability of 20.015,69% in the analysed period, being this profitability of
-5,08% in the year 2006.
The company’s Net Result decreased in 3.175,73% between 2005 and 2006.
This evolution, compared to the EBIT’s performance, implies that the financial
and extraordinary activities have had a positive effect in the company’s
Financial Profitability.
The result of these variations is a reduction of the company’s
profitability of 3.653,94% in the analysed period, being equal to -15,54% in
the year 2006.
ANNUAL FINANCIAL REPORT ADDITIONAL DATA
Source: annual financial report 2006
Results Distribution
Figures given in €
|
DISTRIBUTION
BASE |
DISTRIBUTION TO |
||
|
Profit and Loss |
-92.244,24 |
Retained earnings |
0,00 |
|
Carry Over |
0,00 |
Voluntary Reserve |
0,00 |
|
Voluntary reserves |
0,00 |
Prior years losses |
-92.244,24 |
|
Reserves |
0,00 |
Carry Over |
0,00 |
|
Other concepts |
0,00 |
Other funds |
0,00 |
|
Total of Amounts to be distributed |
-92.244,24 |
Dividends |
0,00 |
|
|
|
Other Applications |
0,00 |
COMPARATIVE SECTOR
ANALYSIS
Values table
Figures expressed in %
|
|
COMPANY (2006) |
SECTOR |
DIFFERENCE |
DIFFERENCE RELATIVE |
|
|
|
|
|
|
BALANCE SHEET
ANALYSIS: % on the total assets |
|
|
|
|
|
|
|
|
|
|
OWN FUNDS |
41,51 |
42,44 |
-0,92 |
-2,17 |
|
|
|
|
|
|
DEBT |
58,49 |
57,56 |
0,92 |
1,60 |
|
|
|
|
|
|
FIXED ASSETS |
8,89 |
32,30 |
-23,40 |
-72,46 |
|
|
|
|
|
|
|
|
|
|
|
|
|
|
|
|
|
|
COMPANY (2006) |
SECTOR |
DIFFERENCE |
DIFFERENCE RELATIVE |
|
|
|
|
|
|
PROFIT AND LOSS
ACCOUNT ANALYSIS: % on the total operating income |
|
|
|
|
|
|
|
|
|
|
SALES |
65,56 |
99,14 |
-33,58 |
-33,87 |
|
|
|
|
|
|
ADDED VALUE |
33,31 |
41,93 |
-8,62 |
-20,57 |
|
|
|
|
|
|
EBIT |
-5,23 |
4,59 |
-9,82 |
-214,07 |
|
|
|
|
|
|
NET RESULT |
-6,65 |
2,66 |
-9,31 |
-350,11 |
|
|
|
|
|
Sector Composition
Compared sector (NACE): 292
Number of companies: 489
Size (Sales Figure) : 0 - 2.800.000,00 Euros
Comments on the sectorial comparative
Compared to its sector the assets of the companies show an inferior
proportion of fixed assets. Specifically the difference with the sector average
is -23,40% , which means a relative difference of -72,46% .
In liabilities composition the company appeals on a wider scale to self
financing, being the proportion of net worth of 0,92% inferior, which means a
relative difference of 2,17% 0,92% more than the sector, which means a
difference of 1,60% .
The proportion that the sales mean to the company’s total ordinary
income is 65,56%, 33,58% lower than in the sector, which means a relative
difference of 33,87% .
The company’s EBIT was negative and equal to-5,23% with regard to the
total ordinary income, 9,82% less than the sector, which means a relative
difference of 214,07% .
The company’s capacity to generate operating income is equal to that of
the sector as its ratio EBIT/Sales is also equal.
The company’s net result was negative and equal to -6,65% with regard to
the total ordinary income, 9,31% less than the sector, which means a relative
difference of 350,11% .
ADDRESSES
Current Legal Seat Address:
RONDA CONQUES, 21 - 23
08180 MOIA BARCELONA
Previous Seat Address:
STREET ROSSELLO, 186
08008
BARCELONA
Characteristics of the current address
Type of premises: office, factory
Property: owned; with no official confirmation
Local Situation: secondary
CORPORATE STRUCTURE
ADMINISTRATIVE LINKS
Main Board members, Directors and Auditor ![]()
|
POSITION |
SURNAMES AND
NAME |
APPOINTMENT DATE |
|
SOLE ADMINISTRATOR |
CANALS PALAU JOSEP |
13/09/2006 |
Functional Managers
|
POSITION |
SURNAMES AND
NAME |
|
General Manager |
CANALS PALAU JOSEP |
|
Financial Manager |
CANALS I PALAU JOSEP |
|
Commercial Manager |
CANALS I PALAU JOSEP |
FINANCIAL LINKS
|
|
BUSINESS NAME |
CIF / COUNTRY |
% |
SOURCE |
DATA INF. |
|
|
CANALS PALAU JOSEP |
|
100,00 |
OWN SOURCES |
22/08/2008 |
CREDIT INFORMATION
Constitution Date: 30/12/1985
Foundation Date: 01/01/1985
Business activity 
Activity: Mfg. of machinery nec.
NACE Code: 2924
NACE Activity: Manufacture of other general purpose machinery
n.e.c.
Business: FABRICACION DE MAQUINARIA.
Activity description: FABRICACION DE MAQUINARIA PARA LA INDUSTRIA
DEL PREFABRICADO DE HORMIGON
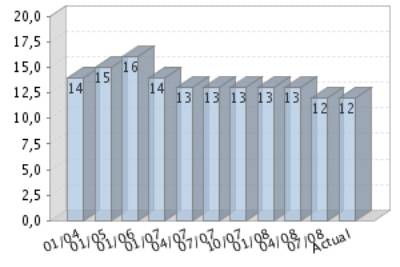
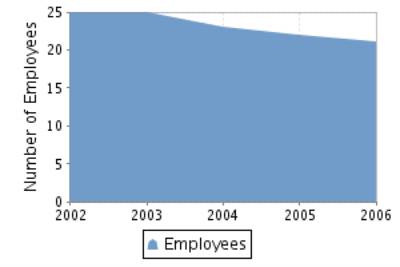
Employees 
Number of total employees: 15 (2008)
Number of fixed employees: 100,00%
Number of temporary employees: 0,00%
Employees evolution
COMMERCIAL OPERATIONS 
SALES
Collection (estimated):
On a credit basis: 100%
Export Percentage: 80%
Exports to: BRASIL INDIA
National Distribution: 20%
Banks 
|
ENTITY |
BRANCH |
ADDRESS |
TOWN OR CITY |
PROVINCE |
|
BANCO DE SABADELL, S.A. |
0003 |
RB DE SANT ESTEVE 000043 |
RIPOLLET |
Barcelona |
|
BANCO SANTANDER, S.A. |
0649 |
RB SANT JORDI 72 APDO. 00024 |
RIPOLLET |
Barcelona |
|
CAIXA D’ESTALVIS DEL PENEDES |
0169 |
RAMBLA SANT JORDI, 1 |
RIPOLLET |
Barcelona |
3 bank entities registered
LEGAL STRUCTURE
Constitution Data
Register Date: 30/12/1985
Current Legal Form: JOINT STOCK COMPANY
Current Capital: 60.110,00 €
Legal Aspects
Obligation to fill in Financial Statements: YES
Chamber census: YES (2006)
Listed on a Stock Exchange: NO
B.O.R.M.E.(Official Companies
Registry Gazette) 
Registered Proceedings
|
PROCEEDINGS |
DATE |
NOTICE NUM. |
TRADE REG. |
|
Resignations |
13/09/2006 |
447409 |
Barcelona |
|
Appointments |
13/09/2006 |
447409 |
Barcelona |
|
Change of statutes |
13/09/2006 |
447409 |
Barcelona |
Other Proceedings published
|
PROCEEDINGS |
DATE |
NOTICE NUM. |
TRADE REG. |
|
Registration of accounts (2006) Individual |
04/01/2008 |
7298 |
Barcelona |
|
Registration of accounts (2005) Individual |
28/09/2006 |
592470 |
Barcelona |
Press articles

01/05/2002 ESTRATEGIA EMPRESARIAL (GENERAL INFORMATION)
ROMETA EQUIPARA DOS PLANTAS DE PRODUCCION DE BLOQUES DE HORMIGON PREFABRICADO
EN LAS PROVINCIAS DE SHANDON Y HEBEI (CHINA) POR LAS QUE FACTURARA 2,8 MM DE
EUROS. LAS PLANTAS, DE 1,1 Y 1,7 MM. DE EUROS, SE COMPONEN DE MEZCLADORAS DE
MORTEROS, MAQUINARIA DE PRENSADO EN MOLDES DE LOS PREFABRICADOS Y BANDEJAS DE
SECADO Y TRANSPORTE DE BLOQUES.
FINANCIAL INFORMATION
The information on the last account contained in this report is
extracted from the Mercantile Register file of the legal address of the Company
and dated 12/12/2007.
BALANCE SHEET
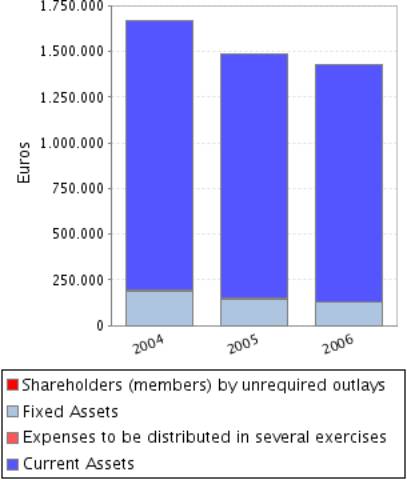
Assets
Figures given in €
|
|
31/12/2004 (12) |
31/12/2005 (12) |
31/12/2006 (12) |
|
A) DUE FROM SHAREHOLDERS FOR UNCALLED CAPITAL |
|
|
|
|
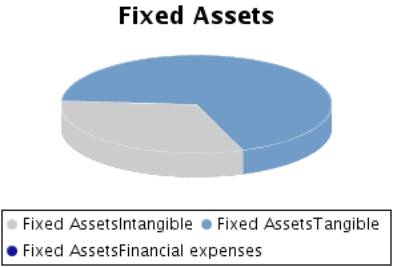
B) FIXED ASSETS |
188.767,67 |
144.257,83 |
127.155,95 |
|
I. Incorporation costs |
|
|
|
|
II. Intangible fixed assets |
103.280,42 |
89.057,91 |
40.315,74 |
|
III. Tangible fixed assets |
73.380,13 |
53.092,80 |
86.840,21 |
|
IV. Financial fixed assets |
12.107,12 |
2.107,12 |
|
|
V.Owners equity |
|
|
|
|
VI.Long term trade liabilities |
|
|
|
|
C) DEFERRED EXPENSES |
5.935,51 |
3.405,89 |
1.694,03 |
|
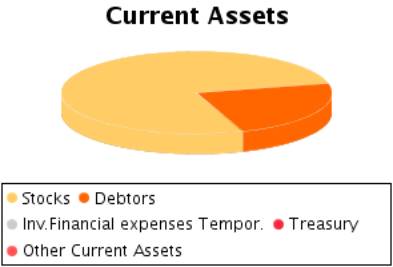
D) CURRENT ASSETS |
1.473.953,43 |
1.339.789,70 |
1.300.859,79 |
|
I. Shareholders by required outlays |
|
|
|
|
II. Stocks |
357.866,98 |
531.587,25 |
999.652,00 |
|
III. Debtors |
1.116.086,45 |
808.202,45 |
301.207,79 |
|
IV. Temporary financial investment |
|
|
|
|
V. Short-term own shares |
|
|
|
|
VI. Treasury |
|
|
|
|
VII. Periodification adjustments |
|
|
|
|
ASSETS (A + B + C + D) |
1.668.656,61 |
1.487.453,42 |
1.429.709,77 |
Assets composition
Liabilities
Figures given in €
|
|
31/12/2004 (12) |
31/12/2005 (12) |
31/12/2006 (12) |
|
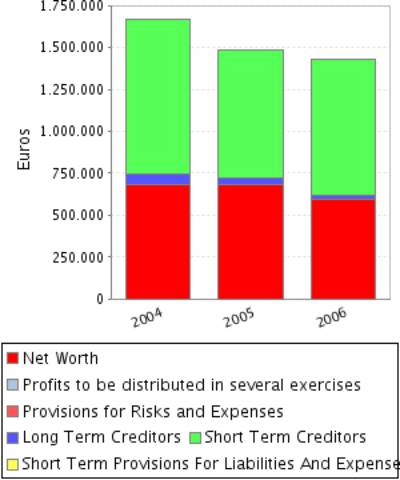
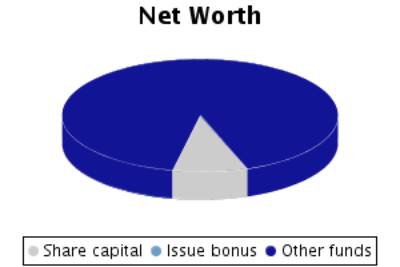
A) SHAREHOLDERS EQUITY |
682.783,98 |
685.783,08 |
593.538,84 |
|
I. Share capital |
60.110,00 |
60.110,00 |
60.110,00 |
|
II. Issue bonus |
|
|
|
|
III.Revaluation reserve |
|
|
|
|
IV.Reserves |
573.990,82 |
622.673,98 |
625.673,08 |
|
Capital adjustments in Euros |
|
|
|
|
Sundry reserves |
573.990,82 |
622.673,98 |
625.673,08 |
|
V.Results from previous years |
|
|
|
|
VI.Profit and Losses |
48.683,16 |
2.999,10 |
-92.244,24 |
|
VII.Dividend paid during the year |
|
|
|
|
VIII.Own shares for capital reduction |
|
|
|
|
B) DEFERRED INCOME |
|
|
|
|
C) PROVISIONS FOR LIABILITIES AND EXPENSES |
|
|
|
|
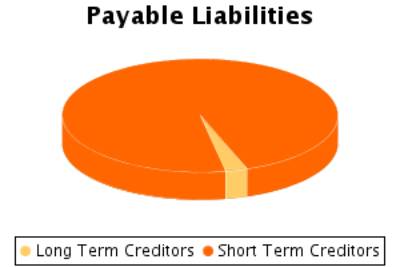
D) LONG TERM LIABILITIES |
64.271,18 |
39.482,29 |
21.832,19 |
|
E) SHORT TERM LIABILITIES |
921.601,45 |
762.188,05 |
814.338,74 |
|
F) SHORT TERM PROVISIONS FOR LIABILITIES AND
EXPENSES |
|
|
|
|
LIABILITIES (A + B + C + D + E + F) |
1.668.656,61 |
1.487.453,42 |
1.429.709,77 |
Liabilities
Composition
PROFIT AND LOSS ACCOUNT
Itams of the Profit and Loss Account
Figures given in €
|
|
31/12/2004 (12) |
31/12/2005 (12) |
31/12/2006 (12) |
|
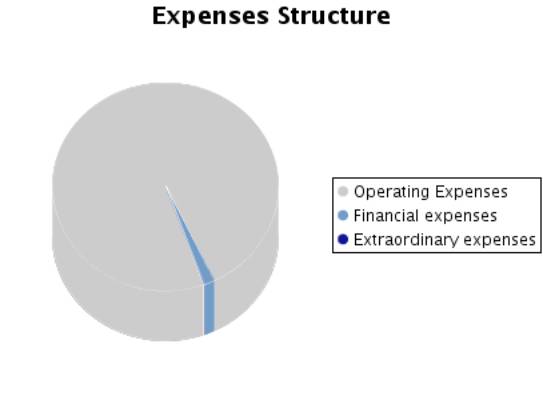
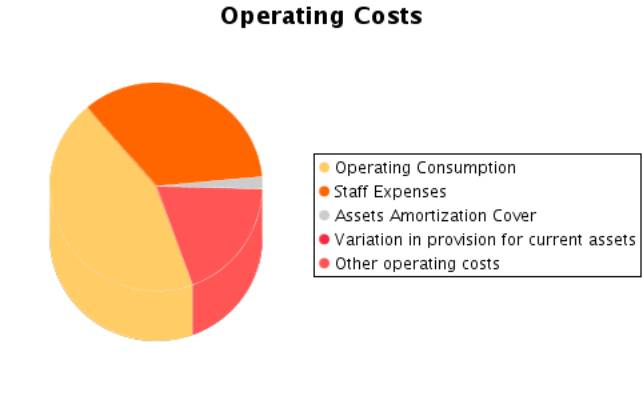
A) EXPENSES (A.1 a A.15) |
2.183.916,41 |
1.763.870,51 |
1.482.654,79 |
|
A.1.Operating costs |
1.145.745,41 |
748.705,60 |
647.071,56 |
|
A.2. Labour cost |
562.840,98 |
596.254,49 |
506.289,32 |
|
Wages |
447.311,96 |
478.854,04 |
406.807,33 |
|
Social security expenses |
115.529,02 |
117.400,45 |
99.481,99 |
|
A.3. Assets depreciation |
30.177,08 |
36.195,84 |
28.334,75 |
|
A.4. Variation in provision for current assets |
5.587,99 |
30.744,34 |
|
|
A.5. Other operating costs |
415.643,91 |
338.186,10 |
277.938,36 |
|
A.I. OPERATING RESULT (B.1-A.1-A.2-A.3-A.4-A.5) |
71.757,05 |
378,91 |
|
|
A.6.Financial expenses and similar |
8.107,62 |
14.867,10 |
23.067,16 |
|
Debts with related companies |
|
|
21.278,69 |
|
Debts with associated companies |
|
|
|
|
Other companies debts By debts with third parties and similar expenses |
8.107,62 |
14.867,10 |
1.788,47 |
|
Losses from financial investments |
|
|
|
|
A.7. Variation in financial investment provision |
|
|
|
|
A.8.Negative exchange difference |
152,35 |
|
|
|
A.II.POSITIVE FINANCIAL RESULTS
(B.2+B.3-A.6-A.7-A.8) |
|
|
|
|
A.III.PROFIT FROM ORDINARY ACTIVITIES
(A.I+A.II-B.I-B.II) |
63.970,66 |
|
|
|
A.9. Variation in provision in fixed assets |
|
|
|
|
A.10. Losses in fixed assets |
|
|
|
|
A.11. Losses from own shares and bonds |
|
|
|
|
A.12. Extraordinary charges |
|
|
986,00 |
|
A.13.Other exercises’ expenses and losses |
|
|
|
|
A.IV.POSITIVE EXTRAORDINARY RESULT
(B.4+B.5+B.6+B.7+B.8-A.9-A.10-A.11-A.12-A.13) |
373,57 |
16.099,41 |
1.810,72 |
|
A.V.PROFIT BEFORE TAXES (A.III+A.IV-B.III-B.IV) |
64.344,23 |
1.916,14 |
|
|
A.14.Corporate Taxes |
15.661,07 |
-1.082,96 |
-1.032,36 |
|
A.15. Other taxes |
|
|
|
|
A.VI.EXERCISE RESULT (PROFIT) (A.V-A.14-A.15) |
48.683,16 |
2.999,10 |
|
|
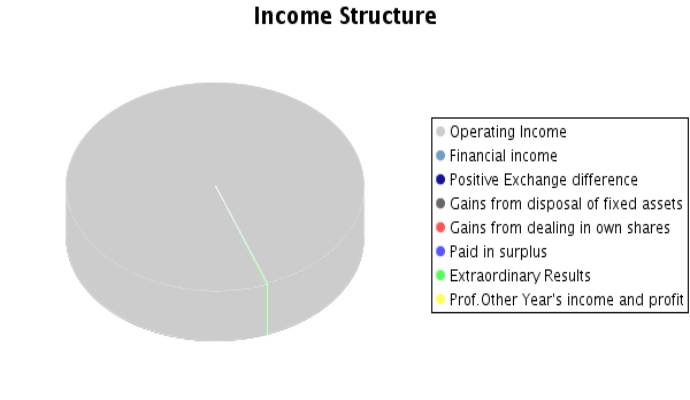
B) INCOMES (B.1 a B.8) |
2.232.599,57 |
1.766.869,61 |
1.390.410,55 |
|
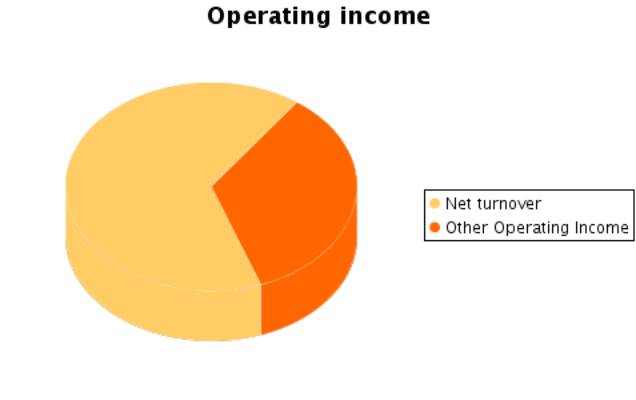
B.1.Operating income |
2.231.752,42 |
1.750.465,28 |
1.387.026,02 |
|
Turnover |
2.226.905,21 |
1.750.465,28 |
909.321,25 |
|
Other operating income |
4.847,21 |
|
477.704,77 |
|
B.I.OPERATING LOSSES (A.1+A.2+A.3+A.4+A.5-B.1) |
|
|
72.607,97 |
|
B.2.Financial Income |
64,93 |
304,92 |
587,81 |
|
From affiliated companies |
|
|
587,81 |
|
From associated companies |
|
|
|
|
Other |
64,93 |
304,92 |
|
|
Gains from investments |
|
|
|
|
B.3. Positive change difference |
408,65 |
|
|
|
B.II. NEGATIVE FINANCIAL RESULTS
(A.6+A.7+A.8-B.2-B.3) |
7.786,39 |
14.562,18 |
22.479,35 |
|
B.III.LOSSES FROM ORDINARY ACTIVITIES
(B.I+B.II-A.I-A.II) |
|
14.183,27 |
95.087,32 |
|
B.4.B.9. Gains from disposal of fixed assets |
|
|
|
|
B.5.Gains from dealing in own shares |
|
|
|
|
B.6. Paid in surplus |
55,88 |
|
401,70 |
|
B.7. Extraordinary income |
317,69 |
16.099,41 |
2.395,02 |
|
B.8.Other year’s income and profits |
|
|
|
|
B.IV.NEGATIVE EXTRAORDINARY LOSSES
(A.9+A.10+A.11+A.12+A.13-B.4-B.5-B.6-B.7-B.8) |
|
|
|
|
B.V.LOSS BEFORE TAXES (B.III+B.IV-A.III-A.IV) |
|
|
93.276,60 |
|
B.VI.EXERCISE RESULTS (LOSS) (B.V+A.14+A.15) |
|
|
92.244,24 |
Composition of the
Profit and Loss Account
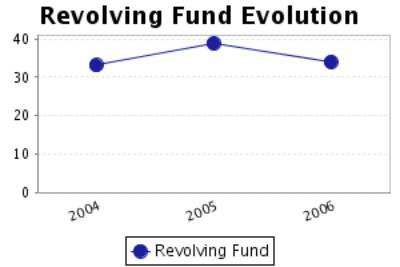
FINANCIAL BALANCE
Here the Main Capital Amounts of the company and the Revolving
Fund Evolution are analysed.
Financial Balance Table
Figures given in €
|
|
31/12/2004 (12) |
% |
31/12/2005 (12) |
% |
31/12/2006 (12) |
% |
|
A) DUE FROM
SHAREHOLDERS FOR UNCALLED CAPITAL |
|
|
|
|
|
|
|
B) FIXED ASSETS |
188.767,67 |
11,31 |
144.257,83 |
9,70 |
127.155,95 |
8,89 |
|
C) DEFERRED
EXPENSES |
5.935,51 |
0,36 |
3.405,89 |
0,23 |
1.694,03 |
0,12 |
|
D) CURRENT
ASSETS |
1.473.953,43 |
88,33 |
1.339.789,70 |
90,07 |
1.300.859,79 |
90,99 |
|
ASSETS (A + B +
C + D) |
1.668.656,61 |
|
1.487.453,42 |
|
1.429.709,77 |
|
|
|
||||||
|
A) SHAREHOLDERS
EQUITY |
682.783,98 |
40,92 |
685.783,08 |
46,10 |
593.538,84 |
41,51 |
|
B) DEFERRED
INCOME |
|
|
|
|
|
|
|
C) PROVISIONS
FOR LIABILITIES AND EXPENSES |
|
|
|
|
|
|
|
D) LONG TERM
LIABILITIES |
64.271,18 |
3,85 |
39.482,29 |
2,65 |
21.832,19 |
1,53 |
|
E) SHORT TERM LIABILITIES |
921.601,45 |
55,23 |
762.188,05 |
51,24 |
814.338,74 |
56,96 |
|
F) SHORT TERM
PROVISIONS FOR LIABILITIES AND EXPENSES |
|
|
|
|
|
|
|
LIABILITIES (A +
B + C + D + E + F) |
1.668.656,61 |
|
1.487.453,42 |
|
1.429.709,77 |
|
Financial Balance
Composition
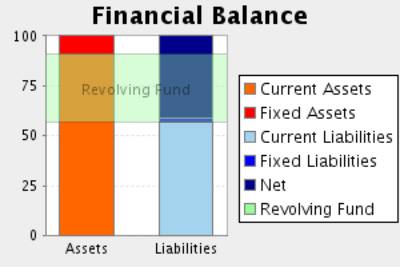
Comments on Financial Balance
In the 2004, the assets of the company were formed in 11,67% of Fixed
Assets and in 88,33% of Current Assets.This assets were financed in 40,92% with
own capitals, and in 3,85% with long term debt and in 55,23% with current
liabilities.
The result of this financial structure is a positive turnover fund of
552.351,98 Euros, which is equivalent to 33,10% proportion of the
company’s total assets.
In the 2005, the assets of the company were formed in 9,93% of Fixed
Assets and in 90,07% of Current Assets.This assets were financed in 46,10% with
own capitals, and in 2,65% with long term debt and in 51,24% with current
liabilities.
The result of this financial structure is a positive turnover fund of
577.601,65 Euros, which is equivalent to 38,83% proportion of the
company’s total assets.
This measure has increased with respect to the previous exercise in
4,57% having also increased its proportion with respect to the total assets of
the company.
In the 2006, the assets of the company were formed in 9,01% of Fixed Assets
and in 90,99% of Current Assets.This assets were financed in 41,51% with own
capitals, and in 1,53% with long term debt and in 56,96% with current
liabilities.
The result of this financial structure is a positive turnover fund of
486.521,05 Euros, which is equivalent to 34,03% proportion of the
company’s total assets.
This measure has diminished with respect to the previous exercise in
15,77% having also diminished its proportion with respect to the total assets
of the company.
RATIOS
Main Ratios
|
|
31/12/2004 (12) |
31/12/2005 (12) |
31/12/2006 (12) |
|
STRUCTURAL RATIOS |
|
|
|
|
Management fund |
552.351,98 |
577.601,65 |
486.521,05 |
|
Indebtedness (%) |
59,08 |
53,90 |
58,48 |
|
External Funds on Net Worth |
1,44 |
1,17 |
1,41 |
|
GENERAL ACTIVITY RATIO |
|
|
|
|
Turnover Increase (%) |
56,72 |
-21,40 |
-48,05 |
|
Added value growth (%) |
4,58 |
-1,01 |
-30,38 |
|
Cash Flow |
84.448,23 |
69.939,28 |
-63.909,49 |
|
Labour Productivity |
1,19 |
1,11 |
0,91 |
|
Assets turnover |
1,34 |
1,18 |
0,64 |
|
Breakdown Point |
2.084.291,15 |
1.749.803,18 |
1.523.127,83 |
|
Security Margin of the Breakdown Point (%) |
6,61 |
0,04 |
-9,81 |
|
ACTIVITY RATIOS |
|
|
|
|
Average Collection Period |
180 |
166 |
119 |
|
Inventory Turnover Period |
58 |
109 |
396 |
|
SOLVENCY RATIOS |
|
|
|
|
Payback Capacity |
0,09 |
0,09 |
-0,08 |
|
Assets Guarantee |
1,69 |
1,85 |
1,71 |
|
Short Term Debts Proportion (%) |
93,48 |
95,08 |
97,39 |
|
Interest Coverage |
10,31 |
3,60 |
-2,92 |
|
LIQUIDITY RATIOS |
|
|
|
|
Current Ratio |
1,60 |
1,76 |
1,60 |
|
Sales on Current Assets |
544 |
470 |
252 |
Results Analysis
Ratios
|
|
31/12/2004 (12) |
31/12/2005 (12) |
31/12/2006 (12) |
|
Economic profitability (%) |
4,30 |
0,02 |
-5,08 |
|
Operating Profitability (%) |
3,22 |
0,02 |
-7,98 |
|
Equity gearing |
2,18 |
-81,19 |
3,16 |
|
Financial profitability (%) |
7,13 |
0,44 |
-15,54 |
|
General Profitability (%) |
2,19 |
0,17 |
-10,14 |
Comments on the
Results Analysis Ratios
The economic profitability in the year2005 achieved a 0,02% positive
level, due to a 0,02% economic margin and to an assets turnover of1,18%.
The economic profitability in the year has reduced from 4,30% up to 0,02%
of2005, even if it remains positive. This fall is due to the decrease in
operating profitability, that has passe from 3,22% to 0,02%, as assets turnover
whose index has passed from 1,34 to 1,18%.
Financial profitability on 2005 achieved a 0,44%.
The company’s financial structure has endangered its profitability with
an indebtedness level -81,19.
The general profitability on 2005 achieved a 0,17%.
The economic profitability in the year2006The economic profitability in
the year -5,08%, derived from a negative operating profitability of -7,98%.The
assets turnover was 0,64%.
The economic profitability in the year from a positive level of 0,02% to
its current negative level. This evolution is due to the obtaining of a
negative operating profitability of -7,98% in comparison with the current
positive value of 0,02%. Assets turnover has maintained stable in this period,
with an index of 0,64%.
Financial profitability on 2006The economic profitability in the year
-15,54
The company’s financial structure has restrained its financial
profitability with an indebtedness level of 3,16.
The general profitability on 2006The economic profitability in the year
-10,14
SECTORIAL ANÁLYSIS
Large Capital Amounts and Financial Balance
Figures given in %
|
|
COMPANY (2006) |
SECTOR |
DIFFERENCE |
DIFFERENCE RELATIVE |
|
|
|
|
|
|
ASSETS |
|
|
|
|
|
|
|
|
|
|
A) DUE FROM
SHAREHOLDERS FOR UNCALLED CAPITAL |
|
0,05 |
|
|
|
|
|
|
|
|
B) FIXED ASSETS |
8,89 |
32,30 |
-23,41 |
-72,47 |
|
|
|
|
|
|
C) DEFERRED
EXPENSES |
0,12 |
0,70 |
-0,58 |
-82,93 |
|
|
|
|
|
|
D) CURRENT ASSETS |
90,99 |
66,95 |
24,04 |
35,91 |
|
|
|
|
|
|
ASSETS (A + B + C + D) |
100 |
100 |
|
|
|
|
|
|
|
|
|
|
|
|
|
|
|
|
|
|
|
|
COMPANY (2006) |
SECTOR |
DIFFERENCE |
DIFFERENCE RELATIVE |
|
|
|
|
|
|
LIABILITIES |
|
|
|
|
|
|
|
|
|
|
A) SHAREHOLDERS
EQUITY |
41,51 |
42,11 |
-0,60 |
-1,42 |
|
|
|
|
|
|
B) DEFERRED
INCOME |
|
0,32 |
|
|
|
|
|
|
|
|
C) PROVISIONS FOR
LIABILITIES AND EXPENSES |
|
0,18 |
|
|
|
|
|
|
|
|
D) LONG TERM
LIABILITIES |
1,53 |
14,55 |
-13,02 |
-89,49 |
|
|
|
|
|
|
E) SHORT TERM
LIABILITIES |
56,96 |
42,82 |
14,14 |
33,03 |
|
|
|
|
|
|
F) SHORT TERM PROVISIONS
FOR LIABILITIES AND EXPENSES |
|
0,02 |
|
|
|
|
|
|
|
|
LIABILITIES (A +
B + C + D + E + F) |
100 |
100 |
|
|
|
|
|
|
|
Sectorial Financial
Balance Comparison
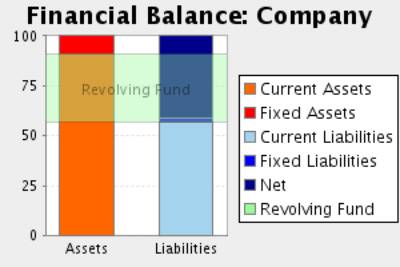
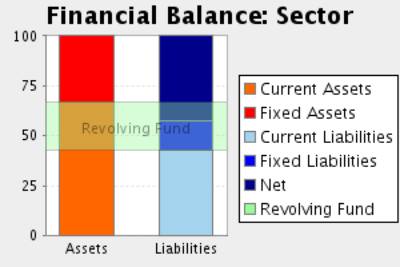
Comments to the Sectorial Analysis
In the 2006, the assets of the company were formed in 9,01% of fixed assets
and in 90,99Current Assets % In the sector, the proportion of fixed assets was
of 33,05%, 72,74% superior, and the proportion of current assets was of 66,95%,
35,91% inferior.
The assets were financed in the company in 41,51% with own capitals , in
1,53% with fixed liabilities and in 56,96% with current liabilities In the
sector, the self financing represented 42,44%, 2,18% superior. On the other
hand the long term debts represented in the sector an average of 14,73%
financing, with a relative difference of 89,61% favourable to the sectorAnd,
short term liabilities represented in the sector an average of 42,84%
financing, with a relative difference of 32,97% in favour of the company
The result of this company’s financial structure is a turnover fund that
represents 34,03% of the total assets; in the sector, this same proportion is
24,11%, therefore, we can say that the company’s turnover fund is 41,13% higher
than the one in of the sector.
Analytical Account of Results
Figures given in %
|
|
COMPANY (2006) |
SECTOR |
DIFFERENCE |
DIFFERENCE RELATIVE |
|
Turnover |
65,56 |
99,14 |
-33,58 |
-33,87 |
|
Other operating income |
34,44 |
0,86 |
33,58 |
3.909,31 |
|
Production Value |
100,00 |
100,00 |
0,00 |
0,00 |
|
Operating expenses |
46,65 |
43,86 |
2,79 |
6,36 |
|
Other operation expenses |
20,04 |
14,20 |
5,84 |
41,09 |
|
Added value |
33,31 |
41,93 |
-8,62 |
-20,57 |
|
Labour cost |
36,50 |
34,02 |
2,48 |
7,28 |
|
Gross Economic Result |
-3,19 |
7,91 |
-11,10 |
-140,32 |
|
Assets depreciation |
2,04 |
3,14 |
-1,10 |
-34,95 |
|
Variation in provision for current assets and bad debt losses |
|
0,19 |
|
|
|
Net Economic Result |
-5,23 |
4,59 |
-9,82 |
-213,97 |
|
Financial income |
0,04 |
0,27 |
-0,23 |
-85,02 |
|
Financial Charges |
1,66 |
1,32 |
0,34 |
25,66 |
|
Variation in financial investment provision |
|
-0,01 |
|
|
|
Ordinary
Activities Result |
-6,86 |
3,55 |
-10,41 |
-293,40 |
|
Extraordinary income |
0,20 |
0,64 |
-0,44 |
-68,90 |
|
Extraordinary charges |
0,07 |
0,32 |
-0,25 |
-77,85 |
|
Variation in provision in fixed assets |
|
0,02 |
|
|
|
Results before Taxes |
-6,72 |
3,85 |
-10,57 |
-274,55 |
|
Corporate taxes |
-0,07 |
1,19 |
-1,26 |
-105,88 |
|
Net Result |
-6,65 |
2,66 |
-9,31 |
-350,09 |
|
Assets depreciation |
2,04 |
3,14 |
-1,10 |
-34,95 |
|
Change of Provisions |
|
0,20 |
|
|
|
Net Self-Financing |
-4,61 |
6,00 |
-10,60 |
-176,90 |
Main Ratios
|
|
COMPANY (2006) |
PTILE25 |
PTILE50 |
PTILE75 |
|
STRUCTURAL RATIOS |
|
|
|
|
|
Management fund |
486.521,05 |
19,18 |
94,71 |
252,69 |
|
Indebtedness (%) |
58,48 |
42,73 |
66,07 |
78,93 |
|
External Funds on Net Worth |
1,41 |
0,75 |
1,95 |
3,74 |
|
GENERAL ACTIVITY
RATIO |
|
|
|
|
|
Turnover
Increase (%) |
-48,05 |
-9,46 |
3,86 |
17,41 |
|
Added value
growth (%) |
-30,38 |
-5,87 |
4,05 |
15,19 |
|
Cash Flow |
-63.909,49 |
13,79 |
35,24 |
73,66 |
|
Labour
Productivity |
0,91 |
1,11 |
1,21 |
1,35 |
|
Assets turnover |
0,64 |
0,92 |
1,34 |
1,87 |
|
Breakdown Point |
1.523.127,83 |
355.228,43 |
713.636,78 |
1.283.573,97 |
|
Security Margin
of the Breakdown Point (%) |
-9,81 |
2,83 |
6,13 |
12,02 |
|
ACTIVITY RATIOS |
|
|
|
|
|
Average Collection Period |
119 |
57 |
97 |
130 |
|
Inventory Turnover Period |
396 |
8 |
33 |
73 |
|
SOLVENCY RATIOS |
|
|
|
|
|
Payback Capacity |
-0,08 |
0,06 |
0,11 |
0,22 |
|
Assets Guarantee |
1,71 |
1,25 |
1,50 |
2,33 |
|
Short Term Debts Proportion (%) |
97,39 |
63,33 |
86,31 |
100,00 |
|
Interest Coverage |
-2,92 |
1,58 |
4,53 |
16,36 |
|
LIQUIDITY RATIOS |
|
|
|
|
|
Current Ratio |
1,60 |
1,11 |
1,43 |
2,24 |
|
Sales on Current Assets |
252 |
524 |
718 |
994 |
Results Analysis
Ratios
|
|
COMPANY (2006) |
PTILE25 |
PTILE50 |
PTILE75 |
|
Economic profitability (%) |
-5,08 |
2,10 |
4,89 |
8,73 |
|
Operating Profitability (%) |
-7,98 |
1,54 |
3,60 |
6,76 |
|
Equity gearing |
3,16 |
1,22 |
1,95 |
3,41 |
|
Financial profitability (%) |
-15,54 |
2,05 |
7,22 |
15,67 |
|
General Profitability (%) |
-10,14 |
0,51 |
1,65 |
3,99 |
FOREIGN EXCHANGE
RATES
|
Currency |
Unit
|
Indian Rupees |
|
US Dollar |
1 |
Rs.43.38 |
|
UK Pound |
1 |
Rs.81.34 |
|
Euro |
1 |
Rs.64.55 |
RATING
EXPLANATIONS
|
RATING |
STATUS |
PROPOSED CREDIT LINE |
|
|
>86 |
Aaa |
Possesses an extremely sound financial base with the strongest
capability for timely payment of interest and principal sums |
Unlimited |
|
71-85 |
Aa |
Possesses adequate working capital. No caution needed for credit transaction.
It has above average (strong) capability for payment of interest and
principal sums |
Large |
|
56-70 |
A |
Financial & operational base are regarded healthy. General unfavourable
factors will not cause fatal effect. Satisfactory capability for payment of
interest and principal sums |
Fairly Large |
|
41-55 |
Ba |
Overall operation is considered normal. Capable to meet normal
commitments. |
Satisfactory |
|
26-40 |
B |
Unfavourable & favourable factors carry similar weight in credit
consideration. Capability to overcome financial difficulties seems
comparatively below average. |
Small |
|
11-25 |
Ca |
Adverse factors are apparent. Repayment of interest and principal sums
in default or expected to be in default upon maturity |
Limited with
full security |
|
<10 |
C |
Absolute credit risk exists. Caution needed to be exercised |
Credit not
recommended |
|
NR |
In view of the lack of information, we have no basis upon which to
recommend credit dealings |
No Rating |
|
This score serves as a reference to assess SC’s credit risk
and to set the amount of credit to be extended. It is calculated from a composite
of weighted scores obtained from each of the major sections of this report. The
assessed factors and their relative weights (as indicated through %) are as
follows:
Financial
condition (40%) Ownership
background (20%) Payment
record (10%)
Credit history
(10%) Market trend
(10%) Operational
size (10%)