![]()
MIRA
INFORM REPORT
|
Report Date : |
29.08.2008 |
IDENTIFICATION
DETAILS
|
Name : |
AKLAN OCCIDENTAL S.L. |
|
|
|
|
Registered Office : |
|
|
|
|
|
Country : |
Spain |
|
|
|
|
Financials (as on) : |
31.12.2006 |
|
|
|
|
Date of Incorporation : |
|
|
|
|
|
Legal Form : |
Limited Liability Company |
|
|
|
|
Line of Business : |
RATING &
COMMENTS
|
MIRA’s Rating : |
Ca |
|
RATING |
STATUS |
PROPOSED CREDIT LINE |
|
|
11-25 |
Ca |
Adverse factors are apparent. Repayment of interest and principal sums
in default or expected to be in default upon maturity |
Limited with
full security |
|
Status : |
Moderate |
|
|
|
|
Payment Behaviour : |
No Complaints |
|
|
|
|
Litigation : |
Clear |
FINANCIAL REPORT
AKLAN OCCIDENTAL S.L.
TAX NUMBER: B81841777
EXECUTIVE SUMMARY
Identification
Current Business Name: AKLAN OCCIDENTAL S.L.
Other names: YES
Current Address: STREET DARIO, 19, CP 28232, LAS
ROZAS DE MADRID MADRID
Telephone number: 916319943 Fax: 916318757
Commercial Risk
RAI: NO
Legal Actions: NO
Financial Information
Latest Balance sheet sales (2006): 204.457,14 € (MERCANTILE REGISTER)
Result: -10.628,17 €
Total Assets: 584.392,55 €
Social Capital: 3.005,06 €
Employees: 3
Commercial Information
Constitution Date: 28/10/1997
Business activity: Wholesale of
textiles
NACE Code: 5141
International Operations: No business
relationships registered
Corporate Structure
Sole Administrator:
Parent Company:
Other Complementary Information
Latest proceeding published in BORME: 21/11/2007 Registration
of accounts
Bank Entities: Yes
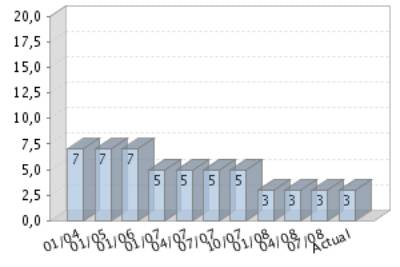
Rating Evolution
Financial Situation
Fiscal year2006
|
Treasury |
Very degraded |
|
Indebtedness |
Important |
|
Profitability |
Negative |
|
Balance |
Very Degraded |
Performance
|
Legal Actions |
None or Negligible |
|
Business
Trajectory |
Excellent |
RAI 
COMPANY NOT REGISTERED IN THE R.A.I.
This company is not registered in the Disputed Bills register (R.A.I.)
DATE AND TIME OF THE CONSULTATION: 14/08/2008
10:08:40
INCIDENTS

Summary
LEGAL ACTIONS: No legal
incidences registered.
CLAIM FILED AGAINST THE ADMINISTRATION: No administrative
claims registered
AFFECTED BY: No significant
element.
FINANCIAL ELEMENTS AND SECTORIAL
COMPARATIVE
FINANCIAL ELEMENTS
Figures given in €
|
|
2004 (12) |
2005 (12) |
2006 (12) |
% ASSETS |
|
|
|
|
|
|
BALANCE SHEET
ANALYSIS |
|
|
|
|
|
|
|
|
|
|
OWN FUNDS |
100.288,43 |
116.925,18 |
106.297,01 |
18,19 |
|
|
|
|
|
|
DEBT |
521.840,38 |
483.720,94 |
478.095,54 |
81,81 |
|
|
|
|
|
|
FIXED ASSETS |
398.312,81 |
381.478,67 |
400.332,52 |
68,50 |
|
|
|
|
|
|
TOTAL ASSETS |
622.128,81 |
600.646,12 |
584.392,55 |
|
|
|
|
|
|
|
|
|
|
|
|
|
|
|
|
|
|
|
2004 (12) |
2005 (12) |
2006 (12) |
% SALES |
|
|
|
|
|
|
PROFIT AND LOSS ACCOUNT
ANALYSIS |
|
|
|
|
|
|
|
|
|
|
SALES |
505.187,78 |
389.814,50 |
204.457,14 |
|
|
|
|
|
|
|
ADDED VALUE |
150.433,33 |
109.582,51 |
65.750,29 |
32,16 |
|
|
|
|
|
|
EBITDA |
103.889,85 |
58.304,54 |
20.072,44 |
9,82 |
|
|
|
|
|
|
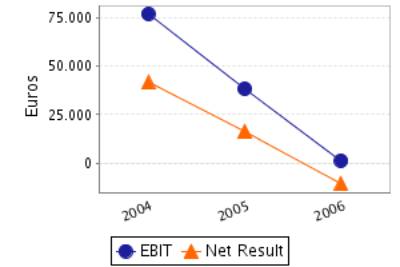
EBIT |
76.890,18 |
38.354,96 |
1.304,04 |
0,64 |
|
|
|
|
|
|
NET RESULT |
41.419,79 |
16.636,75 |
-10.628,17 |
-5,20 |
|
|
|
|
|
Balance Sheets Items
Analysis
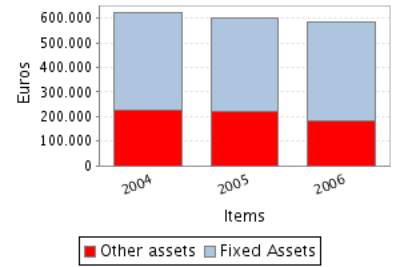
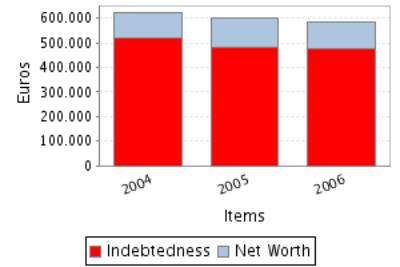
Balance Sheet Comments
Total assets of the company decreased in 3,45% between 2004 and 2005.
This decrease has been greater in the fixed assets that reduced in
-4,23%.
Assets reduction contrasts with net worth growth of 16,59%. Therefore,
the company’s indebtedness has reduced in 7,30%.
Total assets of the company decreased in 2,71% between 2005 and 2006.
In spite of the decrease in the amount of total assets, fixed assets
grew 4,94%.
Assets reduction is explained by net worth decrease of9,09and to
indebtedness reduction of 1,16.
Profit and Loss Account Analysis
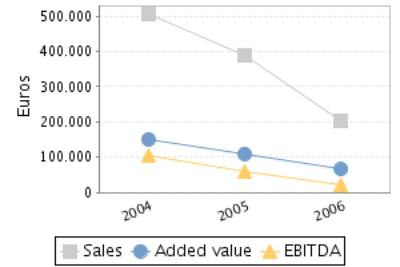
Profit and Loss Account Comments
The company’s sales figure decreased in 22,84% between 2004 and 2005.
The company’s EBIT decreased in 50,12% between 2004 and 2005.
This evolution implies a reduction in the company’s operating
profitability.
The result of these variations is a decrease of the company’s Economic
Profitability of 48,33% in the analysed period, being this profitability of
6,39% in the year 2005.
The company’s Net Result decreased in 59,83% between 2004 and 2005.
This evolution, compared to the EBIT’s performance, implies that the
financial and extraordinary activities have had a negative effect in the
company’s Financial Profitability.
The result of these variations is a reduction of the company’s profitability
of 65,55% in the analysed period, being equal to 14,23% in the year 2005.
The company’s sales figure decreased in 47,55% between 2005 and 2006.
The company’s EBIT decreased in 96,60% between 2005 and 2006.
This evolution implies a reduction in the company’s operating
profitability.
The result of these variations is a decrease of the company’s Economic
Profitability of 96,51% in the analysed period, being this profitability of
0,22% in the year 2006.
The company’s Net Result decreased in 163,88% between 2005 and 2006.
This evolution, compared to the EBIT’s performance, implies that the
financial and extraordinary activities have had a negative effect in the
company’s Financial Profitability.
The result of these variations is a reduction of the company’s
profitability of 170,27% in the analysed period, being equal to -10,00% in the
year 2006.
ANNUAL FINANCIAL REPORT ADDITIONAL DATA
Source: annual financial report 2006
Results Distribution
Figures given in €
|
DISTRIBUTION
BASE |
DISTRIBUTION TO |
||
|
Profit and Loss |
-10.628,17 |
Retained earnings |
0,00 |
|
Carry Over |
0,00 |
Voluntary Reserve |
0,00 |
|
Voluntary reserves |
0,00 |
Prior years losses |
-10.628,17 |
|
Reserves |
0,00 |
Carry Over |
0,00 |
|
Other concepts |
0,00 |
Other funds |
0,00 |
|
Total of Amounts to be distributed |
-10.628,17 |
Dividends |
0,00 |
|
|
|
Other Applications |
0,00 |
COMPARATIVE SECTOR
ANALYSIS
Values table
Figures expressed in %
|
|
COMPANY (2006) |
SECTOR |
DIFFERENCE |
DIFFERENCE RELATIVE |
|
|
|
|
|
|
BALANCE SHEET
ANALYSIS: % on the total assets |
|
|
|
|
|
|
|
|
|
|
OWN FUNDS |
18,19 |
37,47 |
-19,28 |
-51,46 |
|
|
|
|
|
|
DEBT |
81,81 |
62,53 |
19,28 |
30,84 |
|
|
|
|
|
|
FIXED ASSETS |
68,50 |
27,90 |
40,60 |
145,49 |
|
|
|
|
|
|
|
|
|
|
|
|
|
|
|
|
|
|
COMPANY (2006) |
SECTOR |
DIFFERENCE |
DIFFERENCE RELATIVE |
|
|
|
|
|
|
PROFIT AND LOSS
ACCOUNT ANALYSIS: % on the total operating income |
|
|
|
|
|
|
|
|
|
|
SALES |
100,00 |
98,82 |
1,18 |
1,20 |
|
|
|
|
|
|
ADDED VALUE |
32,16 |
20,05 |
12,11 |
60,39 |
|
|
|
|
|
|
EBIT |
0,64 |
3,61 |
-2,97 |
-82,33 |
|
|
|
|
|
|
NET RESULT |
-5,20 |
2,18 |
-7,38 |
-338,56 |
|
|
|
|
|
Sector Composition
Compared sector (NACE): 514
Number of companies: 3917
Size (Sales Figure) : 0 - 2.800.000,00
Euros
Comments on the sectorial comparative
Compared to its sector the assets of the companies show a greater
proportion of fixed assets. Specifically the difference with the sector average
is 40,60% , which means a relative difference of 145,49% .
In liabilities composition the company appeals on a wider scale to self
financing, being the proportion of net worth of 19,28% inferior, which means a
relative difference of 51,46% 19,28% more than the sector, which means a
difference of 30,84% .
The proportion that the sales mean to the company’s total ordinary
income is 100,00%, 1,18% higher than in the sector, which means a relative
difference of 1,20% .
The company’s EBIT was positive and was 0,64% with regard to the total
ordinary income, 2,97% less than the sector, which means a relative difference
of 82,33% .
The company’s capacity to generate operating income is equal to that of
the sector as its ratio EBIT/Sales is also equal.
The company’s net result was negative and equal to -5,20% with regard to
the total ordinary income, 7,38% less than the sector, which means a relative
difference of 338,56% .
The financial and extraordinary results and the tax impact have had a
negative impact on the Net result in the company with a worse behaviour than in
the sector; as a consequence, the company shows a worse Net Result/EBIT ratio
(REBEmpresa vs. REBSector).
ADDRESSES
Current Legal Seat Address:
STREET DARIO, 19
28232
LAS ROZAS DE MADRID MADRID
Characteristics
of the current address
Type
of premises: store
CORPORATE STRUCTURE
ADMINISTRATIVE LINKS
Main Board members, Directors and Auditor ![]()
|
POSITION |
SURNAMES AND
NAME |
APPOINTMENT DATE |
|
SOLE ADMINISTRATOR |
CALLEJA ABARZUZA MARIA SARA |
05/11/1999 |
FINANCIAL LINKS
|
|
BUSINESS NAME |
CIF / COUNTRY |
% |
SOURCE |
DATA INF. |
|
|
CALLEJA ABARZUZA MARIA SARA |
|
100,00 |
B.O.R.M.E. |
15/07/2004 |
CREDIT INFORMATION
Constitution Date: 28/10/1997
Business activity 
Activity: Wholesale of textiles
NACE Code: 5141
NACE Activity: Wholesale of
textiles
Business: EL COMERCIO, IMPORTACION Y EXPORTACION DE
CUALQUIER TIPO DE PRODUCTOS ELABORADOS Y DE FORMA ESPECIAL, DE TODO TIPO DE
PRENDAS DE VESTIR ASI COMO SUS COMPLEMENTOS Y ACCESORIOS.
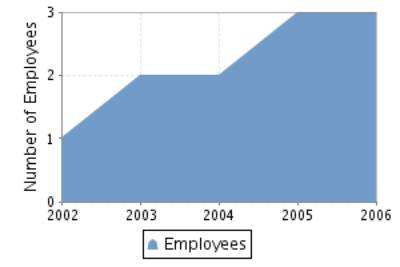
Employees 
Number of total employees: 3 (2006)
Number of fixed employees: 100,00%
Number of temporary employees: 0,00%
Employees evolution
Banks 
|
ENTITY |
BRANCH |
ADDRESS |
TOWN OR CITY |
PROVINCE |
|
CAJA DE AHORROS Y
PENSIONES DE BARCELONA |
|
|
LAS ROZAS |
|
1 bank entities registered
Brands, Signs and Commercial
Names 
Brand name: PAUL VOUZIERS (Valid)
Type: DENOMINATIVE Date: 03/11/1997
LEGAL STRUCTURE
Constitution Data
Register Date: 28/10/1997
Register town: Madrid
Announcement number: 389731
Legal form: LIMITED LIABILITY
COMPANY
Social Capital: 3.005,06 €
Current structure data 
Current Legal Form: LIMITED LIABILITY
COMPANY
Current Capital: 3.005,06 €
Legal Aspects
Obligation to fill in Financial
Statements: YES
Chamber census: YES (2006)
Listed on a Stock Exchange: NO
B.O.R.M.E.(Official Companies
Registry Gazette) 
Registered Proceedings
|
PROCEEDINGS |
DATE |
NOTICE NUM. |
TRADE REG. |
|
Declaration of individual ownership |
15/07/2004 |
320646 |
Madrid |
Other Proceedings published
|
PROCEEDINGS |
DATE |
NOTICE NUM. |
TRADE REG. |
|
Registration of accounts (2006) Individual |
21/11/2007 |
1050119 |
Madrid |
|
Registration of accounts (2005) Individual |
05/10/2006 |
664147 |
Madrid |
|
Registration of accounts (2004) Individual |
04/11/2005 |
836420 |
Madrid |
|
Registration of accounts (2003) Individual |
01/12/2004 |
912440 |
Madrid |
FINANCIAL INFORMATION
The information on the last account contained in this report is
extracted from the Mercantile Register file of the legal address of the Company
and dated 10/12/2007.
BALANCE SHEET
Assets
Figures given in €
|
|
31/12/2004 (12) |
31/12/2005 (12) |
31/12/2006 (12) |
|
A) DUE FROM SHAREHOLDERS FOR UNCALLED CAPITAL |
|
|
|
|
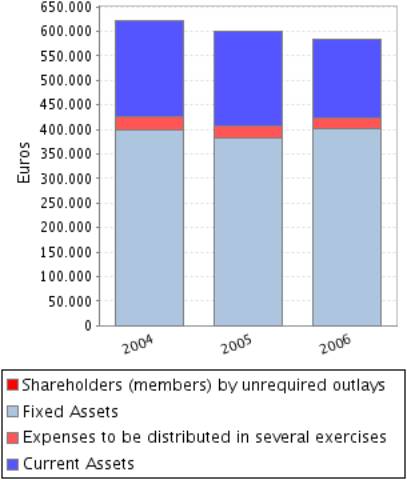
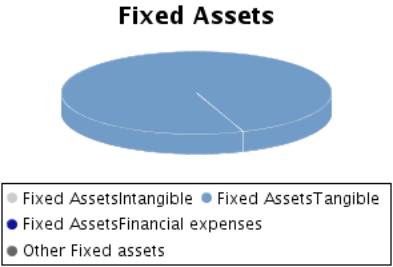
B) FIXED ASSETS |
398.312,81 |
381.478,67 |
400.332,52 |
|
I. Incorporation costs |
|
|
|
|
II. Intangible fixed assets |
129,96 |
129,96 |
129,96 |
|
III. Tangible fixed assets |
398.182,85 |
381.348,71 |
400.202,56 |
|
IV. Financial fixed assets |
|
|
|
|
V.Owners equity |
|
|
|
|
VI.Long term trade liabilities |
|
|
|
|
C) DEFERRED EXPENSES |
28.039,65 |
25.333,66 |
22.474,62 |
|
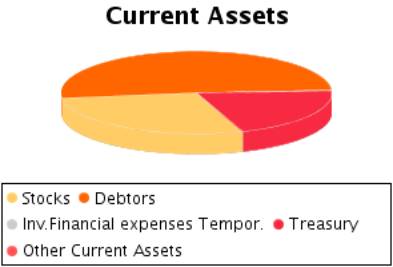
D) CURRENT ASSETS |
195.776,35 |
193.833,79 |
161.585,41 |
|
I. Shareholders by required outlays |
|
|
|
|
II. Stocks |
41.698,19 |
28.564,95 |
46.201,08 |
|
III. Debtors |
142.830,72 |
118.146,62 |
82.357,15 |
|
IV. Temporary financial investment |
544,00 |
100,00 |
350,00 |
|
V. Short-term own shares |
|
|
|
|
VI. Treasury |
10.703,44 |
47.022,22 |
32.677,18 |
|
VII. Periodification adjustments |
|
|
|
|
ASSETS (A + B + C + D) |
622.128,81 |
600.646,12 |
584.392,55 |
Assets composition
Liabilities
Figures given in €
|
|
31/12/2004 (12) |
31/12/2005 (12) |
31/12/2006 (12) |
|
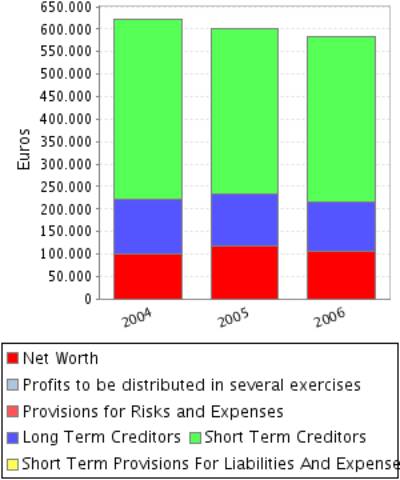
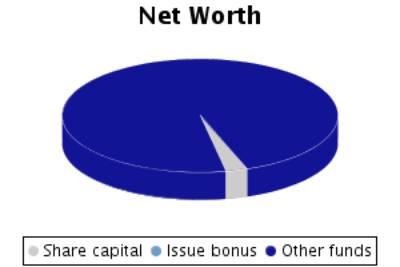
A) SHAREHOLDERS EQUITY |
100.288,43 |
116.925,18 |
106.297,01 |
|
I. Share capital |
3.005,06 |
3.005,06 |
3.005,06 |
|
II. Issue bonus |
|
|
|
|
III.Revaluation reserve |
|
|
|
|
IV.Reserves |
55.863,58 |
97.283,37 |
113.920,12 |
|
Capital adjustments in Euros |
|
|
|
|
Sundry reserves |
55.863,58 |
97.283,37 |
113.920,12 |
|
V.Results from previous years |
|
|
|
|
VI.Profit and Losses |
41.419,79 |
16.636,75 |
-10.628,17 |
|
VII.Dividend paid during the year |
|
|
|
|
VIII.Own shares for capital reduction |
|
|
|
|
B) DEFERRED INCOME |
|
|
|
|
C) PROVISIONS FOR LIABILITIES AND EXPENSES |
|
|
|
|
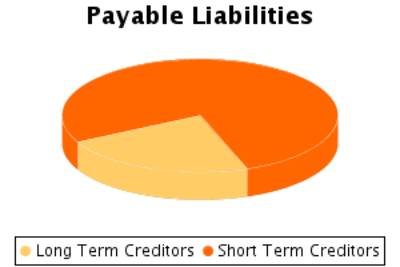
D) LONG TERM LIABILITIES |
122.700,89 |
116.120,29 |
109.377,92 |
|
E) SHORT TERM LIABILITIES |
399.139,49 |
367.600,65 |
368.717,62 |
|
F) SHORT TERM PROVISIONS FOR LIABILITIES AND
EXPENSES |
|
|
|
|
LIABILITIES (A + B + C + D + E + F) |
622.128,81 |
600.646,12 |
584.392,55 |
Liabilities Composition
PROFIT AND LOSS ACCOUNT
Itams of the Profit and Loss Account
Figures given in €
|
|
31/12/2004 (12) |
31/12/2005 (12) |
31/12/2006 (12) |
|
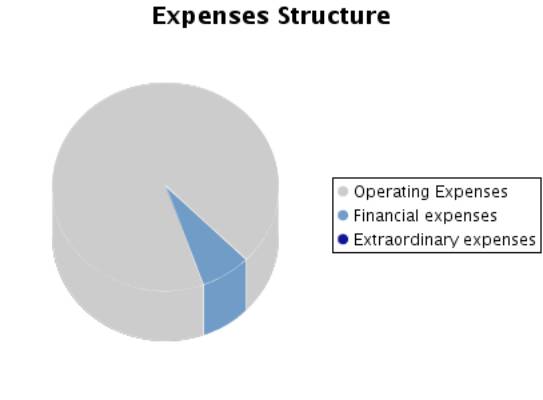
A) EXPENSES (A.1 a A.15) |
464.356,08 |
374.321,82 |
215.323,71 |
|
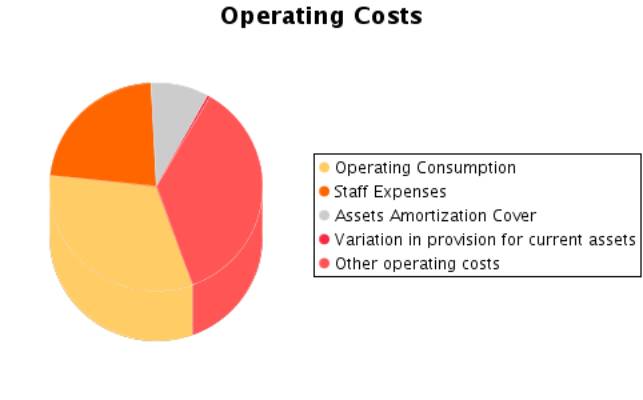
A.1.Operating costs |
271.383,23 |
209.259,91 |
65.585,50 |
|
A.2. Labour cost |
46.543,48 |
51.277,97 |
45.677,85 |
|
Wages |
44.548,58 |
48.066,12 |
41.777,45 |
|
Social security expenses |
1.994,90 |
3.211,85 |
3.900,40 |
|
A.3. Assets depreciation |
19.518,75 |
17.118,61 |
17.909,00 |
|
A.4. Variation in provision for current assets |
7.480,92 |
2.830,97 |
859,40 |
|
A.5. Other operating costs |
83.371,22 |
71.703,03 |
73.121,35 |
|
A.I. OPERATING RESULT (B.1-A.1-A.2-A.3-A.4-A.5) |
76.890,18 |
38.354,96 |
1.304,04 |
|
A.6.Financial expenses and similar |
15.900,63 |
15.001,30 |
15.254,00 |
|
Debts with
related companies |
|
|
|
|
Debts with
associated companies |
|
|
|
|
Other companies
debts By debts with third parties and similar expenses |
15.900,63 |
15.001,30 |
15.254,00 |
|
Losses from
financial investments |
|
|
|
|
A.7. Variation
in financial investment provision |
2.406,51 |
|
|
|
A.8.Negative
exchange difference |
|
|
|
|
A.II.POSITIVE
FINANCIAL RESULTS (B.2+B.3-A.6-A.7-A.8) |
|
|
|
|
A.III.PROFIT FROM
ORDINARY ACTIVITIES (A.I+A.II-B.I-B.II) |
59.171,13 |
23.766,78 |
|
|
A.9. Variation
in provision in fixed assets |
|
|
|
|
A.10. Losses in fixed assets |
|
|
|
|
A.11. Losses from own shares and bonds |
|
|
|
|
A.12. Extraordinary charges |
|
|
|
|
A.13.Other
exercises’ expenses and losses |
|
|
|
|
A.IV.POSITIVE
EXTRAORDINARY RESULT (B.4+B.5+B.6+B.7+B.8-A.9-A.10-A.11-A.12-A.13) |
|
|
|
|
A.V.PROFIT
BEFORE TAXES (A.III+A.IV-B.III-B.IV) |
59.171,13 |
23.766,78 |
|
|
A.14.Corporate Taxes |
17.751,34 |
7.130,03 |
-3.083,39 |
|
A.15. Other taxes |
|
|
|
|
A.VI.EXERCISE RESULT (PROFIT) (A.V-A.14-A.15) |
41.419,79 |
16.636,75 |
|
|
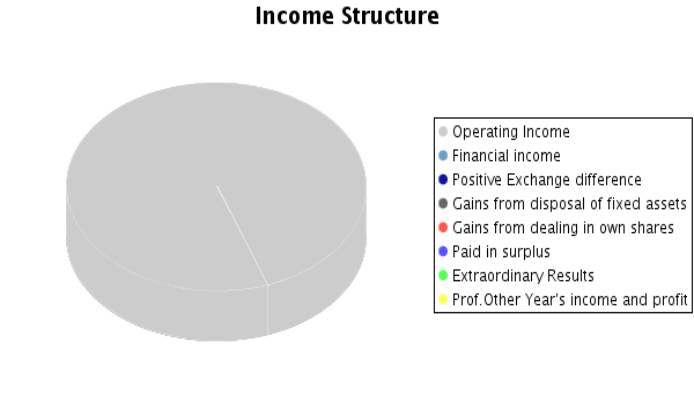
B) INCOMES (B.1 a B.8) |
505.775,87 |
390.958,57 |
204.695,54 |
|
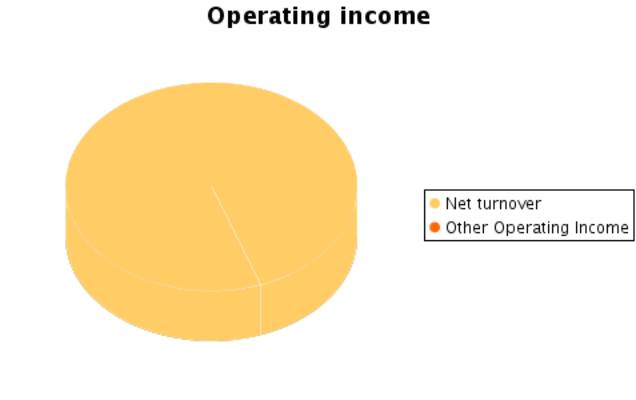
B.1.Operating income |
505.187,78 |
390.545,45 |
204.457,14 |
|
Turnover |
505.187,78 |
389.814,50 |
204.457,14 |
|
Other operating income |
|
730,95 |
|
|
B.I.OPERATING LOSSES (A.1+A.2+A.3+A.4+A.5-B.1) |
|
|
|
|
B.2.Financial Income |
343,13 |
413,12 |
238,40 |
|
From affiliated companies |
|
|
|
|
From associated companies |
|
|
|
|
Other |
343,13 |
413,12 |
238,40 |
|
Gains from investments |
|
|
|
|
B.3. Positive change difference |
244,96 |
|
|
|
B.II. NEGATIVE FINANCIAL RESULTS
(A.6+A.7+A.8-B.2-B.3) |
17.719,05 |
14.588,18 |
15.015,60 |
|
B.III.LOSSES FROM ORDINARY ACTIVITIES
(B.I+B.II-A.I-A.II) |
|
|
13.711,56 |
|
B.4.B.9. Gains from disposal of fixed assets |
|
|
|
|
B.5.Gains from dealing in own shares |
|
|
|
|
B.6. Paid in surplus |
|
|
|
|
B.7. Extraordinary income |
|
|
|
|
B.8.Other year’s income and profits |
|
|
|
|
B.IV.NEGATIVE EXTRAORDINARY LOSSES
(A.9+A.10+A.11+A.12+A.13-B.4-B.5-B.6-B.7-B.8) |
|
|
|
|
B.V.LOSS BEFORE TAXES (B.III+B.IV-A.III-A.IV) |
|
|
13.711,56 |
|
B.VI.EXERCISE RESULTS (LOSS) (B.V+A.14+A.15) |
|
|
10.628,17 |
Composition of the
Profit and Loss Account
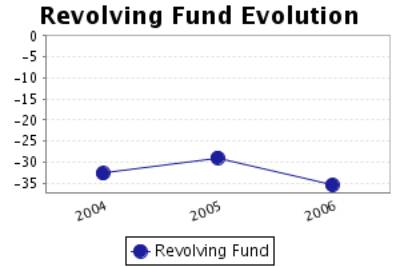
FINANCIAL BALANCE
Here the Main Capital Amounts of the company and the Revolving Fund
Evolution are analysed.
Financial Balance Table
Figures given in €
|
|
31/12/2004 (12) |
% |
31/12/2005 (12) |
% |
31/12/2006 (12) |
% |
|
A) DUE FROM
SHAREHOLDERS FOR UNCALLED CAPITAL |
|
|
|
|
|
|
|
B) FIXED ASSETS |
398.312,81 |
64,02 |
381.478,67 |
63,51 |
400.332,52 |
68,50 |
|
C) DEFERRED
EXPENSES |
28.039,65 |
4,51 |
25.333,66 |
4,22 |
22.474,62 |
3,85 |
|
D) CURRENT
ASSETS |
195.776,35 |
31,47 |
193.833,79 |
32,27 |
161.585,41 |
27,65 |
|
ASSETS (A + B +
C + D) |
622.128,81 |
|
600.646,12 |
|
584.392,55 |
|
|
|
||||||
|
A) SHAREHOLDERS
EQUITY |
100.288,43 |
16,12 |
116.925,18 |
19,47 |
106.297,01 |
18,19 |
|
B) DEFERRED
INCOME |
|
|
|
|
|
|
|
C) PROVISIONS
FOR LIABILITIES AND EXPENSES |
|
|
|
|
|
|
|
D) LONG TERM
LIABILITIES |
122.700,89 |
19,72 |
116.120,29 |
19,33 |
109.377,92 |
18,72 |
|
E) SHORT TERM
LIABILITIES |
399.139,49 |
64,16 |
367.600,65 |
61,20 |
368.717,62 |
63,09 |
|
F) SHORT TERM
PROVISIONS FOR LIABILITIES AND EXPENSES |
|
|
|
|
|
|
|
LIABILITIES (A +
B + C + D + E + F) |
622.128,81 |
|
600.646,12 |
|
584.392,55 |
|
Financial Balance
Composition
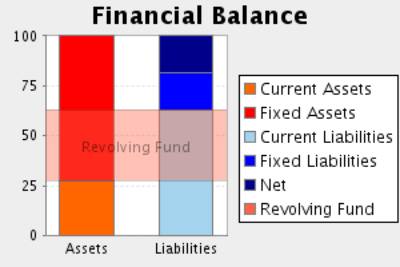
Comments on Financial Balance
In the 2004, the assets of the company were formed in 68,53% of Fixed
Assets and in 31,47% of Current Assets.This assets were financed in 16,12% with
own capitals, and in 19,72% with long term debt and in 64,16% with current
liabilities.
The result of this financial structure is a negative turnover fund of
-203.363,14 Euros, which is equivalent to -32,69% proportion of the company’s
total assets.
In the 2005, the assets of the company were formed in 67,73% of Fixed
Assets and in 32,27% of Current Assets.This assets were financed in 19,47% with
own capitals, and in 19,33% with long term debt and in 61,20% with current
liabilities.
The result of this financial structure is a negative turnover fund of
-173.766,86 Euros, which is equivalent to -28,93% proportion of the company’s
total assets.
This measure has increased with respect to the previous exercise in
14,55% having also increased its proportion with respect to the total assets of
the company.
In the 2006, the assets of the company were formed in 72,35% of Fixed
Assets and in 27,65% of Current Assets.This assets were financed in 18,19% with
own capitals, and in 18,72% with long term debt and in 63,09% with current
liabilities.
The result of this financial structure is a negative turnover fund of
-207.132,21 Euros, which is equivalent to -35,44% proportion of the company’s
total assets.
This measure has diminished with respect to the previous exercise in
19,20% having also diminished its proportion with respect to the total assets
of the company.
RATIOS
Main Ratios
|
|
31/12/2004 (12) |
31/12/2005 (12) |
31/12/2006 (12) |
|
STRUCTURAL RATIOS |
|
|
|
|
Management fund |
-203.363,14 |
-173.766,86 |
-207.132,21 |
|
Indebtedness (%) |
83,88 |
80,53 |
81,81 |
|
External Funds on Net Worth |
5,20 |
4,14 |
4,50 |
|
GENERAL ACTIVITY RATIO |
|
|
|
|
Turnover Increase (%) |
1,00 |
-22,84 |
-47,55 |
|
Added value growth (%) |
31,65 |
-27,16 |
-40,00 |
|
Cash Flow |
70.825,97 |
36.586,33 |
8.140,23 |
|
Labour Productivity |
3,23 |
2,14 |
1,44 |
|
Assets turnover |
0,81 |
0,65 |
0,35 |
|
Breakdown Point |
339.049,10 |
307.916,93 |
202.537,23 |
|
Security Margin of the Breakdown Point (%) |
32,89 |
21,16 |
0,94 |
|
ACTIVITY RATIOS |
|
|
|
|
Average Collection Period |
102 |
109 |
145 |
|
Inventory Turnover Period |
30 |
26 |
81 |
|
SOLVENCY RATIOS |
|
|
|
|
Payback Capacity |
0,14 |
0,08 |
0,02 |
|
Assets Guarantee |
1,14 |
1,19 |
1,18 |
|
Short Term Debts Proportion (%) |
76,49 |
75,99 |
77,12 |
|
Interest Coverage |
4,27 |
2,41 |
0,52 |
|
LIQUIDITY RATIOS |
|
|
|
|
Current Ratio |
0,49 |
0,53 |
0,44 |
|
Immediate liquidity |
0,03 |
0,13 |
0,09 |
|
Sales on Current Assets |
929 |
724 |
456 |
Results Analysis Ratios
|
|
31/12/2004 (12) |
31/12/2005 (12) |
31/12/2006 (12) |
|
Economic profitability (%) |
12,36 |
6,39 |
0,22 |
|
Operating Profitability (%) |
15,22 |
9,84 |
0,64 |
|
Equity gearing |
4,77 |
3,18 |
-57,81 |
|
Financial profitability (%) |
41,30 |
14,23 |
-10,00 |
|
General Profitability (%) |
8,20 |
4,27 |
-5,20 |
Comments on the
Results Analysis Ratios
The economic profitability in the year2005 achieved a 6,39% positive
level, due to a 9,84% economic margin and to an assets turnover of0,65%.
The economic profitability in the year has reduced from 12,36% up to 6,39%
of2005, even if it remains positive. This fall is due to the decrease in
operating profitability, that has passe from 15,22% to 9,84%, as assets
turnover whose index has passed from 0,81 to 0,65%.
Financial profitability on 2005 achieved a 14,23%.
The company’s financial structure has instigated its economic
profitability with an indebtedness level of 3,18.
The general profitability on 2005 achieved a 4,27%.
The economic profitability in the year2006 achieved a 0,22% positive
level, due to a 0,64% economic margin and to an assets turnover of0,35%.
The economic profitability in the year has reduced from 6,39% up to
0,22% of2006, even if it remains positive. This fall is due to the decrease in
operating profitability, that has passe from 9,84% to 0,64%, as assets turnover
whose index has passed from 0,65 to 0,35%.
Financial profitability on 2006The economic profitability in the year
-10,00
The company’s financial structure has endangered its profitability with
an indebtedness level -57,81.
The general profitability on 2006The economic profitability in the year
-5,20
SECTORIAL ANÁLYSIS
Large Capital Amounts and Financial Balance
Figures given in %
|
|
COMPANY (2006) |
SECTOR |
DIFFERENCE |
DIFFERENCE RELATIVE |
|
|
|
|
|
|
ASSETS |
|
|
|
|
|
|
|
|
|
|
A) DUE FROM
SHAREHOLDERS FOR UNCALLED CAPITAL |
|
0,07 |
|
|
|
|
|
|
|
|
B) FIXED ASSETS |
68,50 |
27,90 |
40,60 |
145,48 |
|
|
|
|
|
|
C) DEFERRED
EXPENSES |
3,85 |
0,39 |
3,46 |
877,16 |
|
|
|
|
|
|
D) CURRENT ASSETS |
27,65 |
71,63 |
-43,98 |
-61,40 |
|
|
|
|
|
|
ASSETS (A + B + C + D) |
100 |
100 |
|
|
|
|
|
|
|
|
|
|
|
|
|
|
|
|
|
|
|
|
COMPANY (2006) |
SECTOR |
DIFFERENCE |
DIFFERENCE RELATIVE |
|
|
|
|
|
|
LIABILITIES |
|
|
|
|
|
|
|
|
|
|
A) SHAREHOLDERS
EQUITY |
18,19 |
37,11 |
-18,92 |
-50,98 |
|
|
|
|
|
|
B) DEFERRED
INCOME |
|
0,37 |
|
|
|
|
|
|
|
|
C) PROVISIONS
FOR LIABILITIES AND EXPENSES |
|
0,10 |
|
|
|
|
|
|
|
|
D) LONG TERM LIABILITIES |
18,72 |
13,57 |
5,15 |
37,96 |
|
|
|
|
|
|
E) SHORT TERM
LIABILITIES |
63,09 |
48,78 |
14,31 |
29,34 |
|
|
|
|
|
|
F) SHORT TERM
PROVISIONS FOR LIABILITIES AND EXPENSES |
|
0,08 |
|
|
|
|
|
|
|
|
LIABILITIES (A +
B + C + D + E + F) |
100 |
100 |
|
|
|
|
|
|
|
Sectorial Financial
Balance Comparison
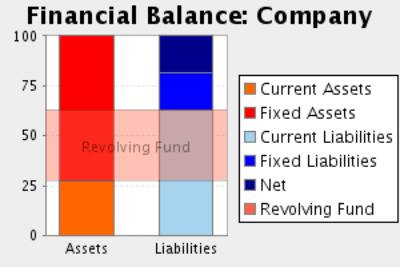
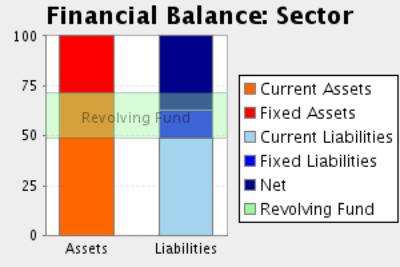
Comments to the Sectorial Analysis
In the 2006, the assets of the company were formed in 72,35% of fixed
assets and in 27,65Current Assets % In the sector, the proportion of fixed
assets was of 28,37%, 155,05% inferior, and the proportion of current assets
was of 71,63%, 61,40% superior.
The assets were financed in the company in 18,19% with own capitals , in
18,72% with fixed liabilities and in 63,09% with current liabilities In the
sector, the self financing represented 37,47%, 51,46% superior. On the other
hand the long term debts represented in the sector an average of 13,67%
financing, with a relative difference of 36,94% in favour of the companyAnd,
short term liabilities represented in the sector an average of 48,86%
financing, with a relative difference of 29,13% in favour of the company
The result of this company’s financial structure is a turnover fund that
represents -35,44% of the total assets; in the sector, this same proportion is
22,78%, therefore, we can say that the company’s turnover fund is 255,60%
smaller than the sector one.
Analytical Account of Results
Figures given in %
|
|
COMPANY (2006) |
SECTOR |
DIFFERENCE |
DIFFERENCE RELATIVE |
|
Turnover |
100,00 |
98,82 |
1,18 |
1,20 |
|
Other operating income |
|
1,18 |
|
|
|
Production Value |
100,00 |
100,00 |
0,00 |
0,00 |
|
Operating expenses |
32,08 |
66,55 |
-34,47 |
-51,80 |
|
Other operation expenses |
35,76 |
13,40 |
22,36 |
166,95 |
|
Added value |
32,16 |
20,05 |
12,11 |
60,40 |
|
Labour cost |
22,34 |
14,67 |
7,67 |
52,25 |
|
Gross Economic Result |
9,82 |
5,38 |
4,44 |
82,63 |
|
Assets depreciation |
8,76 |
1,58 |
7,18 |
454,08 |
|
Variation in provision for current assets and bad debt losses |
0,42 |
0,18 |
0,24 |
127,03 |
|
Net Economic Result |
0,64 |
3,61 |
-2,97 |
-82,27 |
|
Financial income |
0,12 |
0,37 |
-0,25 |
-67,83 |
|
Financial Charges |
7,46 |
1,40 |
6,06 |
433,62 |
|
Variation in financial investment provision |
|
0,00 |
|
|
|
Ordinary Activities Result |
-6,71 |
2,58 |
-9,29 |
-359,67 |
|
Extraordinary income |
|
0,65 |
|
|
|
Extraordinary charges |
|
0,17 |
|
|
|
Variation in provision in fixed assets |
|
0,00 |
|
|
|
Results before Taxes |
-6,71 |
3,06 |
-9,77 |
-319,07 |
|
Corporate taxes |
-1,51 |
0,88 |
-2,39 |
-270,81 |
|
Net Result |
-5,20 |
2,18 |
-7,38 |
-338,64 |
|
Assets depreciation |
8,76 |
1,58 |
7,18 |
454,08 |
|
Change of Provisions |
0,42 |
0,19 |
0,23 |
119,90 |
|
Net Self-Financing |
3,98 |
3,95 |
0,03 |
0,71 |
Main Ratios
|
|
COMPANY (2006) |
PTILE25 |
PTILE50 |
PTILE75 |
|
STRUCTURAL RATIOS |
|
|
|
|
|
Management fund |
-207.132,21 |
14,07 |
79,92 |
213,78 |
|
Indebtedness (%) |
81,81 |
50,48 |
70,90 |
84,93 |
|
External Funds on Net Worth |
4,50 |
1,02 |
2,44 |
5,64 |
|
GENERAL ACTIVITY RATIO |
|
|
|
|
|
Turnover Increase (%) |
-47,55 |
-10,06 |
0,34 |
11,18 |
|
Added value growth (%) |
-40,00 |
-8,16 |
3,00 |
16,20 |
|
Cash Flow |
8.140,23 |
7,65 |
20,38 |
47,02 |
|
Labour Productivity |
1,44 |
1,14 |
1,30 |
1,61 |
|
Assets turnover |
0,35 |
0,97 |
1,47 |
2,10 |
|
Breakdown Point |
202.537,23 |
313.403,56 |
651.298,66 |
1.192.759,02 |
|
Security Margin of the Breakdown Point (%) |
0,94 |
3,74 |
8,94 |
16,51 |
|
ACTIVITY RATIOS |
|
|
|
|
|
Average Collection Period |
145 |
30 |
68 |
114 |
|
Inventory Turnover Period |
81 |
22 |
60 |
128 |
|
SOLVENCY RATIOS |
|
|
|
|
|
Payback Capacity |
0,02 |
0,03 |
0,07 |
0,14 |
|
Assets Guarantee |
1,18 |
1,17 |
1,40 |
1,97 |
|
Short Term Debts Proportion (%) |
77,12 |
73,96 |
94,93 |
100,00 |
|
Interest Coverage |
0,52 |
0,77 |
2,79 |
9,67 |
|
LIQUIDITY RATIOS |
|
|
|
|
|
Current Ratio |
0,44 |
1,08 |
1,35 |
1,96 |
|
Immediate liquidity |
0,09 |
0,04 |
0,16 |
0,45 |
|
Sales on Current Assets |
456 |
475 |
703 |
1.011 |
Results Analysis
Ratios
|
|
COMPANY (2006) |
PTILE25 |
PTILE50 |
PTILE75 |
|
Economic profitability (%) |
0,22 |
1,76 |
4,09 |
7,79 |
|
Operating Profitability (%) |
0,64 |
1,22 |
2,84 |
5,52 |
|
Equity gearing |
-57,81 |
1,33 |
2,23 |
4,21 |
|
Financial profitability (%) |
-10,00 |
2,70 |
7,63 |
16,46 |
|
General Profitability (%) |
-5,20 |
0,49 |
1,28 |
3,08 |
NOTES
In spite of investigations using every
source available (public and private), no additional details than those
contained in this report are available.
FOREIGN EXCHANGE
RATES
|
Currency |
Unit
|
Indian Rupees |
|
US Dollar |
1 |
Rs.43.73 |
|
UK Pound |
1 |
Rs.80.31 |
|
Euro |
1 |
Rs.64.61 |
RATING
EXPLANATIONS
|
RATING |
STATUS |
PROPOSED CREDIT LINE |
|
|
>86 |
Aaa |
Possesses an extremely sound financial base with the strongest capability
for timely payment of interest and principal sums |
Unlimited |
|
71-85 |
Aa |
Possesses adequate working capital. No caution needed for credit
transaction. It has above average (strong) capability for payment of interest
and principal sums |
Large |
|
56-70 |
A |
Financial & operational base are regarded healthy. General
unfavourable factors will not cause fatal effect. Satisfactory capability for
payment of interest and principal sums |
Fairly Large |
|
41-55 |
Ba |
Overall operation is considered normal. Capable to meet normal
commitments. |
Satisfactory |
|
26-40 |
B |
Unfavourable & favourable factors carry similar weight in credit
consideration. Capability to overcome financial difficulties seems comparatively
below average. |
Small |
|
11-25 |
Ca |
Adverse factors are apparent. Repayment of interest and principal sums
in default or expected to be in default upon maturity |
Limited with
full security |
|
<10 |
C |
Absolute credit risk exists. Caution needed to be exercised |
Credit not
recommended |
|
NR |
In view of the lack of information, we have no basis upon which to
recommend credit dealings |
No Rating |
|
This score serves as a reference to assess SC’s credit risk
and to set the amount of credit to be extended. It is calculated from a
composite of weighted scores obtained from each of the major sections of this
report. The assessed factors and their relative weights (as indicated through
%) are as follows:
Financial
condition (40%) Ownership
background (20%) Payment
record (10%)
Credit history
(10%) Market trend
(10%) Operational
size (10%)