![]()
MIRA
INFORM REPORT
|
Report Date : |
02.12.2008 |
IDENTIFICATION
DETAILS
|
Name : |
PRYSMIAN CABLES Y SISTEMAS SL |
|
|
|
|
Registered Office : |
Carretera Vilafranca (C-15 Km
2), Cp 08800, Vilanova I La Geltru Barcelona |
|
|
|
|
Country : |
Spain |
|
|
|
|
Financials (as on) : |
31.12.2007 |
|
|
|
|
Date of Incorporation : |
|
|
|
|
|
Legal Form : |
Limited Liability Company |
|
|
|
|
Line of Business : |
RATING &
COMMENTS
|
MIRA’s Rating : |
A |
|
RATING |
STATUS |
PROPOSED CREDIT LINE |
|
|
56-70 |
A |
Financial & operational base are regarded healthy. General
unfavourable factors will not cause fatal effect. Satisfactory capability for
payment of interest and principal sums |
Fairly Large |
|
Maximum Credit Limit : |
5.499.861,77 € |
|
|
|
|
Status : |
Good |
|
|
|
|
Payment Behaviour : |
Regular |
|
|
|
|
Litigation : |
Clear |
name of the company
TAX NUMBER: B08958381
EXECUTIVE SUMMARY
Identification
Current Business Name: PRYSMIAN CABLES Y
SISTEMAS SL
Commercial Name: CAVINOVA
Other names: YES
Current Address: CARRETERA VILAFRANCA (C-15 KM
2), CP 08800, VILANOVA I LA GELTRU BARCELONA
Branches: 2
Telephone number: 938116050 Fax: 938116101
URL: www.prysmian.com
Commercial Risk
Credit Appraisal:
5.499.861,77 €
RAI: NO
Legal Actions: NO
Financial
Information
Latest Balance sheet sales (2007): 478.450.000,00 € (MERCANTILE REGISTER)
Result: 22.966.000 €
Total Assets: 280.359.000 €
Social Capital: 14.000.000,00 €
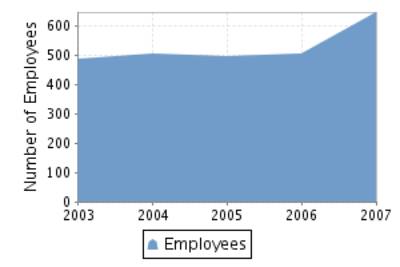
Employees: 504
Commercial Information
Constitution Date: 28/12/1984
Business activity: Mfg. of insulated electric wires & cables
NACE Code: 3130
International Operations: Imports and Exports
Corporate
Structure
President:
Participations: 1
Other Complementary Information
Latest proceeding published in BORME: 14/08/2008 Appointments
Latest press article: 02/10/2007 EXPANSION DE
CATALUNA (INFORMATION ON SENIOR MANAGEMENT)
Bank Entities: Yes
COMMERCIAL RISK
Credit Appraisal
Maximum Credit
(from 0 a 6,000,000 €)
Favourable to 5.499.861,77 €
Rating Evolution
Financial Situation
Fiscal year2007
|
Treasury |
Excellent |
|
Indebtedness |
Important |
|
Profitability |
Average |
|
Balance |
Excellent |
Performance
|
Legal Actions |
None or Negligible |
|
Business
Trajectory |
Excellent |
COMPANY NOT REGISTERED IN THE R.A.I.
This company is not registered in the Disputed Bills register (R.A.I.)
Summary
LEGAL ACTIONS: No legal
incidences registered
CLAIM FILED AGAINST THE ADMINISTRATION: No administrative
claims registered
AFFECTED BY:
1 Company / Companies in Insolvency Proceedings.
FINANCIAL ELEMENTS AND SECTORIAL
COMPARATIVE
FINANCIAL ELEMENTS
Figures given in thousands €
|
|
2005 (12) |
2006 (12) |
2007 (12) |
% ASSETS |
|
|
|
|
|
|
BALANCE SHEET
ANALYSIS |
|
|
|
|
|
|
|
|
|
|
OWN FUNDS |
30.524,00 |
9.255,00 |
42.487,00 |
15,15 |
|
|
|
|
|
|
DEBT |
135.463,00 |
247.817,00 |
237.872,00 |
84,85 |
|
|
|
|
|
|
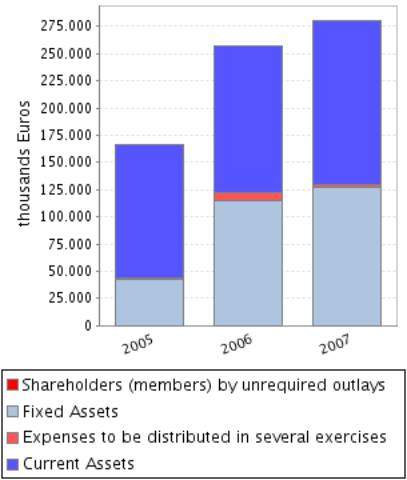
FIXED ASSETS |
42.020,00 |
115.233,00 |
127.091,00 |
45,33 |
|
|
|
|
|
|
TOTAL ASSETS |
165.987,00 |
257.072,00 |
280.359,00 |
|
|
|
|
|
|
|
|
|
|
|
|
|
|
|
|
|
|
|
2005 (12) |
2006 (12) |
2007 (12) |
% SALES |
|
|
|
|
|
|
PROFIT AND LOSS
ACCOUNT ANALYSIS |
|
|
|
|
|
|
|
|
|
|
SALES |
303.297,00 |
373.893,00 |
478.450,00 |
|
|
|
|
|
|
|
ADDED VALUE |
44.541,00 |
54.460,00 |
85.229,00 |
17,81 |
|
|
|
|
|
|
EBITDA |
18.670,00 |
27.609,00 |
49.333,00 |
10,31 |
|
|
|
|
|
|
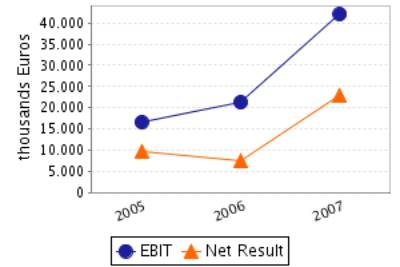
EBIT |
16.584,00 |
21.277,00 |
42.077,00 |
8,79 |
|
|
|
|
|
|
NET RESULT |
9.783,00 |
7.484,00 |
22.966,00 |
4,80 |
|
|
|
|
|
BALANCE SHEETS ITEMS
ANALYSIS
Balance Sheet Comments
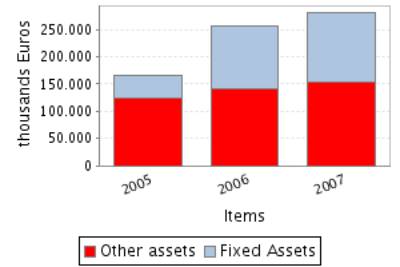
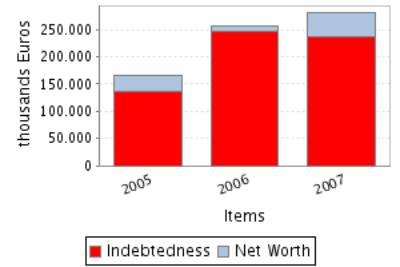
Total assets of the company grew 54,87% between 2005 and 2006.
This growth is a consequence of the fixed assets increase of 174,23%.
This growth has been financed with an indebtedness increase of 82,94%.Moreover,
net worth has been reduced in 69,68%, which explains a part of the indebtedness
increase. .
Total assets of the company grew 9,06% between 2006 and 2007.
This growth is a consequence of the fixed assets increase of 10,29%.
This growth has been financed with a Shareholders’ equity increase of
359,07% this company’s net increase has also covered the reduction of the
company’s indebtedness of 4,01% of company’s indebtedness.
PROFIT AND LOSS ACCOUNT ANALYSIS
Profit and Loss Account Comments
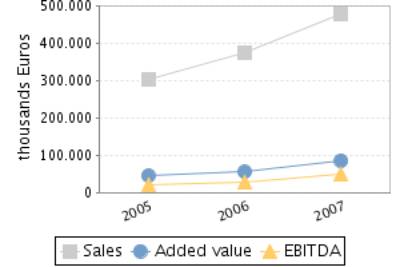
The company’s sales figure grew 23,28% between 2005 and 2006.
The company’s EBIT grew 28,30% between 2005 and 2006.
This evolution implies an increase in the company’s operating
profitability.
The result of these variations is a decrease of the company’s Economic
Profitability of 17,16% in the analysed period, being this profitability of
8,28% in the year 2006.
The company’s Net Result decreased in 23,50% between 2005 and 2006.
This evolution, compared to the EBIT’s performance, implies that the
financial and extraordinary activities have had a negative effect in the
company’s Financial Profitability.
The result of these variations is an increase of the company’s Economic
Profitability of 152,31% in the analysed period, being equal to 80,86% in the
year 2006.
The company’s sales figure grew 27,96% between 2006 and 2007.
The company’s EBIT grew 97,76% between 2006 and 2007.
This evolution implies an increase in the company’s operating
profitability.
The result of these variations is an increase of the company’s Economic
Profitability of 81,33% in the analysed period, being this profitability of
15,01% in the year 2007.
The company’s Net Result grew 206,87% between 2006 and 2007.
This evolution, compared to the EBIT’s performance, implies that the
financial and extraordinary activities have had a positive effect in the
company’s Financial Profitability.
The result of these variations is a reduction of the company’s
profitability of 33,15% in the analysed period, being equal to 54,05% in the
year 2007.
ANNUAL FINANCIAL REPORT
ADDITIONAL DATA
Source: annual financial report 2007
Results Distribution
Figures given in €
|
DISTRIBUTION
BASE |
DISTRIBUTION TO |
||
|
Profit and Loss |
22.966.000,00 |
Retained earnings |
400.000,00 |
|
Carry Over |
0,00 |
Voluntary Reserve |
22.566.000,00 |
|
Voluntary reserves |
0,00 |
Prior years losses |
0,00 |
|
Reserves |
0,00 |
Carry Over |
0,00 |
|
Other concepts |
0,00 |
Other funds |
0,00 |
|
Total of Amounts to be distributed |
22.966.000,00 |
Dividends |
0,00 |
|
|
|
Other Applications |
0,00 |
AUDITING
Auditors’ opinion: FAVOURABLE
Auditor: PRICEWATERHOUSECOOPERS AUDITORES SL
COMPARATIVE SECTOR ANALYSIS
Values table
Figures expressed in %
|
|
COMPANY (2007) |
SECTOR |
DIFFERENCE |
DIFFERENCE RELATIVE |
|
|
|
|
|
|
BALANCE SHEET
ANALYSIS: % on the total assets |
|
|
|
|
|
|
|
|
|
|
OWN FUNDS |
15,15 |
36,17 |
-21,01 |
-58,10 |
|
|
|
|
|
|
DEBT |
84,85 |
63,83 |
21,01 |
32,92 |
|
|
|
|
|
|
FIXED ASSETS |
45,33 |
33,25 |
12,08 |
36,34 |
|
|
|
|
|
|
|
|
|
|
|
|
|
|
|
|
|
|
COMPANY (2007) |
SECTOR |
DIFFERENCE |
DIFFERENCE RELATIVE |
|
|
|
|
|
|
PROFIT AND LOSS ACCOUNT ANALYSIS: % on the total
operating income |
|
|
|
|
|
|
|
|
|
|
SALES |
99,72 |
98,36 |
1,36 |
1,38 |
|
|
|
|
|
|
ADDED VALUE |
17,76 |
20,77 |
-3,01 |
-14,49 |
|
|
|
|
|
|
EBIT |
8,77 |
6,19 |
2,58 |
41,59 |
|
|
|
|
|
|
NET RESULT |
4,79 |
3,66 |
1,13 |
30,89 |
|
|
|
|
|
Sector Composition
Compared sector (NACE): 313
Number of companies: 10
Size (Sales Figure) : > 40.000.000,00 Euros
Comments on the sectorial comparative
Compared to its sector the assets of the companies show a greater proportion
of fixed assets. Specifically the difference with the sector average is 12,08%
, which means a relative difference of 36,34% .
In liabilities composition the company appeals on a wider scale to self
financing, being the proportion of net worth of 21,01% inferior, which means a
relative difference of 58,10% 21,01% more than the sector, which means a
difference of 32,92% .
The proportion that the sales mean to the company’s total ordinary
income is 99,72%, 1,36% higher than in the sector, which means a relative
difference of 1,38% .
The company’s EBIT was positive and was 8,77% with regard to the total
ordinary income, 2,58% higher than in the sector, which means a relative
difference of 41,59% .
The company’s capacity to generate operating income is higher than the
one of the sector as its ratio EBIT/Sales is higher (ES Company versus ES
Sector).
The company’s net result was positive and equal to 4,79% with regard to
the total ordinary income, 1,13% higher than in the sector, which means a
relative difference of 30,89% .
The financial and extraordinary results and the tax impact have had a
negative impact on the Net result in the company with a worse behaviour than in
the sector; as a consequence, the company shows a worse Net Result/EBIT ratio
(REBEmpresa vs. REBSector).
ADDRESSES
Current Legal Seat Address:
CARRETERA VILAFRANCA (C-15 KM 2)
08800 VILANOVA I LA GELTRU BARCELONA
Previous Seat Address:
RAMBLA JOAN BAPTISTA PIRELLI, 2
08800
VILANOVA I LA GELTRU BARCELONA
|
STREET |
POSTAL CODE |
TOWN |
PROVINCE |
|
CARRETERA C-
212 A O BURGO S-N |
|
A CORUÑA |
La Coruña |
|
STREET CONDE DE PEÑALVER 38 |
28006 |
MADRID |
Madrid |
2 branches registered
CORPORATE STRUCTURE
ADMINISTRATIVE LINKS
Main Board members, Directors and Auditor ![]()
|
POSITION |
SURNAMES AND
NAME |
APPOINTMENT DATE |
|
|
PRESIDENT |
CARDONA TORRANDELL JAVIER |
18/11/2005 |
|
|
CHIEF OFFICER |
VALERIO BATISTA |
18/11/2005 |
|
|
CHIEF OFFICER |
MILA VIDAL MANEL |
18/11/2005 |
|
|
CHIEF OFFICER |
ZORRAQUINO ASUNSOLO JAVIER |
18/11/2005 |
|
|
CHIEF OFFICER |
ACIN JOVER FRANCESC XAVIER |
18/11/2005 |
|
|
CHIEF OFFICER |
ZANCAN GIOVANNI |
18/11/2005 |
|
|
CHIEF OFFICER |
CALVO ROVIRA JORDI |
18/11/2005 |
|
|
CHIEF OFFICER |
PIER FRANCESCO FACCHINI |
29/05/2008 |
|
|
AUDITOR |
APPOINTMENT DATE |
||
|
PRICEWATERHOUSECOOPERS AUDITORES SL |
14/08/2008 |
||
Functional Managers
|
POSITION |
SURNAMES AND
NAME |
|
General Manager |
ACIN JOVER FRANCESC XAVIER |
|
Financial Manager |
ZORRAQUINO AXUNSOLO JAVIER |
|
Commercial Manager |
ACHAERANDIO RODRIGUEZ MANUEL |
|
Purchases Manager |
FANDOS JAUME |
|
IT Manager |
TORRENS JOSEP |
FINANCIAL LINKS
|
|
BUSINESS NAME |
CIF / COUNTRY |
% |
SOURCE |
DATA INF. |
|
|
PRYSMIAN ENERGIA HOLDING SRL |
ITALY |
Indet. |
OWN SOURCES |
22/02/2008 |
|
|
PRYSMIAN CAVI E SISTEMI TELECOM SRL |
ITALY |
Indet. |
OWN SOURCES |
22/02/2008 |
|
|
BUSINESS NAME |
CIF / COUNTRY |
% |
SOURCE |
DATA INF. |
|
|
FERCABLE SL |
B08241481 |
100,00 |
TRADE REG. |
31/12/2007 |
CREDIT INFORMATION
Constitution Date: 28/12/1984
Activity: Mfg. of insulated electric wires &
cables
NACE Code: 3130
NACE Activity: Manufacture of
insulated wire and cable
Business: FABRICACION,INSTALACION,COMPRA VENTA DE
HILOS Y CABLES ELECTRICOS Y DE TELECOMUNICACIONES Y DE SUS ACCESORIOS
Number of total employees: 504 (2008)
Number of fixed employees: 94,43%
Number of temporary employees: 5,57%
Employees evolution
COMMERCIAL OPERATIONS 
PURCHASES
Payments (estimated):
Imports from: C.E.
SUPPLIERS
|
BUSINESS NAME |
INTERNATIONAL |
|
GRUPO
INTERNACIONAL |
NO |
1 proveedores
SALES
Collection (estimated):
On a credit basis: 90%
Export Percentage: 21%
Exports to: Tunez, Alemania, C.E.
National Distribution: 79%
CLIENTS
|
BUSINESS NAME |
INTERNATIONAL |
|
GRUPO NACIONAL |
NO |
|
GRUPO
INTERNACIONAL |
NO |
2 clientes
Banks 
|
ENTITY |
BRANCH |
ADDRESS |
TOWN OR CITY |
PROVINCE |
|
BANCO BILBAO
VIZCAYA ARGENTARIA, S.A. |
6720 |
RAMBLA PRINCIPAL, 21 |
VILANOVA I LA GELTRU |
Barcelona |
|
BANCO POPULAR
ESPAÑOL, S.A. |
0849 |
RAMBLA PRINCIPAL, 75 |
VILANOVA I LA GELTRU |
Barcelona |
|
BANCO SANTANDER, S.A. |
0193 |
PZ DELS COTXES 7 APDO. 00039 |
VILANOVA I LA GELTRU |
Barcelona |
3 bank entities registered
Brands, Signs and Commercial
Names 
FORMER NAMES:
•
PIRELLI CABLES Y SISTEMAS SL
•
PIRELLI CABLES Y SISTEMAS S.A.
Brand name: SECTORWIND (Valid)
Type: DENOMINATIVE
Date: 05/08/2008
Brand name: SEAWIND (Valid)
Type: DENOMINATIVE
Date: 05/08/2008
Brand name: POWERWIND (Valid)
Type: DENOMINATIVE
Date: 05/08/2008
Brand name: AFUMEX
DUO (Valid)
Type: DENOMINATIVE
Date: 10/04/2008
Brand name: GEOWIND (Valid)
Type: DENOMINATIVE Date: 03/12/2007
LEGAL STRUCTURE
Constitution Data
Register Date: 28/12/1984
Current Legal Form: LIMITED LIABILITY
COMPANY
Current Capital:
14.000.000,00 €
Legal Aspects
Obligation to fill in Financial
Statements: YES
Chamber census: YES (2006)
Listed on a Stock Exchange: NO
B.O.R.M.E.(OFFICIAL COMPANIES REGISTRY GAZETTE) ![]()
Registered Proceedings
|
PROCEEDINGS |
DATE |
NOTICE NUM. |
TRADE REG. |
|
Appointments |
14/08/2008 |
393727 |
Barcelona |
|
Resignations |
29/05/2008 |
266824 |
Barcelona |
|
Appointments |
29/05/2008 |
266824 |
Barcelona |
Other Proceedings published
|
PROCEEDINGS |
DATE |
NOTICE NUM. |
TRADE REG. |
|
Registration of accounts (2007) Individual |
19/05/2008 |
150139 |
Barcelona |
|
Registration of accounts (2007) Consolidated |
19/05/2008 |
146679 |
Barcelona |
Press articles

02/10/2007 EXPANSION DE CATALUNA (INFORMATION ON SENIOR
MANAGEMENT)
DOMINGO GOENAGA HA SIDO SUSTITUIDO EN GENERAL CABLE EN ESPAÑA Y EUROPA
POR MANEL MILA (HASTA AHORA DIRECTOR GRAL. EN ESPAÑA DE PRYSMIAN) COMO PRIMER
EJECUTIVO DE LA CIA.
11/07/2007 EL P. CATALUNYA (INFORMATION ON LEGAL ANNOUNCE)
LOS SOCIOS UNICOS DE PRYSMIAN CABLES Y SISTEMAS SL (SDAD. ABSORBENTE) Y
DE PRYSMIAN TELECOM CABLES Y SISTEMAS ESPAÑA SL (SDAD. ABSORBIDA) ACORDARON EL
29/06/07 LA FUSION POR ABSORCION DE LA ULTIMA POR PARTE DE LA PRIMERA. COMO
CONSECUENCIA, LA SDAD. ABSORBENTE AUMENTA SU CAPITAL SOCIAL EN LA CUANTIA DE
2.000.000 EUROS.
Complementary Information
Segun BORME (SECCION SEGUNDA) de fecha
14/07/98 la sociedad ha
absorbido a PRODUCTOS PIRELLI SA NIF:A08002842.
La sociedad absorbente acordo en la misma Junta de accionistas cambiar
su denominacion por la de PIRELLI CABLES Y SISTEMAS SA.
La sociedad surge como consecuencia de la escision parcial de las
actividades de la division de cables electricos de productos
PIRELLI SA
La Junta General de fecha 15/06/01, acordo la escision parcial de
PIRELLI CABLES Y SISTEMAS SA CIF:A08958381, siendo beneficiaria una
sociedad limitada de nueva creacion que se constituira al efecto,
segun anuncio publicado en Borme Seccion 2 del 31/07/01.
FINANCIAL INFORMATION
The information on the last account contained in this report is
extracted from the Mercantile Register file of the legal address of the Company
and dated 23/05/2008.
BALANCE SHEET
Assets
Figures given in thousands €
|
|
31/12/2005 (12) |
31/12/2006 (12) |
31/12/2007 (12) |
|
A) DUE FROM SHAREHOLDERS FOR UNCALLED CAPITAL |
|
|
|
|
B) FIXED ASSETS |
42.020,00 |
115.233,00 |
127.091,00 |
|
I. Incorporation costs |
|
|
|
|
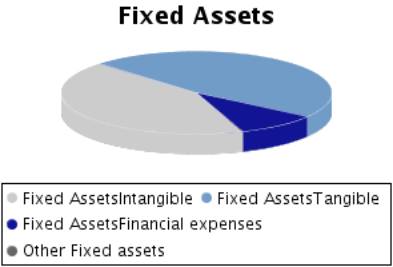
II. Intangible fixed assets |
46,00 |
57.460,00 |
54.422,00 |
|
R & D expenses |
|
|
|
|
Concessions,
patents, licences , trademarks |
|
|
|
|
Goodwill |
|
60.468,00 |
60.468,00 |
|
Acquired rights from finance leases |
|
|
|
|
Software |
850,00 |
850,00 |
850,00 |
|
Leasing |
|
|
|
|
Cash advance |
|
|
|
|
Provisions |
|
|
|
|
Depreciation |
-804,00 |
-3.858,00 |
-6.896,00 |
|
III. Tangible fixed assets |
35.515,00 |
45.295,00 |
60.249,00 |
|
Property, plant and equipment |
25.167,00 |
40.805,00 |
48.422,00 |
|
Machinery, equipment and other |
47.273,00 |
43.880,00 |
67.726,00 |
|
Other property plant and equipment |
2.864,00 |
2.915,00 |
4.272,00 |
|
Prepaid expenses on fixed assets |
84,00 |
85,00 |
3.796,00 |
|
Other assets |
5.256,00 |
5.552,00 |
6.330,00 |
|
Provisions |
|
|
|
|
Depreciation |
-45.129,00 |
-47.942,00 |
-70.297,00 |
|
IV. Financial fixed assets |
6.459,00 |
12.478,00 |
12.420,00 |
|
Shares in affiliated companies |
6.419,00 |
12.353,00 |
12.353,00 |
|
Receivables in affiliated companies |
|
|
|
|
Shares in associated companies |
|
|
|
|
Loans to associated companies |
|
|
|
|
Securities |
3,00 |
|
|
|
Other loans |
|
|
|
|
Long term deposits and guarantees |
37,00 |
125,00 |
67,00 |
|
Provisions |
|
|
|
|
Taxes receivable |
|
|
|
|
V.Owners equity |
|
|
|
|
VI.Long term trade liabilities |
|
|
|
|
C) DEFERRED EXPENSES |
1.450,00 |
6.803,00 |
1.948,00 |
|
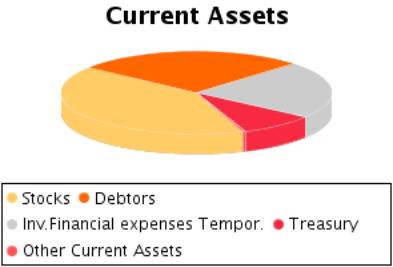
D) CURRENT ASSETS |
122.517,00 |
135.036,00 |
151.320,00 |
|
I. Shareholders by required outlays |
|
|
|
|
II. Stocks |
33.251,00 |
43.648,00 |
61.983,00 |
|
Goods available for sale |
|
|
|
|
Raw material inventory |
6.865,00 |
7.519,00 |
13.738,00 |
|
Work in Progress |
5.635,00 |
5.613,00 |
12.857,00 |
|
Finished goods |
21.925,00 |
32.335,00 |
37.248,00 |
|
Subproducts and recycled materials |
|
|
|
|
Cash advance |
|
|
|
|
Provisions |
-1.174,00 |
-1.819,00 |
-1.860,00 |
|
III. Debtors |
79.784,00 |
84.055,00 |
41.430,00 |
|
Clients |
75.117,00 |
79.228,00 |
39.533,00 |
|
Amounts owned by affiliated companies |
3.262,00 |
1.689,00 |
1.766,00 |
|
Amounts owned by associated companies |
|
|
|
|
Other debts |
2.832,00 |
4.338,00 |
1.272,00 |
|
Staff Expenses |
|
|
|
|
Government |
1.843,00 |
1.527,00 |
1.474,00 |
|
Provisions |
-3.270,00 |
-2.727,00 |
-2.615,00 |
|
IV. Temporary financial investment |
|
|
33.801,00 |
|
Shares in affiliated companies |
|
|
|
|
Receivables in affiliated companies |
|
|
33.801,00 |
|
Shares in associated companies |
|
|
|
|
Loans to associated companies |
|
|
|
|
Short term investment |
|
|
|
|
Other loans |
|
|
|
|
Short Term Deposit and guarantees |
|
|
|
|
Provisions |
|
|
|
|
V. Short-term own shares |
|
|
|
|
VI. Treasury |
6.739,00 |
6.396,00 |
13.609,00 |
|
VII. Periodification adjustments |
2.743,00 |
937,00 |
497,00 |
|
ASSETS (A + B + C + D) |
165.987,00 |
257.072,00 |
280.359,00 |
Assets composition
Liabilities
Figures given in thousands €
|
|
31/12/2005 (12) |
31/12/2006 (12) |
31/12/2007 (12) |
|
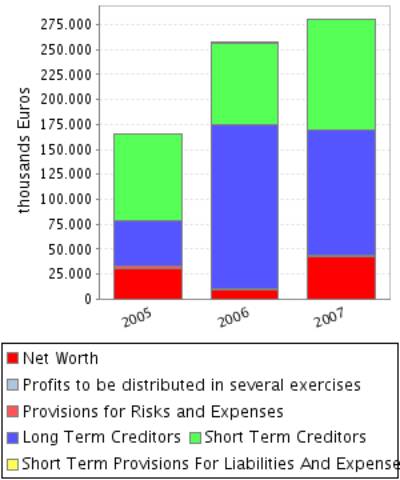
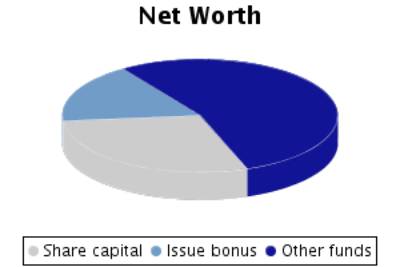
A) SHAREHOLDERS EQUITY |
30.524,00 |
9.255,00 |
42.487,00 |
|
I. Share capital |
12.000,00 |
12.000,00 |
14.000,00 |
|
II. Issue bonus |
|
|
8.266,00 |
|
III.Revaluation reserve |
6.037,00 |
6.037,00 |
|
|
IV.Reserves |
2.704,00 |
12.487,00 |
26.008,00 |
|
Retained earnings |
2.400,00 |
2.400,00 |
2.400,00 |
|
Sinking fund from owner equity |
|
|
|
|
Reserve for the parent company capital |
|
|
|
|
Statutory reserve |
|
|
|
|
Other funds |
304,00 |
10.087,00 |
23.608,00 |
|
Capital adjustments in Euros |
|
|
|
|
V.Results from previous years |
|
-28.753,00 |
-28.753,00 |
|
Carry Over |
|
|
|
|
Prior years losses |
|
-28.753,00 |
-28.753,00 |
|
Loans from partners for losses compensation |
|
|
|
|
VI.Profit and Losses |
9.783,00 |
7.484,00 |
22.966,00 |
|
VII.Dividend paid during the year |
|
|
|
|
VIII.Own shares for capital reduction |
|
|
|
|
B) DEFERRED INCOME |
|
|
|
|
Capital grants |
|
|
|
|
Positive change difference |
|
|
|
|
Other deferred income |
|
|
|
|
Fiscal deferred income |
|
|
|
|
C) PROVISIONS FOR LIABILITIES AND EXPENSES |
2.008,00 |
1.094,00 |
1.287,00 |
|
Provision for pensions plans |
964,00 |
715,00 |
908,00 |
|
Provision for taxes |
|
|
|
|
Other provisions |
1.044,00 |
379,00 |
379,00 |
|
Reversion fund |
|
|
|
|
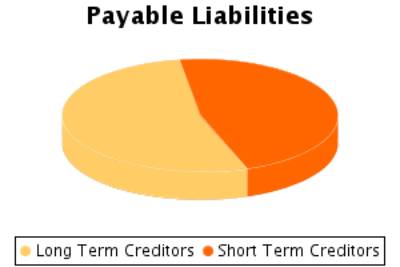
D) LONG TERM LIABILITIES |
45.574,00 |
164.655,00 |
125.603,00 |
|
I.Negotiable bonds and other negotiable values |
|
|
|
|
Non convertible securities |
|
|
|
|
Convertible securities |
|
|
|
|
Other convertible debentures |
|
|
|
|
II.Debt with bank entities |
|
121.000,00 |
120.000,00 |
|
Long term bank loans |
|
121.000,00 |
120.000,00 |
|
Leasing |
|
|
|
|
III.Debts with associated and affiliated
companies |
42.000,00 |
37.056,00 |
|
|
With affiliated companies |
42.000,00 |
37.056,00 |
|
|
Associated companies |
|
|
|
|
IV. Other creditors |
3.574,00 |
6.599,00 |
5.603,00 |
|
Bills payable |
|
|
|
|
Other debts |
1.538,00 |
100,00 |
|
|
Long term deposit and guaranties |
|
|
|
|
Taxes receivable |
2.036,00 |
6.499,00 |
5.603,00 |
|
V. Deferred debts on shares |
|
|
|
|
From affiliated companies |
|
|
|
|
From associated companies |
|
|
|
|
Other companies |
|
|
|
|
VI. Long term debt with creditor |
|
|
|
|
E) SHORT TERM LIABILITIES |
87.137,00 |
81.521,00 |
110.523,00 |
|
I.Negotiable bonds and other negotiable values |
|
|
|
|
Non convertible securities |
|
|
|
|
Convertible securities |
|
|
|
|
Other convertible debentures |
|
|
|
|
Interests from bonds |
|
|
|
|
II.Debt with bank entities |
318,00 |
1.842,00 |
5.968,00 |
|
Loans and other debts |
318,00 |
1.272,00 |
5.398,00 |
|
Debt interest |
|
570,00 |
570,00 |
|
Leasing |
|
|
|
|
III. Short term debts with associated and
affiliated companies |
48.031,00 |
38.666,00 |
44.212,00 |
|
With affiliated companies |
48.031,00 |
38.666,00 |
44.212,00 |
|
Associated companies |
|
|
|
|
IV. Commercial creditors |
26.579,00 |
31.560,00 |
48.201,00 |
|
Accounts payable |
|
|
240,00 |
|
Expenses |
26.579,00 |
31.560,00 |
47.961,00 |
|
Bills payable |
|
|
|
|
V. Other non-commercial debt |
12.150,00 |
9.406,00 |
12.117,00 |
|
Government |
5.666,00 |
4.737,00 |
6.932,00 |
|
Bills payable |
|
|
|
|
Other debts |
4.032,00 |
2.388,00 |
1.070,00 |
|
Accounts receivable |
2.452,00 |
2.281,00 |
4.115,00 |
|
Short term deposits and guarantees |
|
|
|
|
VI. Provisions for current assets |
|
|
|
|
VII. Periodification adjustments |
59,00 |
47,00 |
25,00 |
|
F) SHORT TERM PROVISIONS FOR LIABILITIES AND
EXPENSES |
744,00 |
547,00 |
459,00 |
|
LIABILITIES (A + B + C + D + E + F) |
165.987,00 |
257.072,00 |
280.359,00 |
Liabilities
Composition
PROFIT AND LOSS ACCOUNT
Itams of the Profit and Loss Account
Figures given in thousands €
|
|
31/12/2005 (12) |
31/12/2006 (12) |
31/12/2007 (12) |
|
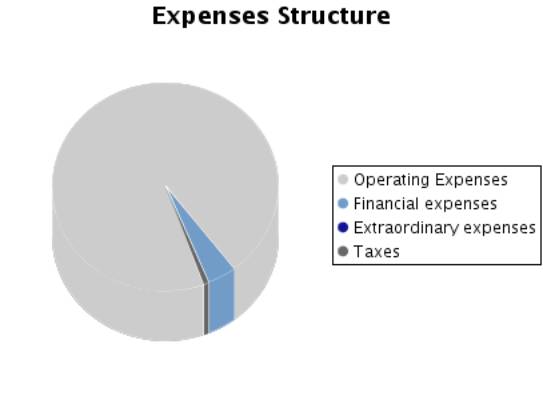
A) EXPENSES (A.1 a A.16) |
293.688,00 |
377.229,00 |
469.297,00 |
|
A.1.Reduction in stocks of finished goods and
work in progress |
2.341,00 |
|
|
|
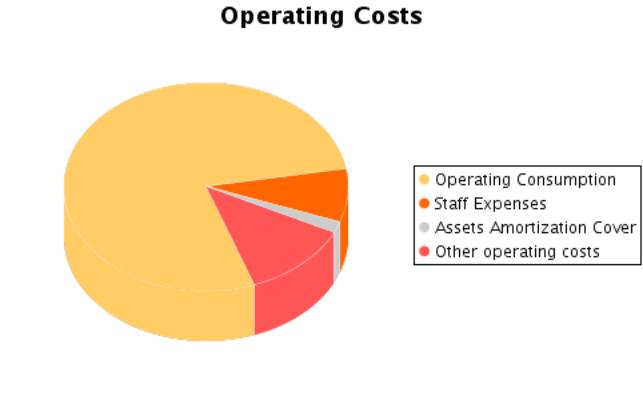
A.2.Supplies |
212.386,00 |
285.171,00 |
350.238,00 |
|
Material consumed |
49.377,00 |
38.042,00 |
52.876,00 |
|
Raw materials consumed |
157.075,00 |
241.578,00 |
282.378,00 |
|
Other expenses |
5.934,00 |
5.551,00 |
14.984,00 |
|
A.3. Labour cost |
25.871,00 |
26.851,00 |
35.896,00 |
|
Wages |
20.410,00 |
21.146,00 |
28.223,00 |
|
Social security expenses |
5.461,00 |
5.705,00 |
7.673,00 |
|
A.4. Assets depreciation |
2.086,00 |
5.904,00 |
7.922,00 |
|
A.5.Variance in the traffic provisions |
|
428,00 |
-666,00 |
|
Variance in provision for inventory |
-58,00 |
645,00 |
-256,00 |
|
Variance in provision for bad debts |
58,00 |
-217,00 |
-410,00 |
|
Variance in provision for other current assets |
|
|
|
|
A.6. Other operating costs |
44.129,00 |
44.757,00 |
53.450,00 |
|
External costs |
43.631,00 |
44.345,00 |
52.816,00 |
|
Taxes |
398,00 |
412,00 |
634,00 |
|
Other day to day expenses |
100,00 |
|
|
|
Allowance to reversion fund |
|
|
|
|
A.I.OPERATING
RESULT (B.1+B.2+B.3+B.4-A.1-A.2-A.3-A.4-A.5-A.6) |
16.584,00 |
21.277,00 |
42.077,00 |
|
A.7.Financial expenses and similar |
2.001,00 |
11.354,00 |
19.216,00 |
|
Debts with related companies |
1.485,00 |
5.299,00 |
1.474,00 |
|
Debts with associated companies |
|
|
|
|
Other companies debts By debts with third parties and similar expenses |
516,00 |
6.055,00 |
17.742,00 |
|
Losses from financial investments |
|
|
|
|
A.8. Variation in financial investment provision |
|
|
|
|
A.9.Negative exchange difference |
|
|
|
|
A.II.POSITIVE FINANCIAL RESULTS
(B.5+B.6+B.7+B.8-A.7-A.8-A.9) |
|
|
|
|
A.III.PROFIT FROM ORDINARY ACTIVITIES
(A.I+A.II-B.I-B.II) |
14.599,00 |
9.942,00 |
25.287,00 |
|
A.10. Variation
in provision in fixed assets |
|
|
|
|
A.11. Losses in
fixed assets |
|
3,00 |
22,00 |
|
A.12. Losses
from own shares and bonds |
|
|
|
|
A.13.
Extraordinary charges |
637,00 |
3,00 |
84,00 |
|
A.14.Other
exercises’ expenses and losses |
|
|
|
|
A.IV.POSITIVE
EXTRAORDINARY RESULT (B.9+B.10+B.11+B.12+B.13-A.10-A.11-A.12-A.13-A.14) |
|
300,00 |
814,00 |
|
A.V.PROFIT BEFORE TAXES (A.III+A.IV-B.III-B.IV) |
14.020,00 |
10.242,00 |
26.101,00 |
|
A.15.Corporate Taxes |
4.237,00 |
2.758,00 |
3.135,00 |
|
A.16. Other taxes |
|
|
|
|
A.VI.EXERCISE RESULT (PROFIT) (A.V-A.14-A.15) |
9.783,00 |
7.484,00 |
22.966,00 |
|
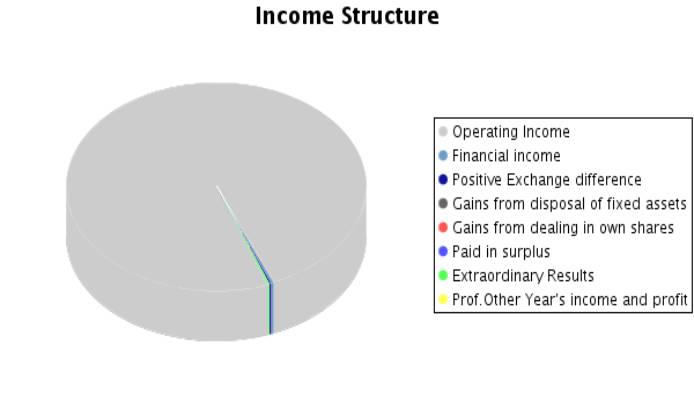
B) INCOMES (B.1 a B13) |
303.471,00 |
384.713,00 |
492.263,00 |
|
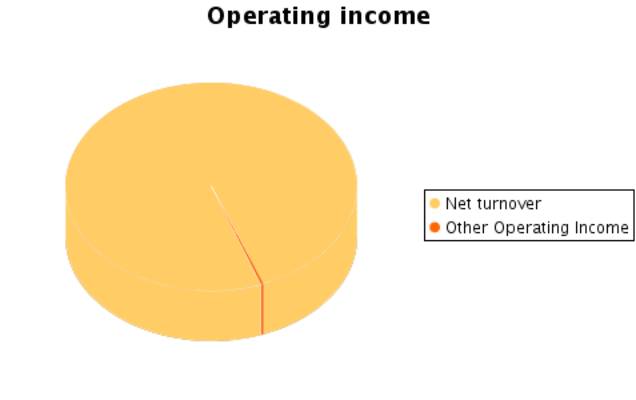
B.1. Turnover |
303.297,00 |
373.893,00 |
478.450,00 |
|
Sales |
315.984,00 |
392.395,00 |
500.689,00 |
|
Services provided |
89,00 |
150,00 |
116,00 |
|
Refunds and sale reminders |
-12.776,00 |
-18.652,00 |
-22.355,00 |
|
B.2.Increase in inventory of finished goods and
works in progress |
|
10.388,00 |
9.126,00 |
|
B.3.Expenses capitalized |
|
|
|
|
B.4. Other operating income |
100,00 |
107,00 |
1.341,00 |
|
Other incomes |
100,00 |
107,00 |
1.341,00 |
|
Grants |
|
|
|
|
Excess in provision for liabilities and charges |
|
|
|
|
B.I.OPERATING
LOSSES (A.1+A.2+A.3+A.4+A.5+A.6-B.1-B.2-B.3-B.4) |
|
|
|
|
B.5.Incomes from share participations |
|
|
|
|
From affiliated companies |
|
|
|
|
From associated companies |
|
|
|
|
From other companies |
|
|
|
|
B.6.Income from other securities and credits to
fixed assets |
|
|
|
|
From affiliated companies |
|
|
|
|
From associated companies |
|
|
|
|
Other companies |
|
|
|
|
B.7.Other interests and similar |
16,00 |
19,00 |
1.344,00 |
|
From affiliated companies |
1,00 |
|
1.327,00 |
|
From associated companies |
|
|
|
|
Other Interests |
15,00 |
19,00 |
17,00 |
|
Profits from investments |
|
|
|
|
B.8. Positive change difference |
|
|
1.082,00 |
|
B.II. NEGATIVE FINANCIAL RESULTS
(A.7+A.8+A.9-B.5-B.6-B.7-B.8) |
1.985,00 |
11.335,00 |
16.790,00 |
|
B.III.LOSSES FROM ORDINARY ACTIVITIES
(B.I+B.II-A.I-A.II) |
|
|
|
|
B.9.B.9. Gains from disposal of fixed assets |
58,00 |
|
18,00 |
|
B.10.Gains from dealing in own shares |
|
|
|
|
B.11. Paid in surplus |
|
|
|
|
B.12. Extraordinary income |
|
306,00 |
902,00 |
|
B.13.Other year’s income and profits |
|
|
|
|
B.IV.NEGATIVE EXTRAORDINARY LOSSES
(A.10+A.11+A.12+A.13+A.14-B.9-B.10-B.11-B.12-B.13) |
579,00 |
|
|
|
B.V.LOSS BEFORE TAXES (B.III+B.IV-A.III-A.IV) |
|
|
|
|
B.VI.EXERCISE RESULTS (LOSS) (B.V+A.14+A.15) |
|
|
|
Composition of the
Profit and Loss Account
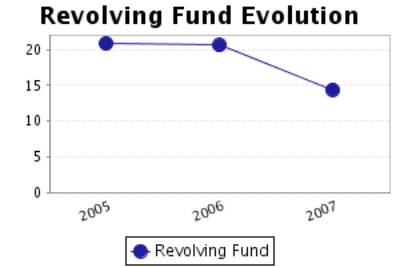
FINANCIAL BALANCE
Here the Main Capital Amounts of the company and the Revolving Fund
Evolution are analysed.
Financial Balance Table
Figures given in thousands €
|
|
31/12/2005 (12) |
% |
31/12/2006 (12) |
% |
31/12/2007 (12) |
% |
|
A) DUE FROM
SHAREHOLDERS FOR UNCALLED CAPITAL |
|
|
|
|
|
|
|
B) FIXED ASSETS |
42.020,00 |
25,32 |
115.233,00 |
44,83 |
127.091,00 |
45,33 |
|
C) DEFERRED
EXPENSES |
1.450,00 |
0,87 |
6.803,00 |
2,65 |
1.948,00 |
0,69 |
|
D) CURRENT
ASSETS |
122.517,00 |
73,81 |
135.036,00 |
52,53 |
151.320,00 |
53,97 |
|
ASSETS (A + B +
C + D) |
165.987,00 |
|
257.072,00 |
|
280.359,00 |
|
|
|
||||||
|
A) SHAREHOLDERS
EQUITY |
30.524,00 |
18,39 |
9.255,00 |
3,60 |
42.487,00 |
15,15 |
|
B) DEFERRED
INCOME |
|
|
|
|
|
|
|
C) PROVISIONS
FOR LIABILITIES AND EXPENSES |
2.008,00 |
1,21 |
1.094,00 |
0,43 |
1.287,00 |
0,46 |
|
D) LONG TERM
LIABILITIES |
45.574,00 |
27,46 |
164.655,00 |
64,05 |
125.603,00 |
44,80 |
|
E) SHORT TERM
LIABILITIES |
87.137,00 |
52,50 |
81.521,00 |
31,71 |
110.523,00 |
39,42 |
|
F) SHORT TERM
PROVISIONS FOR LIABILITIES AND EXPENSES |
744,00 |
0,45 |
547,00 |
0,21 |
459,00 |
0,16 |
|
LIABILITIES (A + B + C + D + E + F) |
165.987,00 |
|
257.072,00 |
|
280.359,00 |
|
Financial Balance
Composition
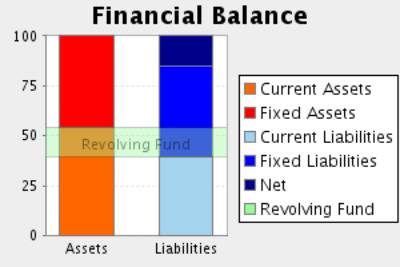
Comments on Financial Balance
In the 2005, the assets of the company were formed in 26,19% of Fixed
Assets and in 73,81% of Current Assets.This assets were financed in 18,39% with
own capitals, and in 28,67% with long term debt and in 52,94% with current
liabilities.
The result of this financial structure is a positive turnover fund of
34.636,00 Euros, which is equivalent to 20,87% proportion of the
company’s total assets.
In the 2006, the assets of the company were formed in 47,47% of Fixed
Assets and in 52,53% of Current Assets.This assets were financed in 3,60% with
own capitals, and in 64,48% with long term debt and in 31,92% with current
liabilities.
The result of this financial structure is a positive turnover fund of
52.968,00 Euros, which is equivalent to 20,60% proportion of the
company’s total assets.
This measure has increased with respect to the previous exercise in
52,93% having, however, diminished its proportion with respect to the total
assets of the company.
In the 2007, the assets of the company were formed in 46,03% of Fixed
Assets and in 53,97% of Current Assets.This assets were financed in 15,15% with
own capitals, and in 45,26% with long term debt and in 39,59% with current
liabilities.
The result of this financial structure is a positive turnover fund of
40.338,00 Euros, which is equivalent to 14,39% proportion of the
company’s total assets.
This measure has diminished with respect to the previous exercise in
23,84% having also diminished its proportion with respect to the total assets
of the company.
RATIOS
Main Ratios
|
|
31/12/2005 (12) |
31/12/2006 (12) |
31/12/2007 (12) |
|
STRUCTURAL RATIOS |
|
|
|
|
Management fund |
34.636,00 |
52.968,00 |
40.338,00 |
|
Management Fund Requirement |
28.215,00 |
48.414,00 |
-1.104,00 |
|
Indebtedness (%) |
81,61 |
96,40 |
84,85 |
|
External Funds on Net Worth |
4,44 |
26,78 |
5,60 |
|
GENERAL ACTIVITY RATIO |
|
|
|
|
Turnover Increase (%) |
20,75 |
23,28 |
27,96 |
|
Added value growth (%) |
4,98 |
22,27 |
56,50 |
|
Cash Flow |
11.869,00 |
13.816,00 |
30.222,00 |
|
Labour Productivity |
1,72 |
2,03 |
2,37 |
|
Assets turnover |
1,83 |
1,45 |
1,71 |
|
Breakdown Point |
246.652,49 |
293.796,02 |
334.216,21 |
|
Security Margin of the Breakdown Point (%) |
18,70 |
21,44 |
30,34 |
|
ACTIVITY RATIOS |
|
|
|
|
Average Payment Period |
45 |
41 |
51 |
|
Average Collection Period |
95 |
81 |
31 |
|
Inventory Turnover Period |
39 |
42 |
47 |
|
SOLVENCY RATIOS |
|
|
|
|
Payback Capacity |
0,09 |
0,06 |
0,13 |
|
Assets Guarantee |
1,22 |
1,01 |
1,17 |
|
Short Term Debts Proportion (%) |
64,88 |
33,12 |
46,66 |
|
Interest Coverage |
5,90 |
0,27 |
0,92 |
|
LIQUIDITY RATIOS |
|
|
|
|
Current Ratio |
1,39 |
1,64 |
1,36 |
|
Immediate liquidity |
0,08 |
0,08 |
0,43 |
|
Treasury |
6.421,00 |
4.554,00 |
41.442,00 |
|
Sales on Current Assets |
891 |
997 |
1.138 |
Results Analysis
Ratios
|
|
31/12/2005 (12) |
31/12/2006 (12) |
31/12/2007 (12) |
|
Economic profitability (%) |
9,99 |
8,28 |
15,01 |
|
Operating Profitability (%) |
5,47 |
5,69 |
8,79 |
|
Equity gearing |
4,79 |
12,98 |
3,97 |
|
Financial profitability (%) |
32,05 |
80,86 |
54,05 |
|
General Profitability (%) |
3,23 |
2,00 |
4,80 |
Comments on the
Results Analysis Ratios
The economic profitability in the year2006 achieved a 8,28% positive
level, due to a 5,69% economic margin and to an assets turnover of1,45%.
The economic profitability in the year has reduced from 9,99% up to
8,28% of2006, even if it remains positive. The decrease in assets turnover from
1,83% to the current level of 1,45has provoked this drop, which has not been
compensated by the parallel increase of the economic margin from 5,69% to
5,47%.
Financial profitability on 2006 achieved a 80,86%.
The company’s financial structure has instigated its economic
profitability with an indebtedness level of 12,98.
The general profitability on 2006 achieved a 2,00%.
The economic profitability in the year2007 achieved a 15,01% positive
level, due to a 8,79% economic margin and to an assets turnover of1,71%.
The economic profitability in the year has increased from 8,28% up to
15,01%. This growth is due to the economic margin increase, from 5,69% to the
current 8,79Y%, and to the assets turnover index, which in the last period has
achieved 1,71, compared to 1,45 del 2006.
Financial profitability on 2007 achieved a 54,05%.
The company’s financial structure has instigated its economic
profitability with an indebtedness level of 3,97.
The general profitability on 2007 achieved a 4,80%.
SECTORIAL ANÁLYSIS
Large Capital Amounts and Financial Balance
Figures given in %
|
|
COMPANY (2007) |
SECTOR |
DIFFERENCE |
DIFFERENCE RELATIVE |
|
|
|
|
|
|
ASSETS |
|
|
|
|
|
|
|
|
|
|
A) DUE FROM
SHAREHOLDERS FOR UNCALLED CAPITAL |
|
0,00 |
|
|
|
|
|
|
|
|
B) FIXED ASSETS |
45,33 |
33,25 |
12,08 |
36,34 |
|
|
|
|
|
|
C) DEFERRED
EXPENSES |
0,69 |
0,30 |
0,39 |
128,48 |
|
|
|
|
|
|
D) CURRENT ASSETS |
53,97 |
66,45 |
-12,48 |
-18,78 |
|
|
|
|
|
|
ASSETS (A + B + C + D) |
100 |
100 |
|
|
|
|
|
|
|
|
|
|
|
|
|
|
|
|
|
|
|
|
COMPANY (2007) |
SECTOR |
DIFFERENCE |
DIFFERENCE RELATIVE |
|
|
|
|
|
|
LIABILITIES |
|
|
|
|
|
|
|
|
|
|
A) SHAREHOLDERS
EQUITY |
15,15 |
36,03 |
-20,88 |
-57,96 |
|
|
|
|
|
|
B) DEFERRED
INCOME |
|
0,13 |
|
|
|
|
|
|
|
|
C) PROVISIONS
FOR LIABILITIES AND EXPENSES |
0,46 |
0,32 |
0,14 |
44,20 |
|
|
|
|
|
|
D) LONG TERM
LIABILITIES |
44,80 |
8,41 |
36,39 |
432,89 |
|
|
|
|
|
|
E) SHORT TERM
LIABILITIES |
39,42 |
54,64 |
-15,22 |
-27,85 |
|
|
|
|
|
|
F) SHORT TERM
PROVISIONS FOR LIABILITIES AND EXPENSES |
0,16 |
0,47 |
-0,31 |
-66,03 |
|
|
|
|
|
|
LIABILITIES (A + B + C + D + E + F) |
100 |
100 |
|
|
|
|
|
|
|
Sectorial Financial
Balance Comparison
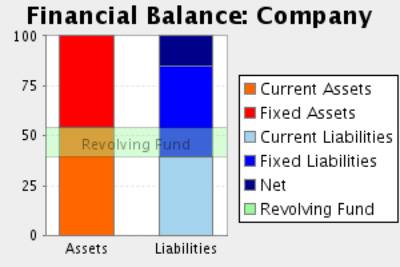
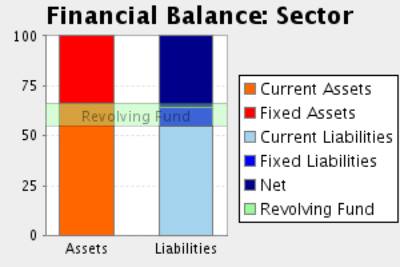
Comments to the Sectorial Analysis
In the 2007, the assets of the company were formed in 46,03% of fixed
assets and in 53,97Current Assets % In the sector, the proportion of fixed
assets was of 33,55%, 37,20% inferior, and the proportion of current assets was
of 66,45%, 18,78% superior.
The assets were financed in the company in 15,15% with own capitals , in
45,26% with fixed liabilities and in 39,59% with current liabilities In the
sector, the self financing represented 36,17%, 58,11% superior. On the other
hand the long term debts represented in the sector an average of 8,73%
financing, with a relative difference of 418,68% in favour of the companyAnd,
short term liabilities represented in the sector an average of 55,11%
financing, with a relative difference of 28,16% favourable to the sector
The result of this company’s financial structure is a turnover fund that
represents 14,39% of the total assets; in the sector, this same proportion is
11,34%, therefore, we can say that the company’s turnover fund is 26,86% higher
than the one in of the sector.
Analytical Account of Results
Figures given in %
|
|
COMPANY (2007) |
SECTOR |
DIFFERENCE |
DIFFERENCE RELATIVE |
|
Turnover |
99,72 |
98,36 |
1,36 |
1,38 |
|
Other operating income |
0,28 |
1,64 |
-1,36 |
-82,89 |
|
Production Value |
100,00 |
100,00 |
0,00 |
0,00 |
|
Operating expenses |
71,10 |
69,35 |
1,75 |
2,52 |
|
Other operation expenses |
11,14 |
9,87 |
1,27 |
12,83 |
|
Added value |
17,76 |
20,77 |
-3,01 |
-14,50 |
|
Labour cost |
7,48 |
12,60 |
-5,12 |
-40,62 |
|
Gross Economic Result |
10,28 |
8,18 |
2,10 |
25,73 |
|
Assets depreciation |
1,65 |
2,00 |
-0,35 |
-17,42 |
|
Variation in provision for current assets and bad debt losses |
-0,14 |
-0,02 |
-0,12 |
775,00 |
|
Net Economic Result |
8,77 |
6,19 |
2,58 |
41,59 |
|
Financial income |
0,51 |
0,27 |
0,24 |
89,59 |
|
Financial Charges |
4,01 |
0,57 |
3,44 |
605,99 |
|
Variation in financial investment provision |
|
-0,10 |
|
|
|
Ordinary Activities Result |
5,27 |
6,00 |
-0,73 |
-12,15 |
|
Extraordinary income |
0,19 |
0,17 |
0,02 |
13,77 |
|
Extraordinary charges |
0,02 |
0,16 |
-0,14 |
-87,50 |
|
Variation in provision in fixed assets |
|
0,75 |
|
|
|
Results before Taxes |
5,44 |
5,26 |
0,18 |
3,50 |
|
Corporate taxes |
0,65 |
1,60 |
-0,95 |
-59,35 |
|
Net Result |
4,79 |
3,66 |
1,13 |
30,98 |
|
Assets depreciation |
1,65 |
2,00 |
-0,35 |
-17,42 |
|
Change of Provisions |
-0,14 |
0,63 |
-0,77 |
-122,19 |
|
Net Self-Financing |
6,30 |
6,29 |
0,01 |
0,22 |
Main Ratios
|
|
COMPANY (2007) |
PTILE25 |
PTILE50 |
PTILE75 |
|
STRUCTURAL RATIOS |
|
|
|
|
|
Management fund |
40.338,00 |
7.139,75 |
15.070,23 |
24.004,83 |
|
Management Fund Requirement |
-1.104,00 |
-5.462,29 |
2.027,38 |
8.259,76 |
|
Indebtedness (%) |
84,85 |
52,75 |
58,76 |
81,97 |
|
External Funds on Net Worth |
5,60 |
1,12 |
1,43 |
4,55 |
|
GENERAL ACTIVITY
RATIO |
|
|
|
|
|
Turnover Increase (%) |
27,96 |
12,09 |
20,20 |
28,22 |
|
Added value growth (%) |
56,50 |
-8,94 |
8,98 |
20,73 |
|
Cash Flow |
30.222,00 |
2.548,61 |
5.763,21 |
18.803,25 |
|
Labour Productivity |
2,37 |
1,40 |
1,68 |
1,96 |
|
Assets turnover |
1,71 |
1,26 |
1,52 |
1,77 |
|
Breakdown Point |
334.216,21 |
51.555.551,01 |
115.171.955,72 |
282.005.579,84 |
|
Security Margin of the Breakdown Point (%) |
30,34 |
8,43 |
17,10 |
24,12 |
|
ACTIVITY RATIOS |
|
|
|
|
|
Average Payment Period |
51 |
53 |
70 |
131 |
|
Average Collection Period |
31 |
94 |
113 |
122 |
|
Inventory Turnover Period |
47 |
38 |
45 |
71 |
|
SOLVENCY RATIOS |
|
|
|
|
|
Payback Capacity |
0,13 |
0,08 |
0,14 |
0,19 |
|
Assets Guarantee |
1,17 |
1,20 |
1,70 |
1,90 |
|
Short Term Debts Proportion (%) |
46,66 |
83,34 |
92,53 |
95,91 |
|
Interest Coverage |
0,92 |
3,71 |
8,97 |
24,69 |
|
LIQUIDITY RATIOS |
|
|
|
|
|
Current Ratio |
1,36 |
1,13 |
1,37 |
1,62 |
|
Immediate liquidity |
0,43 |
0,04 |
0,06 |
0,15 |
|
Treasury |
41.442,00 |
-11.279,91 |
2.974,66 |
9.590,50 |
|
Sales on Current Assets |
1.138 |
647 |
754 |
829 |
Results Analysis
Ratios
|
|
COMPANY (2007) |
PTILE25 |
PTILE50 |
PTILE75 |
|
Economic profitability (%) |
15,01 |
2,53 |
6,79 |
11,58 |
|
Operating Profitability (%) |
8,79 |
2,14 |
4,25 |
8,23 |
|
Equity gearing |
3,97 |
1,77 |
2,26 |
2,81 |
|
Financial profitability (%) |
54,05 |
3,99 |
10,84 |
24,10 |
|
General Profitability (%) |
4,80 |
1,26 |
3,23 |
4,40 |
FOREIGN EXCHANGE
RATES
|
Currency |
Unit
|
Indian Rupees |
|
US Dollar |
1 |
Rs.49.90 |
|
UK Pound |
1 |
Rs.74.30 |
|
Euro |
1 |
Rs.63.42 |
RATING
EXPLANATIONS
|
RATING |
STATUS |
PROPOSED CREDIT LINE |
|
|
>86 |
Aaa |
Possesses an extremely sound financial base with the strongest
capability for timely payment of interest and principal sums |
Unlimited |
|
71-85 |
Aa |
Possesses adequate working capital. No caution needed for credit transaction.
It has above average (strong) capability for payment of interest and
principal sums |
Large |
|
56-70 |
A |
Financial & operational base are regarded healthy. General unfavourable
factors will not cause fatal effect. Satisfactory capability for payment of
interest and principal sums |
Fairly Large |
|
41-55 |
Ba |
Overall operation is considered normal. Capable to meet normal
commitments. |
Satisfactory |
|
26-40 |
B |
Unfavourable & favourable factors carry similar weight in credit
consideration. Capability to overcome financial difficulties seems
comparatively below average. |
Small |
|
11-25 |
Ca |
Adverse factors are apparent. Repayment of interest and principal sums
in default or expected to be in default upon maturity |
Limited with
full security |
|
<10 |
C |
Absolute credit risk exists. Caution needed to be exercised |
Credit not
recommended |
|
NR |
In view of the lack of information, we have no basis upon which to
recommend credit dealings |
No Rating |
|
This score serves as a reference to assess SC’s credit risk
and to set the amount of credit to be extended. It is calculated from a composite
of weighted scores obtained from each of the major sections of this report. The
assessed factors and their relative weights (as indicated through %) are as
follows:
Financial
condition (40%) Ownership
background (20%) Payment
record (10%)
Credit history
(10%) Market trend
(10%) Operational
size (10%)