![]()
MIRA
INFORM REPORT
|
Report Date : |
03.12.2008 |
IDENTIFICATION
DETAILS
|
Name : |
SFERA JOVEN S.A. |
|
|
|
|
Registered Office : |
|
|
|
|
|
Country : |
Spain |
|
|
|
|
Financials (as on) : |
28.02.2007 |
|
|
|
|
Date of Incorporation : |
|
|
|
|
|
Legal Form : |
Joint Stock Company |
|
|
|
|
Line of Business : |
RATING &
COMMENTS
|
MIRA’s Rating : |
B |
|
RATING |
STATUS |
PROPOSED CREDIT LINE |
|
|
26-40 |
B |
Unfavourable & favourable factors carry similar weight in credit
consideration. Capability to overcome financial difficulties seems
comparatively below average. |
Small |
|
Maximum Credit Limit : |
500.000,00 € |
|
|
|
|
Status : |
Moderate |
|
|
|
|
Payment Behaviour : |
Slow |
|
|
|
|
Litigation : |
Exists |
FINANCIAL REPORT
SFERA JOVEN S.A.
TAX NUMBER: A83036137
EXECUTIVE SUMMARY
Identification
Current Business Name: SFERA JOVEN S.A.
Commercial Name: SFERA JOVEN, S.A.
Other names: YES
Current Address: STREET HERMOSILLA, 112, CP 28009 MADRID
Branches: 30
Telephone number: 917748200 Fax: 917748311
URL: www.elcorteingles.es;www.sfera.com
Commercial Risk
Credit Appraisal: 500.000,00 €
RAI: NO
Legal Actions: YES
Financial Information
Latest Balance sheet sales (2007): 106.613.925,00 € (MERCANTILE REGISTER)
Result: -1.585.747 €
Total Assets: 183.386.607 €
Social Capital: 70.000.000,00 €
Employees: 1.045
Commercial Information
Constitution Date: 22/06/2001
Business activity: Retail sale
of clothes
NACE Code: 5242
International Operations: Imports and
Exports
Corporate Structure
President:
Parent Company:
Participations: 1
Other Complementary Information
Latest proceeding published in BORME: 04/08/2008 Appointments
Latest press article: 12/07/2008 GACETA
NEG (BRANCHES INFORMATION)
Bank Entities: Yes
Credit Appraisal
Maximum Credit
Favourable to 500.000,00 €
Rating Evolution
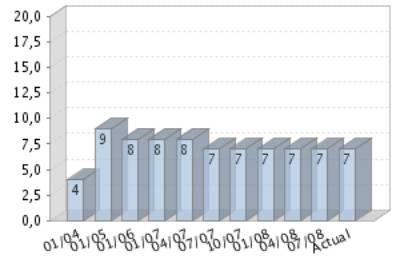
Financial Situation
Fiscal year2007
|
Treasury |
Very degraded |
|
Indebtedness |
Weak |
|
Profitability |
Unfavourable |
|
Balance |
Very Degraded |
Performance
|
Legal Actions |
None or Negligible |
|
Business
Trajectory |
Excellent |
RAI 
COMPANY NOT REGISTERED IN THE R.A.I.
This company is not registered in the Disputed Bills register (R.A.I.)
DATE AND TIME OF THE CONSULTATION: 18/08/2008
08:08:33
INCIDENTS

Summary
LEGAL ACTIONS: No legal incidences registered
|
CLAIM FILED
AGAINST THE ADMINISTRATION: 11 ( First: 22/03/2006, last:
22/03/2006 )With the Social Security: |
11 |
|
With the Tax
Authorities: |
0 |
|
With Other
Official bodies: |
0 |
AFFECTED BY: No significant element.
Last claim filed against the
administration
Figures expressed in €
WITH THE SOCIAL SECURITY
11 claim(s)
Notifications
|
DATE |
ORGANIZATION |
AMOUNT |
|
22/03/2006 |
FACTORY INSPECTION/ SOCIAL SECURITY DE LA RIOJA |
186,91 |
|
22/03/2006 |
FACTORY INSPECTION/ SOCIAL SECURITY DE LA RIOJA |
362,11 |
|
22/03/2006 |
FACTORY INSPECTION/ SOCIAL SECURITY DE LA RIOJA |
387,40 |
FINANCIAL ELEMENTS AND SECTORIAL
COMPARATIVE
FINANCIAL ELEMENTS
Figures given in €
|
|
2005 (12) |
2006 (12) |
2007 (12) |
% ASSETS |
|
|
|
|
|
|
BALANCE SHEET
ANALYSIS |
|
|
|
|
|
|
|
|
|
|
OWN FUNDS |
39.674.526,00 |
40.257.996,00 |
79.672.249,00 |
43,44 |
|
|
|
|
|
|
DEBT |
51.625.710,00 |
89.890.981,00 |
103.714.358,00 |
56,56 |
|
|
|
|
|
|
FIXED ASSETS |
75.724.315,00 |
110.113.943,00 |
145.923.571,00 |
79,57 |
|
|
|
|
|
|
TOTAL ASSETS |
91.300.236,00 |
130.148.977,00 |
183.386.607,00 |
|
|
|
|
|
|
|
|
|
|
|
|
|
|
|
|
|
|
|
2005 (12) |
2006 (12) |
2007 (12) |
% SALES |
|
|
|
|
|
|
PROFIT AND LOSS
ACCOUNT ANALYSIS |
|
|
|
|
|
|
|
|
|
|
SALES |
45.155.200,00 |
77.549.220,00 |
106.613.925,00 |
|
|
|
|
|
|
|
ADDED VALUE |
13.659.210,00 |
23.995.837,00 |
21.206.836,00 |
19,89 |
|
|
|
|
|
|
EBITDA |
4.341.544,00 |
8.384.772,00 |
-1.142.479,00 |
-1,07 |
|
|
|
|
|
|
EBIT |
-441.696,00 |
199.897,00 |
-10.553.817,00 |
-9,90 |
|
|
|
|
|
|
NET RESULT |
377.633,00 |
583.470,00 |
-1.585.747,00 |
-1,49 |
|
|
|
|
|
Balance Sheets Items
Analysis


Balance Sheet Comments
Total assets of the company grew 42,55% between 2005 and 2006.
This growth is a consequence of the fixed assets increase of 45,41%.
This growth has been mainly financed with a debt increase of 74,12%.
Nevertheless the net worth increased 1,47%.
Total assets of the company grew 40,91% between 2006 and 2007.
This growth has been inferior in the case of the fixed assets that
increased just in 32,52%.
This growth has been financed, on a wider scale, with a Shareholders’
equity increase of 97,90% and in a smaller proportion with an debt increase of
15,38%.
Profit and Loss Account Analysis


Profit and Loss Account Comments
The company’s sales figure grew 71,74% between 2005 and 2006.
The company’s EBIT grew 145,26% between 2005 and 2006.
This evolution implies an increase in the company’s operating
profitability.
The result of these variations is an increase of the company’s Economic
Profitability of 131,75% in the analysed period, being this profitability of
0,15% in the year 2006.
The company’s Net Result grew 54,51% between 2005 and 2006.
This evolution, compared to the EBIT’s performance, implies that the
financial and extraordinary activities have had a negative effect in the
company’s Financial Profitability.
The result of these variations is an increase of the company’s Economic
Profitability of 52,27% in the analysed period, being equal to 1,45% in the
year 2006.
The company’s sales figure grew 37,48% between 2006 and 2007.
The company’s EBIT decreased in 5.379,63% between 2006 and 2007.
This evolution implies a reduction in the company’s operating
profitability.
The result of these variations is a decrease of the company’s Economic
Profitability of 3.846,74% in the analysed period, being this profitability of
-5,76% in the year 2007.
The company’s Net Result decreased in 371,78% between 2006 and 2007.
This evolution, compared to the EBIT’s performance, implies that the
financial and extraordinary activities have had a positive effect in the
company’s Financial Profitability.
The result of these variations is a reduction of the company’s
profitability of 237,33% in the analysed period, being equal to -1,99% in the
year 2007.
ANNUAL FINANCIAL REPORT ADDITIONAL DATA
Source: annual financial report 2006
Results Distribution
Figures given in €
|
DISTRIBUTION
BASE |
DISTRIBUTION TO |
||
|
Profit and Loss |
583.469,90 |
Retained earnings |
583.469,90 |
|
Carry Over |
0,00 |
Voluntary Reserve |
0,00 |
|
Voluntary reserves |
0,00 |
Prior years losses |
0,00 |
|
Reserves |
0,00 |
Carry Over |
0,00 |
|
Other concepts |
0,00 |
Other funds |
0,00 |
|
Total of Amounts to be distributed |
583.469,90 |
Dividends |
0,00 |
|
|
|
Other Applications |
0,00 |
Auditing
Auditors’ opinion: FAVOURABLE
Auditor: DELOITTE SL
COMPARATIVE SECTOR ANALYSIS
Values table
Figures expressed in %
|
|
COMPANY (2007) |
SECTOR |
DIFFERENCE |
DIFFERENCE RELATIVE |
|
|
|
|
|
|
BALANCE SHEET
ANALYSIS: % on the total assets |
|
|
|
|
|
|
|
|
|
|
OWN FUNDS |
43,44 |
41,87 |
1,57 |
3,76 |
|
|
|
|
|
|
DEBT |
56,56 |
58,13 |
-1,57 |
-2,71 |
|
|
|
|
|
|
FIXED ASSETS |
79,57 |
59,06 |
20,52 |
34,74 |
|
|
|
|
|
|
|
|
|
|
|
|
|
|
|
|
|
|
COMPANY (2007) |
SECTOR |
DIFFERENCE |
DIFFERENCE RELATIVE |
|
|
|
|
|
|
PROFIT AND LOSS
ACCOUNT ANALYSIS: % on the total operating income |
|
|
|
|
|
|
|
|
|
|
SALES |
82,10 |
98,31 |
-16,21 |
-16,49 |
|
|
|
|
|
|
ADDED VALUE |
16,33 |
26,37 |
-10,04 |
-38,06 |
|
|
|
|
|
|
EBIT |
-8,13 |
10,56 |
-18,69 |
-176,95 |
|
|
|
|
|
|
NET RESULT |
-1,22 |
7,12 |
-8,34 |
-117,16 |
|
|
|
|
|
Sector Composition
Compared sector (NACE): 524
Number of companies: 53
Size (Sales Figure) : > 40.000.000,00 Euros
Comments on the sectorial comparative
Compared to its sector the assets of the companies show a greater
proportion of fixed assets. Specifically the difference with the sector average
is 20,52% , which means a relative difference of 34,74% .
In liabilities composition the company appeals on a wider scale to self
financing, being the proportion of net worth of 1,57% superior, which means a
relative difference of 3,76% . As a consequence, external financing sources are
less used by the company in 1,57% less than the sector, which means a
difference of 2,71% .
The proportion that the sales mean to the company’s total ordinary
income is 82,10%, 16,21% lower than in the sector, which means a relative
difference of 16,49% .
The company’s EBIT was negative and equal to-8,13% with regard to the
total ordinary income, 18,69% less than the sector, which means a relative
difference of 176,95% .
The company’s capacity to generate operating income is equal to that of
the sector as its ratio EBIT/Sales is also equal.
The company’s net result was negative and equal to -1,22% with regard to
the total ordinary income, 8,34% less than the sector, which means a relative
difference of 117,16% .
The financial and extraordinary results and the tax impact have had a
negative impact on the Net result in the company with a worse behaviour than in
the sector; as a consequence, the company shows a worse Net Result/EBIT ratio
(REBEmpresa vs. REBSector).
ADDRESSES
Current Legal Seat Address:
STREET HERMOSILLA, 112
28009
MADRID
Characteristics of the current address
Type of premises: store
Property: shared
Property Description: El Corte Ingles, S.A.
Local Situation: main
|
STREET |
POSTAL CODE |
TOWN |
PROVINCE |
|
STREET TOMAS BRETON 62 |
28045 |
MADRID |
Madrid |
|
STREET TRIANA 13 |
35002 |
LAS PALMAS DE GRAN CANARIA |
Palmas (Las) |
|
PASEO DE ALMERIA |
04001 |
ALMERIA |
Almería |
|
STREET CENTRO
COMERCIAL LA CANADA |
29600 |
MARBELLA |
Málaga |
|
STREET CENTRO
COMERCIAL VIALIA |
29000 |
MALAGA |
Málaga |
|
STREET COLON 27 |
46004 |
VALENCIA |
Valencia |
|
STREET ALHONDIGA 4 |
31002 |
PAMPLONA/IRUÑA |
Navarra |
|
AVENIDA FRANCIA CENTRO
COMERCIAL AQUA MULTIESPACIO |
46023 |
VALENCIA |
Valencia |
|
STREET PABLO PICASSO S/N |
28320 |
PINTO |
Madrid |
30 branches registered
CORPORATE STRUCTURE
ADMINISTRATIVE LINKS
Main Board members, Directors and Auditor ![]()
|
POSITION |
SURNAMES AND
NAME |
APPOINTMENT DATE |
|
|
PRESIDENT |
ALVAREZ ALVAREZ ISIDORO |
25/10/2006 |
|
|
MANAGING DIRECTOR |
ALVAREZ ALVAREZ CESAR |
25/10/2006 |
|
|
MANAGING DIRECTOR |
GOMEZ PASTRANA MORALES MANUEL |
25/10/2006 |
|
|
MANAGING DIRECTOR |
GONZALEZ FERNANDEZ DAVID |
25/10/2006 |
|
|
MANAGING DIRECTOR |
HERMOSO ARMADA JUAN |
25/10/2006 |
|
|
MANAGING DIRECTOR |
LASAGA MUNARRIZ FLORENCIO |
25/10/2006 |
|
|
MANAGING DIRECTOR |
MARTINEZ ECHAVARRIA ANSELMO CARLOS |
25/10/2006 |
|
|
AUDITOR |
APPOINTMENT DATE |
||
|
DELOITTE SL |
22/10/2007 |
||
FINANCIAL LINKS
|
|
BUSINESS NAME |
CIF / COUNTRY |
% |
SOURCE |
DATA INF. |
|
|
EL CORTE INGLES S.A. |
A28017895 |
75,00 |
TRADE REG. |
28/02/2007 |
|
|
INDUSTRIAS Y CONFECCIONES SA |
A28057388 |
25,00 |
TRADE REG. |
28/02/2007 |
|
|
BUSINESS NAME |
CIF / COUNTRY |
% |
SOURCE |
DATA INF. |
|
|
MODA JOVEN SFERA MEXICO |
MEXICO |
51,00 |
TRADE REG. |
28/02/2007 |
CREDIT INFORMATION
Constitution Date: 22/06/2001
Activity: Retail sale of clothes
NACE Code: 5242
NACE Activity: Retail sale of clothing
Business: LA COMERCIALIZACION, IMPORTACION, EXPORTACION Y
VENTA AL DETALL O AL POR MAYOR DE PRENDAS DE VESTIR MASCULINAS
Employees 
Number of total employees: 1.045 (2007)
Number of fixed employees: 53,49%
Number of temporary employees: 46,51%
Employees evolution

COMMERCIAL OPERATIONS 
SUPPLIERS
|
BUSINESS NAME |
INTERNATIONAL |
|
EL CORTE INGLES
SA |
NO |
|
VIAJES EL CORTE
INGLES SA |
NO |
|
CENTRO DE
SEGUROS Y SERVICIOS DE CORREDURIA DE SEGUROS SA |
NO |
|
TELECOR SA |
NO |
|
CPI SA |
NO |
5 proveedores
SALES
Collection (estimated):
National Distribution: 100%
CLIENTS
|
BUSINESS NAME |
INTERNATIONAL |
|
FINANCIERA EL
CORTE INGLES EFC SA |
NO |
|
EL CORTE INGLES
SA |
NO |
2 clientes
Banks 
|
ENTITY |
BRANCH |
ADDRESS |
TOWN OR CITY |
PROVINCE |
|
BANCO SANTANDER, S.A. |
|
|
|
|
1 bank entities registered
Brands, Signs and Commercial
Names 
Name: SFERA JOVEN, S.A. (Valid)
Type: DENOMINATIVE Date: 25/07/2001
LEGAL STRUCTURE
Constitution Data
Register Date: 22/06/2001
Register town: Madrid
Announcement number: 285774
Legal form: JOINT STOCK COMPANY
Current structure data 
Current Legal Form: JOINT STOCK COMPANY
Current Capital: 70.000.000,00 €
Legal Aspects
Obligation to fill in Financial Statements: YES
Chamber census: YES (2006)
Listed on a Stock Exchange: NO
B.O.R.M.E.(Official Companies
Registry Gazette) 
Registered Proceedings
|
PROCEEDINGS |
DATE |
NOTICE NUM. |
TRADE REG. |
|
Appointments |
04/08/2008 |
376257 |
Madrid |
|
Appointments |
04/08/2008 |
376256 |
Madrid |
|
Appointments |
04/08/2008 |
376255 |
Madrid |
|
Appointments |
04/08/2008 |
376254 |
Madrid |
|
Resignations |
14/04/2008 |
193694 |
Madrid |
Press articles

12/07/2008 GACETA NEG (BRANCHES INFORMATION)
EL CORTE INGLES SE ENCUENTRA EN CONVERSACIONES CON VARIOS CONSULTORES
INMOBILIARIOS PARA ENCONTRAR UNA BUENA UBICACION A SUS TIENDAS SFERA EN
ALEMANIA Y HOLANDA, DONDE TODAVIA NO CUENTA CON PRESENCIA COMERCIAL. FUENTES
OFICIALES DEL GRUPO ASEGURAN QUE NO EXISTE NINGUNA OPERACION CONCRETA EN ESTE
SENTIDO. EN LA ACTUALIDAD, SFERA DISPONE DE 71 TIENDAS ENTRE ESPAÑA Y EL
EXTRANJERO. RECIENTEMENTE, EL GRUPO EL CORTE INGLES HA ABIERTO LA PRIMERA
TIENDA DE SU ENSEÑA SFERA EN KUWAIT. TRAS LA APERTURA EN REGIMEN DE FRANQUICIA
DE ESTA NUEVA TIENDA, LA CIA. PREVE INAUGURAR OTROS DOS ESTABLECIMIENTOS EN
ARABIA SAUDI.
03/05/2008 EXPANSIÓN (FINANCIAL INFORMATION)
EL CORTE INGLES, PRINCIPAL ACCIONISTA DE SFERA JOVEN CON UN 75% DE SU
CAPITAL, HA DECIDIDO DOTAR A SU CADENA DE MODA DE LOS RECURSOS NECESARIOS PARA
ACELERAR SU PLAN DE EXPANSION. EL PASADO MES DE MARZO, LA ENSEÑA DE EL CORTE
INGLES ACOMETIO UNA AMPLIACION DE CAPITAL DE 30 MM., LO QUE SUPONE ELEVARLO
HASTA LOS 70 MM. DURANTE SU ULTIMO AÑO FISCAL (CERRADO EN FEBRERO DE 2008),
SFERA AUMENTO UN 65% SU RITMO DE APERTURAS CON LA INAUGURACION DE 33 NUEVAS
TIENDAS, FRENTE A LAS 20 DE 2006. A 01/03/08 SFERA CONTABA CON 104
ESTABLECIMIENTOS, 83 CORRESPONDIENTES AL MERCADO ESPAÑOL. EN EL EXTERIOR YA
ESTA PRESENTE EN 6 PAISES TRAS LA ENTRADA EN MEXICO, ARABIA SAUDI Y KUWAIT.
FINANCIAL INFORMATION
The information on the last account contained in this report is
extracted from the Mercantile Register file of the legal address of the Company
and dated 13/12/2007.
BALANCE SHEET
Assets
Figures given in €
|
|
28/02/2005 (12) |
28/02/2006 (12) |
28/02/2007 (12) |
|
A) DUE FROM SHAREHOLDERS FOR UNCALLED CAPITAL |
|
|
|
|
B) FIXED ASSETS |
75.724.315,00 |
110.113.943,00 |
145.923.571,00 |
|
I. Incorporation costs |
2.175.904,00 |
5.486.531,00 |
7.165.059,00 |
|
II. Intangible fixed assets |
1.512.274,00 |
2.053.861,00 |
2.886.057,00 |
|
R & D expenses |
|
|
|
|
Concessions, patents, licences , trademarks |
118.099,00 |
118.099,00 |
211.396,00 |
|
Goodwill |
|
|
|
|
Acquired rights from finance leases |
1.262.125,00 |
1.982.580,00 |
3.064.402,00 |
|
Software |
373.447,00 |
442.482,00 |
486.444,00 |
|
Leasing |
|
|
|
|
Cash advance |
|
|
|
|
Provisions |
|
|
|
|
Depreciation |
-241.397,00 |
-489.300,00 |
-876.185,00 |
|
III. Tangible fixed assets |
69.176.091,00 |
98.737.143,00 |
123.469.430,00 |
|
Property, plant and equipment |
|
|
|
|
Machinery, equipment and other |
1.525.503,00 |
2.070.200,00 |
2.553.865,00 |
|
Other property plant and equipment |
73.012.620,00 |
102.201.466,00 |
135.700.947,00 |
|
Prepaid expenses on fixed assets |
3.462.104,00 |
6.450.626,00 |
4.706.221,00 |
|
Other assets |
|
3.123.745,00 |
5.190.788,00 |
|
Provisions |
|
|
|
|
Depreciation |
-8.824.136,00 |
-15.108.894,00 |
-24.682.391,00 |
|
IV. Financial fixed assets |
2.860.046,00 |
3.836.408,00 |
12.403.025,00 |
|
Shares in affiliated companies |
|
|
7.573.735,00 |
|
Receivables in affiliated companies |
|
|
|
|
Shares in associated companies |
|
|
|
|
Loans to associated companies |
|
|
|
|
Securities |
|
|
|
|
Other loans |
|
|
|
|
Long term deposits and guarantees |
2.860.046,00 |
3.836.408,00 |
4.829.290,00 |
|
Provisions |
|
|
|
|
Taxes receivable |
|
|
|
|
V.Owners equity |
|
|
|
|
VI.Long term trade liabilities |
|
|
|
|
C) DEFERRED EXPENSES |
|
|
|
|
D) CURRENT ASSETS |
15.575.921,00 |
20.035.034,00 |
37.463.036,00 |
|
I. Shareholders by required outlays |
|
|
|
|
II. Stocks |
10.493.194,00 |
12.458.627,00 |
26.605.460,00 |
|
Goods available for sale |
11.258.519,00 |
13.910.934,00 |
26.787.400,00 |
|
Raw material inventory |
|
|
|
|
Work in Progress |
|
|
|
|
Finished goods |
|
|
|
|
Subproducts and recycled materials |
|
|
|
|
Cash advance |
|
|
|
|
Provisions |
-765.325,00 |
-1.452.307,00 |
-181.940,00 |
|
III. Debtors |
3.732.661,00 |
3.396.934,00 |
8.053.802,00 |
|
Clients |
|
|
|
|
Amounts owned by affiliated companies |
|
502.200,00 |
953.590,00 |
|
Amounts owned by associated companies |
|
|
|
|
Other debts |
41.160,00 |
17.126,00 |
562.098,00 |
|
Staff Expenses |
|
|
|
|
Government |
3.691.501,00 |
2.877.608,00 |
6.538.114,00 |
|
Provisions |
|
|
|
|
IV. Temporary financial investment |
3.172,00 |
13.726,00 |
10.726,00 |
|
Shares in affiliated companies |
|
|
|
|
Receivables in affiliated companies |
|
|
|
|
Shares in associated companies |
|
|
|
|
Loans to associated companies |
|
|
|
|
Short term investment |
|
|
|
|
Other loans |
3.172,00 |
|
|
|
Short Term Deposit and guarantees |
|
13.726,00 |
10.726,00 |
|
Provisions |
|
|
|
|
V. Short-term own shares |
|
|
|
|
VI. Treasury |
1.252.539,00 |
2.182.626,00 |
2.364.227,00 |
|
VII. Periodification adjustments |
94.355,00 |
1.983.121,00 |
428.821,00 |
|
ASSETS (A + B + C + D) |
91.300.236,00 |
130.148.977,00 |
183.386.607,00 |
Assets composition


Liabilities
Figures given in €
|
|
28/02/2005 (12) |
28/02/2006 (12) |
28/02/2007 (12) |
|
A) SHAREHOLDERS EQUITY |
39.674.526,00 |
40.257.996,00 |
79.672.249,00 |
|
I. Share capital |
30.000.000,00 |
30.000.000,00 |
40.000.000,00 |
|
II. Issue bonus |
9.000.000,00 |
9.000.000,00 |
40.000.000,00 |
|
III.Revaluation reserve |
|
|
|
|
IV.Reserves |
296.893,00 |
674.526,00 |
1.257.996,00 |
|
Retained earnings |
295.547,00 |
673.180,00 |
1.256.650,00 |
|
Sinking fund from owner equity |
|
|
|
|
Reserve for the parent company capital |
|
|
|
|
Statutory reserve |
|
|
|
|
Other funds |
1.346,00 |
1.346,00 |
1.346,00 |
|
Capital adjustments in Euros |
|
|
|
|
V.Results from previous years |
|
|
|
|
Carry Over |
|
|
|
|
Prior years losses |
|
|
|
|
Loans from partners for losses compensation |
|
|
|
|
VI.Profit and Losses |
377.633,00 |
583.470,00 |
-1.585.747,00 |
|
VII.Dividend paid during the year |
|
|
|
|
VIII.Own shares for capital reduction |
|
|
|
|
B) DEFERRED INCOME |
|
|
|
|
Capital grants |
|
|
|
|
Positive change difference |
|
|
|
|
Other deferred income |
|
|
|
|
Fiscal deferred income |
|
|
|
|
C) PROVISIONS FOR LIABILITIES AND EXPENSES |
|
|
|
|
Provision for pensions plans |
|
|
|
|
Provision for taxes |
|
|
|
|
Other provisions |
|
|
|
|
Reversion fund |
|
|
|
|
D) LONG TERM LIABILITIES |
54.093,00 |
54.093,00 |
54.093,00 |
|
I.Negotiable bonds and other negotiable values |
|
|
|
|
Non convertible securities |
|
|
|
|
Convertible securities |
|
|
|
|
Other convertible debentures |
|
|
|
|
II.Debt with bank entities |
|
|
|
|
Long term bank loans |
|
|
|
|
Leasing |
|
|
|
|
III.Debts with associated and affiliated
companies |
54.093,00 |
54.093,00 |
54.093,00 |
|
With affiliated companies |
54.093,00 |
54.093,00 |
54.093,00 |
|
Associated companies |
|
|
|
|
IV. Other creditors |
|
|
|
|
Bills payable |
|
|
|
|
Other debts |
|
|
|
|
Long term deposit and guaranties |
|
|
|
|
Taxes receivable |
|
|
|
|
V. Deferred debts on shares |
|
|
|
|
From affiliated companies |
|
|
|
|
From associated companies |
|
|
|
|
Other companies |
|
|
|
|
VI. Long term debt with creditor |
|
|
|
|
E) SHORT TERM LIABILITIES |
51.571.617,00 |
89.836.888,00 |
103.660.265,00 |
|
I.Negotiable bonds and other negotiable values |
|
|
|
|
Non convertible securities |
|
|
|
|
Convertible securities |
|
|
|
|
Other convertible debentures |
|
|
|
|
Interests from bonds |
|
|
|
|
II.Debt with bank entities |
|
|
|
|
Loans and other debts |
|
|
|
|
Debt interest |
|
|
|
|
Leasing |
|
|
|
|
III. Short term debts with associated and
affiliated companies |
40.709.092,00 |
65.182.821,00 |
82.023.496,00 |
|
With affiliated companies |
40.709.092,00 |
65.182.821,00 |
82.023.496,00 |
|
Associated companies |
|
|
|
|
IV. Commercial creditors |
1.513.757,00 |
5.149.486,00 |
4.566.362,00 |
|
Accounts payable |
1.513.757,00 |
|
|
|
Expenses |
|
5.149.486,00 |
4.566.362,00 |
|
Bills payable |
|
|
|
|
V. Other non-commercial debt |
9.348.768,00 |
19.504.581,00 |
17.070.407,00 |
|
Government |
384.132,00 |
677.624,00 |
862.328,00 |
|
Bills payable |
7.366.211,00 |
12.776.622,00 |
11.548.071,00 |
|
Other debts |
1.541.549,00 |
5.719.196,00 |
4.514.008,00 |
|
Accounts receivable |
56.876,00 |
331.139,00 |
146.000,00 |
|
Short term deposits and guarantees |
|
|
|
|
VI. Provisions for current assets |
|
|
|
|
VII. Periodification adjustments |
|
|
|
|
F) SHORT TERM PROVISIONS FOR LIABILITIES AND
EXPENSES |
|
|
|
|
LIABILITIES (A + B + C + D + E + F) |
91.300.236,00 |
130.148.977,00 |
183.386.607,00 |
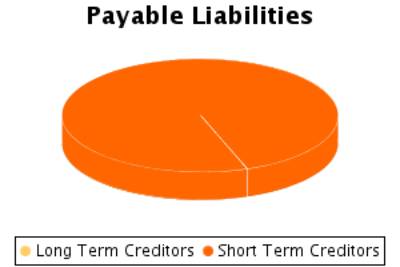
Liabilities
Composition


PROFIT AND LOSS ACCOUNT
Itams of the Profit and Loss Account
Figures given in €
|
|
28/02/2005 (12) |
28/02/2006 (12) |
28/02/2007 (12) |
|
A) EXPENSES (A.1 a A.15) |
58.996.749,00 |
94.623.756,00 |
133.414.422,00 |
|
A.1.Operating costs |
26.821.152,00 |
45.106.602,00 |
64.466.084,00 |
|
A.2. Labour cost |
9.317.666,00 |
15.611.065,00 |
22.349.315,00 |
|
Wages |
9.317.666,00 |
12.145.278,00 |
17.448.087,00 |
|
Social security expenses |
|
3.465.787,00 |
4.901.228,00 |
|
A.3. Assets depreciation |
4.631.577,00 |
7.497.893,00 |
10.681.705,00 |
|
A.4. Variation in provision for current assets |
151.663,00 |
686.982,00 |
-1.270.367,00 |
|
A.5. Other operating costs |
18.224.555,00 |
26.084.989,00 |
44.187.307,00 |
|
A.I. OPERATING RESULT (B.1-A.1-A.2-A.3-A.4-A.5) |
|
199.897,00 |
|
|
A.6.Financial expenses and similar |
470,00 |
682,00 |
571,00 |
|
Debts with related companies |
|
|
|
|
Debts with associated companies |
|
|
|
|
Other companies debts By debts with third parties and similar expenses |
470,00 |
682,00 |
571,00 |
|
Losses from financial investments |
|
|
|
|
A.7. Variation in financial investment provision |
|
|
|
|
A.8.Negative exchange difference |
|
|
|
|
A.II.POSITIVE
FINANCIAL RESULTS (B.2+B.3-A.6-A.7-A.8) |
|
|
3.977,00 |
|
A.III.PROFIT
FROM ORDINARY ACTIVITIES (A.I+A.II-B.I-B.II) |
|
199.820,00 |
|
|
A.9. Variation
in provision in fixed assets |
|
|
|
|
A.10. Losses in fixed assets |
|
|
|
|
A.11. Losses
from own shares and bonds |
|
|
|
|
A.12.
Extraordinary charges |
851,00 |
14.961,00 |
96.156,00 |
|
A.13.Other
exercises’ expenses and losses |
|
|
|
|
A.IV.POSITIVE
EXTRAORDINARY RESULT (B.4+B.5+B.6+B.7+B.8-A.9-A.10-A.11-A.12-A.13) |
668.614,00 |
4.232,00 |
1.867.744,00 |
|
A.V.PROFIT
BEFORE TAXES (A.III+A.IV-B.III-B.IV) |
226.448,00 |
204.052,00 |
|
|
A.14.Corporate
Taxes |
-151.185,00 |
-379.418,00 |
-7.096.349,00 |
|
A.15. Other
taxes |
|
|
|
|
A.VI.EXERCISE
RESULT (PROFIT) (A.V-A.14-A.15) |
377.633,00 |
583.470,00 |
|
|
B) INCOMES (B.1
a B.8) |
59.374.382,00 |
95.207.226,00 |
131.828.675,00 |
|
B.1.Operating income |
58.704.917,00 |
95.187.428,00 |
129.860.227,00 |
|
Turnover |
45.155.200,00 |
77.549.220,00 |
106.613.925,00 |
|
Other operating income |
13.549.717,00 |
17.638.208,00 |
23.246.302,00 |
|
B.I.OPERATING LOSSES (A.1+A.2+A.3+A.4+A.5-B.1) |
441.696,00 |
|
10.553.817,00 |
|
B.2.Financial Income |
|
605,00 |
4.548,00 |
|
From affiliated companies |
|
|
|
|
From associated companies |
|
|
|
|
Other |
|
605,00 |
4.548,00 |
|
Gains from investments |
|
|
|
|
B.3. Positive change difference |
|
|
|
|
B.II. NEGATIVE FINANCIAL RESULTS
(A.6+A.7+A.8-B.2-B.3) |
470,00 |
77,00 |
|
|
B.III.LOSSES FROM ORDINARY ACTIVITIES
(B.I+B.II-A.I-A.II) |
442.166,00 |
|
10.549.840,00 |
|
B.4.B.9. Gains from disposal of fixed assets |
|
|
|
|
B.5.Gains from dealing in own shares |
|
|
|
|
B.6. Paid in surplus |
|
|
|
|
B.7. Extraordinary income |
669.465,00 |
19.193,00 |
1.963.900,00 |
|
B.8.Other year’s income and profits |
|
|
|
|
B.IV.NEGATIVE EXTRAORDINARY LOSSES
(A.9+A.10+A.11+A.12+A.13-B.4-B.5-B.6-B.7-B.8) |
|
|
|
|
B.V.LOSS BEFORE TAXES (B.III+B.IV-A.III-A.IV) |
|
|
8.682.096,00 |
|
B.VI.EXERCISE RESULTS (LOSS) (B.V+A.14+A.15) |
|
|
1.585.747,00 |
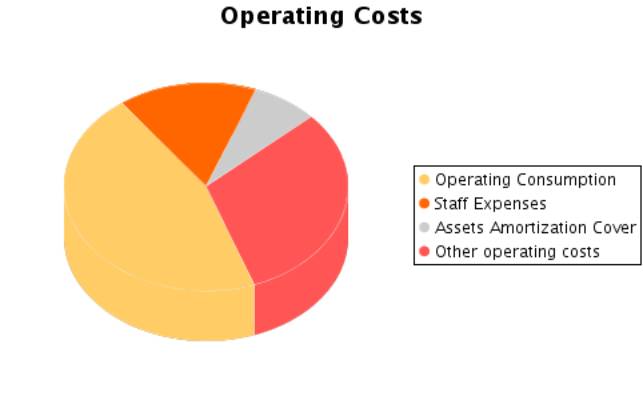
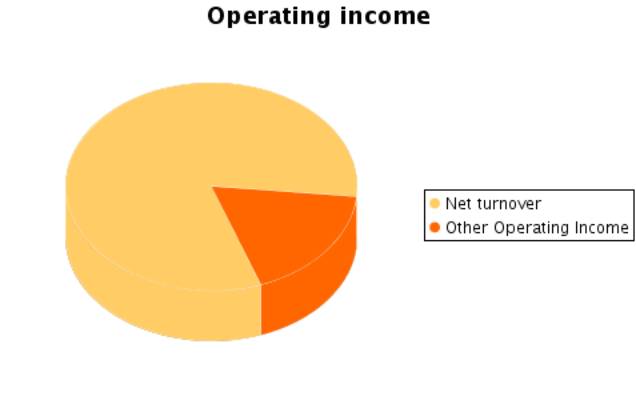
Composition of the
Profit and Loss Account


FINANCIAL BALANCE
Here the Main Capital Amounts of the company and the Revolving
Fund Evolution are analysed.
Financial Balance Table
Figures given in €
|
|
28/02/2005 (12) |
% |
28/02/2006 (12) |
% |
28/02/2007 (12) |
% |
|
A) DUE FROM
SHAREHOLDERS FOR UNCALLED CAPITAL |
|
|
|
|
|
|
|
B) FIXED ASSETS |
75.724.315,00 |
82,94 |
110.113.943,00 |
84,61 |
145.923.571,00 |
79,57 |
|
C) DEFERRED
EXPENSES |
|
|
|
|
|
|
|
D) CURRENT
ASSETS |
15.575.921,00 |
17,06 |
20.035.034,00 |
15,39 |
37.463.036,00 |
20,43 |
|
ASSETS (A + B +
C + D) |
91.300.236,00 |
|
130.148.977,00 |
|
183.386.607,00 |
|
|
|
||||||
|
A) SHAREHOLDERS
EQUITY |
39.674.526,00 |
43,46 |
40.257.996,00 |
30,93 |
79.672.249,00 |
43,44 |
|
B) DEFERRED
INCOME |
|
|
|
|
|
|
|
C) PROVISIONS
FOR LIABILITIES AND EXPENSES |
|
|
|
|
|
|
|
D) LONG TERM
LIABILITIES |
54.093,00 |
0,06 |
54.093,00 |
0,04 |
54.093,00 |
0,03 |
|
E) SHORT TERM
LIABILITIES |
51.571.617,00 |
56,49 |
89.836.888,00 |
69,03 |
103.660.265,00 |
56,53 |
|
F) SHORT TERM
PROVISIONS FOR LIABILITIES AND EXPENSES |
|
|
|
|
|
|
|
LIABILITIES (A + B + C + D + E + F) |
91.300.236,00 |
|
130.148.977,00 |
|
183.386.607,00 |
|
Financial Balance
Composition


Comments on Financial Balance
In the 2005, the assets of the company were formed in 82,94% of Fixed
Assets and in 17,06% of Current Assets.This assets were financed in 43,46% with
own capitals, and in 0,06% with long term debt and in 56,49% with current
liabilities.
The result of this financial structure is a negative turnover fund of
-35.995.696,00 Euros, which is equivalent to -39,43% proportion of the
company’s total assets.
In the 2006, the assets of the company were formed in 84,61% of Fixed
Assets and in 15,39% of Current Assets.This assets were financed in 30,93% with
own capitals, and in 0,04% with long term debt and in 69,03% with current
liabilities.
The result of this financial structure is a negative turnover fund of
-69.801.854,00 Euros, which is equivalent to -53,63% proportion of the
company’s total assets.
This measure has diminished with respect to the previous exercise in
93,92% having also diminished its proportion with respect to the total assets
of the company.
In the 2007, the assets of the company were formed in 79,57% of Fixed
Assets and in 20,43% of Current Assets.This assets were financed in 43,44% with
own capitals, and in 0,03% with long term debt and in 56,53% with current
liabilities.
The result of this financial structure is a negative turnover fund of
-66.197.229,00 Euros, which is equivalent to -36,10% proportion of the
company’s total assets.
This measure has increased with respect to the previous exercise in
5,16% having also increased its proportion with respect to the total assets of
the company.
RATIOS
Main Ratios
|
|
28/02/2005 (12) |
28/02/2006 (12) |
28/02/2007 (12) |
|
STRUCTURAL RATIOS |
|
|
|
|
Management fund |
-35.995.696,00 |
-69.801.854,00 |
-66.197.229,00 |
|
Management Fund Requirement |
-37.251.407,00 |
-71.998.206,00 |
-68.572.182,00 |
|
Indebtedness (%) |
56,54 |
69,07 |
56,56 |
|
External Funds on Net Worth |
1,30 |
2,23 |
1,30 |
|
GENERAL ACTIVITY RATIO |
|
|
|
|
Turnover Increase (%) |
38,92 |
71,74 |
37,48 |
|
Added value growth (%) |
11,82 |
75,68 |
-11,62 |
|
Cash Flow |
5.160.873,00 |
8.768.345,00 |
7.825.591,00 |
|
Labour Productivity |
1,47 |
1,54 |
0,95 |
|
Assets turnover |
0,50 |
0,60 |
0,58 |
|
Breakdown Point |
59.518.175,00 |
94.807.488,55 |
150.818.083,60 |
|
Security Margin of the Breakdown Point (%) |
-1,38 |
0,40 |
-16,14 |
|
ACTIVITY RATIOS |
|
|
|
|
Average Payment Period |
20 |
41 |
26 |
|
Average Collection Period |
30 |
16 |
27 |
|
Inventory Turnover Period |
84 |
58 |
90 |
|
SOLVENCY RATIOS |
|
|
|
|
Payback Capacity |
0,10 |
0,10 |
0,08 |
|
Assets Guarantee |
1,73 |
1,39 |
1,70 |
|
Short Term Debts Proportion (%) |
99,90 |
99,94 |
99,95 |
|
Interest Coverage |
9.556,19 |
12.827,78 |
10.257,69 |
|
LIQUIDITY RATIOS |
|
|
|
|
Current Ratio |
0,30 |
0,22 |
0,36 |
|
Immediate liquidity |
0,02 |
0,02 |
0,02 |
|
Treasury |
1.255.711,00 |
2.196.352,00 |
2.374.953,00 |
|
Sales on Current Assets |
1.044 |
1.393 |
1.025 |
Results Analysis
Ratios
|
|
28/02/2005 (12) |
28/02/2006 (12) |
28/02/2007 (12) |
|
Economic profitability (%) |
-0,48 |
0,15 |
-5,76 |
|
Operating Profitability (%) |
-0,98 |
0,26 |
-9,90 |
|
Equity gearing |
2,30 |
3,23 |
2,30 |
|
Financial profitability (%) |
0,95 |
1,45 |
-1,99 |
|
General Profitability (%) |
0,84 |
0,75 |
-1,49 |
Comments on the
Results Analysis Ratios
The economic profitability in the year2006 achieved a 0,15% positive
level, due to a 0,26% economic margin and to an assets turnover of0,60%.
The economic profitability in the year has passed from a negative level
of -0,48% to its positive current value. This evolution is due to the obtaining
of positive operating profitability of 0,26% in comparison with the previous
negative level of -0,98%. Assets turnover has maintained stable in this period,
with an index of 0,60%.
Financial profitability on 2006 achieved a 1,45%.
The company’s financial structure has instigated its economic
profitability with an indebtedness level of 3,23.
The general profitability on 2006 achieved a 0,75%.
The economic profitability in the year2007The economic profitability in
the year -5,76%, derived from a negative operating profitability of -9,90%.The
assets turnover was 0,58%.
The economic profitability in the year from a positive level of 0,15% to
its current negative level. This evolution is due to the obtaining of a
negative operating profitability of -9,90% in comparison with the current
positive value of 0,26%. Assets turnover has maintained stable in this period,
with an index of 0,58%.
Financial profitability on 2007The economic profitability in the year
-1,99
The company’s financial structure has restrained its financial
profitability with an indebtedness level of 2,30.
The general profitability on 2007The economic profitability in the year
-1,49
SECTORIAL ANÁLYSIS
Large Capital Amounts and Financial Balance
Figures given in %
|
|
COMPANY (2007) |
SECTOR |
DIFFERENCE |
DIFFERENCE RELATIVE |
|
|
|
|
|
|
ASSETS |
|
|
|
|
|
|
|
|
|
|
A) DUE FROM
SHAREHOLDERS FOR UNCALLED CAPITAL |
|
0,00 |
|
|
|
|
|
|
|
|
B) FIXED ASSETS |
79,57 |
59,06 |
20,51 |
34,74 |
|
|
|
|
|
|
C) DEFERRED
EXPENSES |
|
0,18 |
|
|
|
|
|
|
|
|
D) CURRENT
ASSETS |
20,43 |
40,77 |
-20,34 |
-49,89 |
|
|
|
|
|
|
ASSETS (A + B +
C + D) |
100 |
100 |
|
|
|
|
|
|
|
|
|
|
|
|
|
|
|
|
|
|
|
|
COMPANY (2007) |
SECTOR |
DIFFERENCE |
DIFFERENCE RELATIVE |
|
|
|
|
|
|
LIABILITIES |
|
|
|
|
|
|
|
|
|
|
A) SHAREHOLDERS
EQUITY |
43,44 |
40,58 |
2,86 |
7,05 |
|
|
|
|
|
|
B) DEFERRED
INCOME |
|
1,29 |
|
|
|
|
|
|
|
|
C) PROVISIONS
FOR LIABILITIES AND EXPENSES |
|
0,92 |
|
|
|
|
|
|
|
|
D) LONG TERM
LIABILITIES |
0,03 |
12,60 |
-12,57 |
-99,76 |
|
|
|
|
|
|
E) SHORT TERM
LIABILITIES |
56,53 |
44,59 |
11,94 |
26,77 |
|
|
|
|
|
|
F) SHORT TERM
PROVISIONS FOR LIABILITIES AND EXPENSES |
|
0,01 |
|
|
|
|
|
|
|
|
LIABILITIES (A +
B + C + D + E + F) |
100 |
100 |
|
|
|
|
|
|
|
Sectorial Financial
Balance Comparison


Comments to the Sectorial Analysis
In the 2007, the assets of the company were formed in 79,57% of fixed
assets and in 20,43Current Assets % In the sector, the proportion of fixed
assets was of 59,23%, 34,34% inferior, and the proportion of current assets was
of 40,77%, 49,89% superior.
The assets were financed in the company in 43,44% with own capitals , in
0,03% with fixed liabilities and in 56,53% with current liabilities In the
sector, the self financing represented 41,87%, 3,75% inferior. On the other
hand the long term debts represented in the sector an average of 13,53%
financing, with a relative difference of 99,78% favourable to the sectorAnd,
short term liabilities represented in the sector an average of 44,60%
financing, with a relative difference of 26,75% in favour of the company
The result of this company’s financial structure is a turnover fund that
represents -36,10% of the total assets; in the sector, this same proportion is
-3,83%, therefore, we can say that the company’s turnover fund is 842,31%
smaller than the sector one.
Analytical Account of Results
Figures given in %
|
|
COMPANY (2007) |
SECTOR |
DIFFERENCE |
DIFFERENCE RELATIVE |
|
Turnover |
82,10 |
98,31 |
-16,21 |
-16,49 |
|
Other operating income |
17,90 |
1,69 |
16,21 |
960,43 |
|
Production Value |
100,00 |
100,00 |
0,00 |
0,00 |
|
Operating expenses |
49,64 |
58,51 |
-8,87 |
-15,15 |
|
Other operation expenses |
34,03 |
15,13 |
18,90 |
124,95 |
|
Added value |
16,33 |
26,37 |
-10,04 |
-38,06 |
|
Labour cost |
17,21 |
12,00 |
5,21 |
43,45 |
|
Gross Economic Result |
-0,88 |
14,37 |
-15,25 |
-106,12 |
|
Assets depreciation |
8,23 |
3,47 |
4,76 |
137,18 |
|
Variation in provision for current assets and bad debt losses |
-0,98 |
0,34 |
-1,32 |
-389,94 |
|
Net Economic Result |
-8,13 |
10,56 |
-18,69 |
-176,98 |
|
Financial income |
0,00 |
0,78 |
-0,78 |
-100,00 |
|
Financial Charges |
0,00 |
0,81 |
-0,81 |
-100,00 |
|
Variation in financial investment provision |
|
0,04 |
|
|
|
Ordinary
Activities Result |
-8,12 |
10,48 |
-18,60 |
-177,46 |
|
Extraordinary income |
1,51 |
0,40 |
1,11 |
276,56 |
|
Extraordinary charges |
0,07 |
0,37 |
-0,30 |
-81,13 |
|
Variation in provision in fixed assets |
|
0,43 |
|
|
|
Results before Taxes |
-6,69 |
10,08 |
-16,77 |
-166,37 |
|
Corporate taxes |
-5,46 |
2,96 |
-8,42 |
-284,27 |
|
Net Result |
-1,22 |
7,12 |
-8,34 |
-117,14 |
|
Assets depreciation |
8,23 |
3,47 |
4,76 |
137,18 |
|
Change of Provisions |
-0,98 |
0,81 |
-1,79 |
-220,69 |
|
Net Self-Financing |
6,03 |
11,40 |
-5,37 |
-47,10 |
Main Ratios
|
|
COMPANY (2007) |
PTILE25 |
PTILE50 |
PTILE75 |
|
STRUCTURAL RATIOS |
|
|
|
|
|
Management fund |
-66.197.229,00 |
-4.755,94 |
3.725,52 |
14.207,06 |
|
Management Fund
Requirement |
-68.572.182,00 |
-23.223,87 |
-4.001,36 |
2.800,00 |
|
Indebtedness (%) |
56,56 |
40,13 |
63,80 |
73,96 |
|
External Funds on Net Worth |
1,30 |
0,67 |
1,76 |
2,84 |
|
GENERAL ACTIVITY
RATIO |
|
|
|
|
|
Turnover
Increase (%) |
37,48 |
3,25 |
12,57 |
23,87 |
|
Added value
growth (%) |
-11,62 |
2,70 |
18,86 |
27,32 |
|
Cash Flow |
7.825.591,00 |
4.082,45 |
8.477,00 |
14.773,88 |
|
Labour
Productivity |
0,95 |
1,66 |
2,12 |
2,55 |
|
Assets turnover |
0,58 |
1,23 |
1,56 |
2,30 |
|
Breakdown Point |
150.818.083,60 |
47.437.066,19 |
69.334.505,75 |
136.462.714,99 |
|
Security Margin
of the Breakdown Point (%) |
-16,14 |
11,54 |
19,17 |
32,84 |
|
ACTIVITY RATIOS |
|
|
|
|
|
Average Payment Period |
26 |
45 |
100 |
126 |
|
Average Collection Period |
27 |
8 |
30 |
57 |
|
Inventory Turnover Period |
90 |
29 |
44 |
78 |
|
SOLVENCY RATIOS |
|
|
|
|
|
Payback Capacity |
0,08 |
0,14 |
0,26 |
0,42 |
|
Assets Guarantee |
1,70 |
1,34 |
1,54 |
2,44 |
|
Short Term Debts Proportion (%) |
99,95 |
83,44 |
97,14 |
99,90 |
|
Interest Coverage |
10.257,69 |
5,76 |
18,33 |
63,57 |
|
LIQUIDITY RATIOS |
|
|
|
|
|
Current Ratio |
0,36 |
0,89 |
1,16 |
1,61 |
|
Immediate liquidity |
0,02 |
0,03 |
0,17 |
0,46 |
|
Treasury |
2.374.953,00 |
314,08 |
3.132,13 |
10.684,00 |
|
Sales on Current Assets |
1.025 |
805 |
1.187 |
1.718 |
Results Analysis
Ratios
|
|
COMPANY (2007) |
PTILE25 |
PTILE50 |
PTILE75 |
|
Economic profitability (%) |
-5,76 |
6,40 |
10,79 |
24,28 |
|
Operating Profitability (%) |
-9,90 |
3,51 |
7,77 |
12,12 |
|
Equity gearing |
2,30 |
1,59 |
2,52 |
3,70 |
|
Financial profitability (%) |
-1,99 |
10,13 |
21,20 |
36,85 |
|
General Profitability (%) |
-1,49 |
2,23 |
5,02 |
9,13 |
NOTES
The address included in your enquiry belongs
to a branch.
FOREIGN EXCHANGE
RATES
|
Currency |
Unit
|
Indian Rupees |
|
US Dollar |
1 |
Rs.49.90 |
|
UK Pound |
1 |
Rs.74.30 |
|
Euro |
1 |
Rs.63.42 |
RATING
EXPLANATIONS
|
RATING |
STATUS |
PROPOSED CREDIT LINE |
|
|
>86 |
Aaa |
Possesses an extremely sound financial base with the strongest
capability for timely payment of interest and principal sums |
Unlimited |
|
71-85 |
Aa |
Possesses adequate working capital. No caution needed for credit
transaction. It has above average (strong) capability for payment of interest
and principal sums |
Large |
|
56-70 |
A |
Financial & operational base are regarded healthy. General
unfavourable factors will not cause fatal effect. Satisfactory capability for
payment of interest and principal sums |
Fairly Large |
|
41-55 |
Ba |
Overall operation is considered normal. Capable to meet normal
commitments. |
Satisfactory |
|
26-40 |
B |
Unfavourable & favourable factors carry similar weight in credit consideration.
Capability to overcome financial difficulties seems comparatively below
average. |
Small |
|
11-25 |
Ca |
Adverse factors are apparent. Repayment of interest and principal sums
in default or expected to be in default upon maturity |
Limited with
full security |
|
<10 |
C |
Absolute credit risk exists. Caution needed to be exercised |
Credit not
recommended |
|
NR |
In view of the lack of information, we have no basis upon which to
recommend credit dealings |
No Rating |
|
This score serves as a reference to assess SC’s credit risk
and to set the amount of credit to be extended. It is calculated from a
composite of weighted scores obtained from each of the major sections of this
report. The assessed factors and their relative weights (as indicated through
%) are as follows:
Financial
condition (40%) Ownership
background (20%) Payment
record (10%)
Credit history
(10%) Market trend
(10%) Operational
size (10%)