![]()
MIRA
INFORM REPORT
|
Report Date : |
04.12.2008 |
IDENTIFICATION
DETAILS
|
Name : |
TORRECID SA |
|
|
|
|
Registered Office : |
|
|
|
|
|
Country : |
Spain |
|
|
|
|
Financials (as on) : |
31.12.2006 |
|
|
|
|
Date of Incorporation : |
|
|
|
|
|
Legal Form : |
Joint Stock Company |
|
|
|
|
Line of Business : |
RATING &
COMMENTS
|
MIRA’s Rating : |
A |
|
RATING |
STATUS |
PROPOSED CREDIT LINE |
|
|
56-70 |
A |
Financial & operational base are regarded healthy. General
unfavourable factors will not cause fatal effect. Satisfactory capability for
payment of interest and principal sums |
Fairly Large |
|
Maximum Credit Limit : |
2.598.175,33 € |
|
|
|
|
Status : |
Good |
|
|
|
|
Payment Behaviour : |
Regular |
|
|
|
|
Litigation : |
Clear |
FINANCIAL REPORT
TORRECID SA
TAX NUMBER: A12011946
EXECUTIVE SUMMARY
Identification
Current Business Name: TORRECID SA
Commercial Name: TORRECID, S.A.
Other names: YES
Current Address: PARTIDA TORRETA, S/N, CP 12110, ALCORA CASTELLÓN
Telephone number: 964360900 Fax: 964360792
URL: www.torrecid.com
Corporate e-mail: torrecid@torrecid.com
Commercial Risk
Credit Appraisal:
2.598.175,33 €
RAI: NO
Legal Actions: NO
Financial
Information
Latest Balance sheet sales (2006): 97.193.294,59 € (MERCANTILE REGISTER)
Result: 4.584.908,53 €
Total Assets: 190.667.419,12 €
Social Capital: 3.000.000,00 €
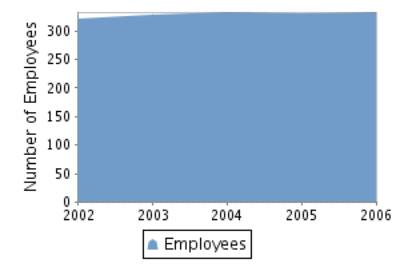
Employees: 333
Commercial Information
Constitution Date: 15/08/1963
Business activity: Mfg. of
paints, varnishes & similar coatings.
NACE Code: 2430
International Operations: No business
relationships registered
Corporate Structure
President:
Participations: 19
Other Complementary Information
Latest proceeding published in BORME: 14/01/2008 Registration
of accounts
Latest press article: 02/02/2008 EXPANSION
DE VALENCIA (SUBSIDIARIES INFORMATION)
Bank Entities: Yes
COMMERCIAL RISK
Credit Appraisal
Maximum Credit
(from 0 a 6,000,000 €)
Favourable to 2.598.175,33 €
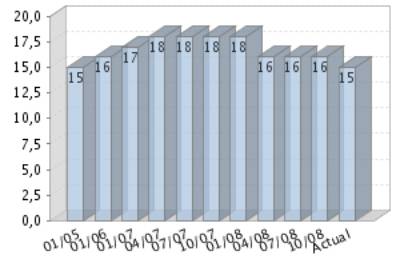
Rating Evolution
Financial Situation
Fiscal year2006
|
Treasury |
Excellent |
|
Indebtedness |
Weak |
|
Profitability |
Average |
|
Balance |
Very good |
Performance
|
Legal Actions |
None or Negligible |
|
Business
Trajectory |
Excellent |
COMPANY NOT REGISTERED IN THE R.A.I.
This company is not registered in the Disputed Bills register (R.A.I.)
Summary
LEGAL ACTIONS: No legal
incidences registered
CLAIM FILED AGAINST THE ADMINISTRATION: No administrative
claims registered.
AFFECTED BY:
3 Company / Companies in Insolvency Proceedings.
FINANCIAL ELEMENTS AND SECTORIAL
COMPARATIVE
FINANCIAL ELEMENTS
Figures given in €
|
|
2004 (12) |
2005 (12) |
2006 (12) |
% ASSETS |
|
|
|
|
|
|
BALANCE SHEET
ANALYSIS |
|
|
|
|
|
|
|
|
|
|
OWN FUNDS |
96.649.205,27 |
104.349.705,12 |
105.889.789,73 |
55,54 |
|
|
|
|
|
|
DEBT |
61.800.209,40 |
77.842.614,03 |
84.777.629,39 |
44,46 |
|
|
|
|
|
|
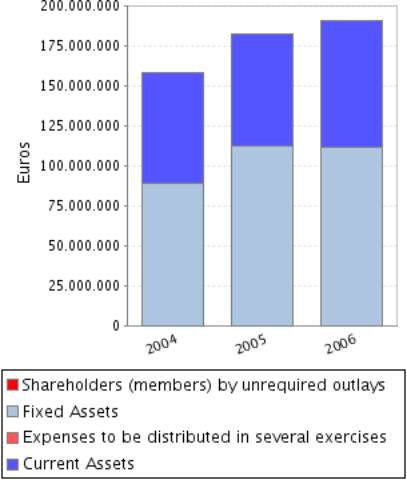
FIXED ASSETS |
88.920.356,86 |
112.109.289,61 |
111.257.757,01 |
58,35 |
|
|
|
|
|
|
TOTAL ASSETS |
158.449.414,67 |
182.192.319,15 |
190.667.419,12 |
|
|
|
|
|
|
|
|
2004 (12) |
2005 (12) |
2006 (12) |
% SALES |
|
|
|
|
|
|
PROFIT AND LOSS
ACCOUNT ANALYSIS |
|
|
|
|
|
|
|
|
|
|
SALES |
86.201.307,42 |
85.181.055,65 |
97.193.294,59 |
|
|
|
|
|
|
|
ADDED VALUE |
28.751.804,95 |
23.426.448,23 |
20.828.666,19 |
21,43 |
|
|
|
|
|
|
EBITDA |
15.047.320,64 |
9.203.326,01 |
6.750.690,36 |
6,95 |
|
|
|
|
|
|
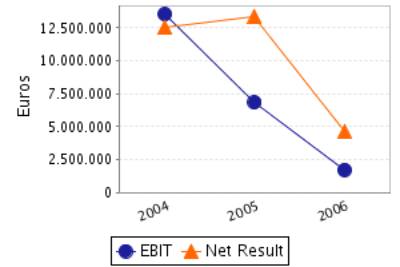
EBIT |
13.545.073,54 |
6.845.379,04 |
1.716.306,59 |
1,77 |
|
|
|
|
|
|
NET RESULT |
12.577.098,38 |
13.393.726,22 |
4.584.908,53 |
4,72 |
|
|
|
|
|
Balance Sheets Items
Analysis
Balance Sheet Comments
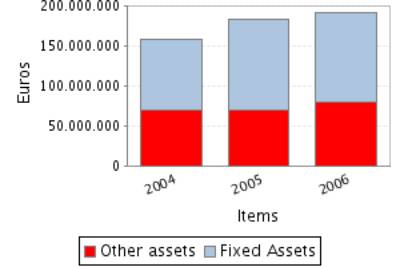
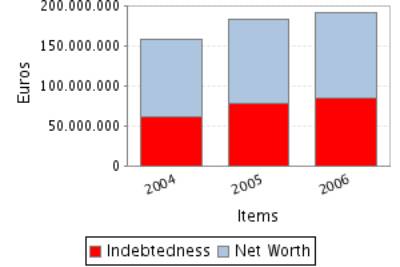
Total assets of the company grew 14,98% between 2004 and 2005.
This growth is a consequence of the fixed assets increase of 26,08%.
This growth has been mainly financed with a debt increase of 25,96%.
Nevertheless the net worth increased 7,97%.
Total assets of the company grew 4,65% between 2005 and 2006.
In spite of the assets’ growth, the fixed assets decreased 0,76%.
This growth has been mainly financed with a debt increase of 8,91%.
Nevertheless the net worth increased 1,48%.
Profit and Loss Account Analysis
Profit and Loss Account Comments
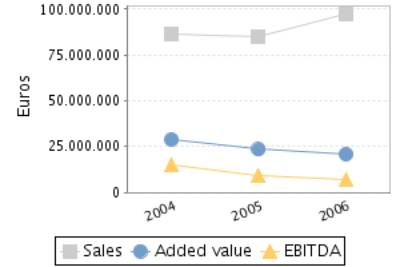
The company’s sales figure decreased in 1,18% between 2004 and 2005.
The company’s EBIT decreased in 49,46% between 2004 and 2005.
This evolution implies a reduction in the company’s operating
profitability.
The result of these variations is a decrease of the company’s Economic
Profitability of 56,05% in the analysed period, being this profitability of
3,76% in the year 2005.
The company’s Net Result grew 6,49% between 2004 and 2005.
This evolution, compared to the EBIT’s performance, implies that the
financial and extraordinary activities have had a positive effect in the
company’s Financial Profitability.
The result of these variations is a reduction of the company’s
profitability of 1,37% in the analysed period, being equal to 12,84% in the
year 2005.
The company’s sales figure grew 14,10% between 2005 and 2006.
The company’s EBIT decreased in 74,93% between 2005 and 2006.
This evolution implies a reduction in the company’s operating
profitability.
The result of these variations is a decrease of the company’s Economic
Profitability of 76,04% in the analysed period, being this profitability of
0,90% in the year 2006.
The company’s Net Result decreased in 65,77% between 2005 and 2006.
This evolution, compared to the EBIT’s performance, implies that the
financial and extraordinary activities have had a positive effect in the
company’s Financial Profitability.
The result of these variations is a reduction of the company’s
profitability of 66,27% in the analysed period, being equal to 4,33% in the
year 2006.
ANNUAL FINANCIAL REPORT ADDITIONAL DATA
Source: annual financial report 2006
Results Distribution
Figures given in €
|
DISTRIBUTION
BASE |
DISTRIBUTION TO |
||
|
Profit and Loss |
4.584.908,53 |
Retained earnings |
0,00 |
|
Carry Over |
558,41 |
Voluntary Reserve |
4.585.000,00 |
|
Voluntary reserves |
0,00 |
Prior years losses |
0,00 |
|
Reserves |
0,00 |
Carry Over |
466,94 |
|
Other concepts |
0,00 |
Other funds |
0,00 |
|
Total of Amounts to be distributed |
4.585.466,94 |
Dividends |
0,00 |
|
|
|
Other Applications |
0,00 |
AUDITING
Auditors’ opinion: FAVOURABLE
Auditor: FONT ARQUER JOSE ANTONIO
COMPARATIVE SECTOR ANALYSIS
Values table
Figures expressed in %
|
|
COMPANY (2006) |
SECTOR |
DIFFERENCE |
DIFFERENCE RELATIVE |
|
|
|
|
|
|
BALANCE SHEET
ANALYSIS: % on the total assets |
|
|
|
|
|
|
|
|
|
|
OWN FUNDS |
55,54 |
54,29 |
1,25 |
2,30 |
|
|
|
|
|
|
DEBT |
44,46 |
45,71 |
-1,25 |
-2,73 |
|
|
|
|
|
|
FIXED ASSETS |
58,35 |
39,34 |
19,01 |
48,33 |
|
|
|
|
|
|
|
|
|
|
|
|
|
|
|
|
|
|
COMPANY (2006) |
SECTOR |
DIFFERENCE |
DIFFERENCE RELATIVE |
|
|
|
|
|
|
PROFIT AND LOSS
ACCOUNT ANALYSIS: % on the total operating income |
|
|
|
|
|
|
|
|
|
|
SALES |
97,44 |
98,98 |
-1,54 |
-1,56 |
|
|
|
|
|
|
ADDED VALUE |
20,88 |
25,70 |
-4,82 |
-18,76 |
|
|
|
|
|
|
EBIT |
1,72 |
5,25 |
-3,53 |
-67,23 |
|
|
|
|
|
|
NET RESULT |
4,60 |
3,79 |
0,81 |
21,24 |
|
|
|
|
|
Sector Composition
Compared sector (NACE): 243
Number of companies: 17
Size (Sales Figure) : > 40.000.000,00
Euros
Comments on the sectorial comparative
Compared to its sector the assets of the companies show a greater
proportion of fixed assets. Specifically the difference with the sector average
is 19,01% , which means a relative difference of 48,33% .
In liabilities composition the company appeals on a wider scale to self
financing, being the proportion of net worth of 1,25% superior, which means a
relative difference of 2,30% . As a consequence, external financing sources are
less used by the company in 1,25% less than the sector, which means a
difference of 2,73% .
The proportion that the sales mean to the company’s total ordinary
income is 97,44%, 1,54% lower than in the sector, which means a relative
difference of 1,56% .
The company’s EBIT was positive and was 1,72% with regard to the total
ordinary income, 3,53% less than the sector, which means a relative difference
of 67,23% .
The company’s capacity to generate operating income is equal to that of
the sector as its ratio EBIT/Sales is also equal.
The company’s net result was positive and equal to 4,60% with regard to
the total ordinary income, 0,81% higher than in the sector, which means a
relative difference of 21,24% .
The financial and extraordinary results and the tax impact have had a
more positive impact on the Net result in the company than in the sector; as a
consequence, the company shows a better Net Result/EBIT ratio.
ADDRESSES
Current Legal Seat Address:
PARTIDA TORRETA, S/N
12110
ALCORA CASTELLÓN
CORPORATE STRUCTURE
ADMINISTRATIVE LINKS
Main Board members, Directors and Auditor ![]()
|
POSITION |
SURNAMES AND
NAME |
APPOINTMENT DATE |
|
|
PRESIDENT |
MICHAVILA PALLARES FEDERICO |
28/08/2006 |
|
|
MANAGING DIRECTOR |
MICHAVILA HERAS FEDERICO |
28/08/2006 |
|
|
CHIEF OFFICER |
MICHAVILA HERAS MIGUEL ANGEL |
28/08/2006 |
|
|
AUDITOR |
APPOINTMENT DATE |
||
|
SOS BELTRAN MANUEL |
26/05/2003 |
||
|
FONT ARQUER JOSE ANTONIO |
26/05/2003 |
||
Functional Managers
|
POSITION |
SURNAMES AND
NAME |
|
General Manager |
MICHAVILA PALLARES FEDERCIO |
|
Financial Manager |
BERNAT RUBEN |
FINANCIAL LINKS
|
|
BUSINESS NAME |
CIF / COUNTRY |
% |
SOURCE |
DATA INF. |
|
|
PAINVER S. A. |
A12311254 |
38,12 |
OWN SOURCES |
16/01/2007 |
|
|
TORRECID SA |
A12011946 |
28,26 |
OWN SOURCES |
16/01/2007 |
|
|
FINANZAS FMH S.L. |
B12548707 |
14,85 |
TRADE REG. |
31/12/2006 |
|
|
FAMILIA MICHAVILA |
|
Indet. |
OWN SOURCES |
08/01/1997 |
|
|
BUSINESS NAME |
CIF / COUNTRY |
% |
SOURCE |
DATA INF. |
|
|
SURCOTECH |
UNITED KINGDOM |
100,00 |
EXPANSIÓN |
13/12/2004 |
|
|
REIMBOLD AND STRICK |
GERMANY |
100,00 |
CINCO DIAS |
17/12/2005 |
|
|
TORRECID MEXICO SA DE CV |
MEXICO |
99,99 |
OWN SOURCES |
08/01/1997 |
|
|
TORRECID BRASIL LTDA |
BRAZIL |
97,00 |
OWN SOURCES |
08/01/1997 |
|
|
TORRECID PORTUGAL LTDA |
PORTUGAL |
95,00 |
OWN SOURCES |
08/01/1997 |
|
|
TORRECID ITALIA S.R.L. |
ITALY |
90,00 |
OWN SOURCES |
08/01/1997 |
CREDIT INFORMATION
Constitution Date: 15/08/1963
Foundation Date: 01/01/1963
Founder / Origin: FEDERICO MICHAVILA
PALLARES
Activity: Mfg. of paints, varnishes & similar
coatings.
NACE Code: 2430
NACE Activity: Manufacture of
paints, varnishes and similar coatings, printing ink and mastics
Business: FABRICACION DE BARNICES Y ESMALTES CERAMICOS DE
TODA CLASE,
Number of total employees: 333 (2007)
Number of fixed employees: 87,69%
Number of temporary employees: 12,31%
Employees evolution
Banks 
|
ENTITY |
BRANCH |
ADDRESS |
TOWN OR CITY |
PROVINCE |
|
BANCO ESPAÑOL DE
CREDITO, S.A. |
|
|
|
|
|
BANCO SANTANDER,
S.A. |
|
|
|
|
|
BANCO DE
SABADELL, S.A. |
0275 |
ARZ.GASCH,1 |
ALCORA |
Castellón |
|
CAJA AH.
VALENCIA, CASTELLON Y ALICANTE, BANCAJA |
0605 |
DOCTOR FEDERICO MICHAVILA PAUS, 5 |
ALCORA |
Castellón |
|
BANCO DE VALENCIA, S.A. |
0511 |
LORETO, 16 |
ALCORA |
Castellón |
6 bank entities registered
Brands, Signs and Commercial
Names 
FORMER NAMES:
•
ESMALTES CERAMICOS TORRECID SA
•
ESMALTES CERAMICOS TORRECID SL
Brand name: ERACLES (Valid)
Type: JOINT Date: 24/02/2005
Brand name: INKCID (Valid)
Type: JOINT Date: 24/02/2005
Brand name: GLAZURA (Valid)
Type: JOINT Date: 24/02/2005
Brand name: VITROCID BY TORRECID (Valid)
Type: JOINT Date: 21/02/2003
Brand name: VITROCID (Valid)
Type: JOINT Date: 04/02/2003
LEGAL STRUCTURE
Constitution Data
Register Date: 15/08/1963
Current Legal Form: JOINT STOCK
COMPANY
Current Capital:
3.000.000,00 €
Legal Aspects
Obligation to fill in Financial
Statements: YES
Chamber census: YES (2006)
Listed on a Stock Exchange: NO
B.O.R.M.E.(Official Companies
Registry Gazette) 
Registered Proceedings
|
PROCEEDINGS |
DATE |
NOTICE NUM. |
TRADE REG. |
|
Resignations |
28/08/2006 |
425037 |
Castellón |
Other Proceedings published
|
PROCEEDINGS |
DATE |
NOTICE NUM. |
TRADE REG. |
|
Registration of accounts (2006) Individual |
14/01/2008 |
23569 |
Castellón |
|
Registration of accounts (2006) Consolidated |
14/01/2008 |
23021 |
Castellón |
|
Registration of accounts (2005) Individual |
11/01/2007 |
68123 |
Castellón |
|
Registration of accounts (2005) Consolidated |
11/01/2007 |
67617 |
Castellón |
Press articles

02/02/2008 EXPANSION DE VALENCIA (SUBSIDIARIES INFORMATION)
TORRECID SE HA IDO HACIENDO POCO A POCO CON UN PAQUETE DE ACCIONES DE
BANCO DE VALENCIA. LA ULTIMA COMPRA SE PRODUJO EL PASADO 18/01/08, CON LA
ADQUISICION DE 1.685 TITULOS A UN PRECIO DE 35,92 EUROS. SEGUN COMUNICO
FEDERICO MICHAVILA HERAS (CONSEJERO DELEGADO DE TORRECID, QUE ENTRO EN EL
CONSEJO DEL BANCO EN JULIO PASADO) A LA CNMV, TRAS ESTA OPERACION CONTROLA
1.091.948 ACCIONES DE BANCO DE VALENCIA, EN SU MAYORIA DE FORMA INDIRECTA Y A
TRAVES DE TORRECID. ESTOS TITULOS REPRESENTAN EL 0,96% DEL CAPITAL DEL BANCO
VALENCIANO. ADEMAS, MICHAVILA RECONOCE POSEER EL 50,06% DE TORRECID.
18/07/2007 EXPANSION DE VALENCIA (NEW PRODUCTS AND ACTIVITIES
INFORMATION)
TRAS MAS DE 2 AÑOS DE TRAMITACION, EL FABRICANTE DE ESMALTES, COLORES, Y
FRITAS CERAMICAS TORRECID, HA LOGRADO LA APROBACION DE SU PATENTE PARA LA
TECNOLOGIA DE IMPRESION DIGITAL INKCID, UN PRODUCTO AL QUE HA DESTINADO BUENA
PARTE DE SUS ESFUERZOS EN I+D. EL GRUPO TORRECID DESTINA MAS DEL 6% DE SU
FACTURACION A LAS ACTIVIDADES DE I+D, INTEGRA A UNA VEINTENA DE SDADES. CON
2.200 TRABAJADORES EN EUROPA, AFRICA, ASIA Y AMERICA, Y CUENTA CON UNA
FACTURACION ANUAL DE CERCA DE 400 MM. DE EUROS.
Complementary Information
El balance cerrado a 31/12/2000 (Deposito
2000) esta disponible, pero
no ha sido cargado por ser ilegible.
31/12/1996 La sociedad procede de una empresa individual fundada el
15/8/1963 como ROSARIO HERAS MANE-US ,
se constituyo como SL bajo la
denominacion de ESMALTES CERAMICOS
TORRECID SL 2/6/1967
FINANCIAL INFORMATION
The information on the last account contained in this report is
extracted from the Mercantile Register file of the legal address of the Company
and dated 14/01/2008.
BALANCE SHEET
Assets
Figures given in €
|
|
31/12/2004 (12) |
31/12/2005 (12) |
31/12/2006 (12) |
|
A) DUE FROM SHAREHOLDERS FOR UNCALLED CAPITAL |
|
|
|
|
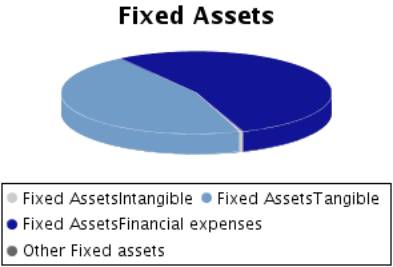
B) FIXED ASSETS |
88.920.356,86 |
112.109.289,61 |
111.257.757,01 |
|
I. Incorporation costs |
|
|
|
|
II. Intangible fixed assets |
933.148,99 |
753.976,77 |
461.908,44 |
|
R & D expenses |
|
|
|
|
Concessions,
patents, licences , trademarks |
|
|
|
|
Goodwill |
|
|
|
|
Acquired rights from finance leases |
|
|
|
|
Software |
1.582.544,40 |
1.604.500,44 |
1.798.366,27 |
|
Leasing |
|
|
|
|
Cash advance |
102.974,41 |
192.968,30 |
|
|
Provisions |
|
|
|
|
Depreciation |
-752.369,82 |
-1.043.491,97 |
-1.336.457,83 |
|
III. Tangible fixed assets |
50.957.166,33 |
52.628.962,92 |
50.821.713,82 |
|
Property, plant and equipment |
37.854.646,51 |
38.346.980,48 |
39.086.709,69 |
|
Machinery, equipment and other |
40.671.483,92 |
45.021.777,72 |
46.151.323,76 |
|
Other property plant and equipment |
2.776.420,98 |
2.979.651,03 |
3.008.044,51 |
|
Prepaid expenses on fixed assets |
1.485.000,09 |
1.698.937,09 |
1.960.450,82 |
|
Other assets |
2.052.700,39 |
2.207.699,57 |
2.296.264,49 |
|
Provisions |
|
|
|
|
Depreciation |
-33.883.085,56 |
-37.626.082,97 |
-41.681.079,45 |
|
IV. Financial fixed assets |
37.030.041,54 |
58.726.349,92 |
59.974.134,75 |
|
Shares in affiliated companies |
50.995.319,44 |
69.569.535,22 |
75.199.307,74 |
|
Receivables in affiliated companies |
|
828.254,86 |
652.150,72 |
|
Shares in associated companies |
3.155.313,55 |
3.155.313,55 |
3.155.313,55 |
|
Loans to associated companies |
1.250.000,00 |
|
1.250.000,00 |
|
Securities |
516.007,66 |
16.007,66 |
16.007,66 |
|
Other loans |
|
1.250.000,00 |
|
|
Long term deposits and guarantees |
8.409,37 |
19.043,24 |
19.043,24 |
|
Provisions |
-18.895.008,48 |
-16.111.804,61 |
-20.317.688,16 |
|
Taxes receivable |
|
|
|
|
V.Owners equity |
|
|
|
|
VI.Long term trade liabilities |
|
|
|
|
C) DEFERRED EXPENSES |
|
|
|
|
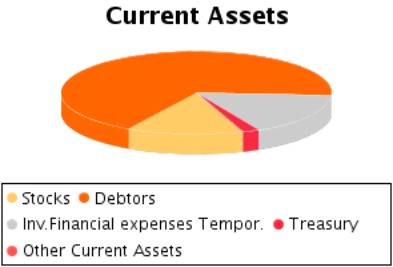
D) CURRENT ASSETS |
69.529.057,81 |
70.083.029,54 |
79.409.662,11 |
|
I. Shareholders by required outlays |
|
|
|
|
II. Stocks |
7.706.417,06 |
8.564.185,92 |
10.994.725,91 |
|
Goods available for sale |
578.233,58 |
928.098,25 |
574.456,32 |
|
Raw material inventory |
2.527.805,38 |
3.159.728,40 |
3.790.543,98 |
|
Work in Progress |
3.244.821,80 |
3.330.664,14 |
5.582.237,64 |
|
Finished goods |
660.472,80 |
1.094.834,01 |
849.092,28 |
|
Subproducts and recycled materials |
|
|
|
|
Cash advance |
695.083,50 |
50.861,12 |
198.395,69 |
|
Provisions |
|
|
|
|
III. Debtors |
44.723.560,22 |
48.876.407,41 |
53.770.784,72 |
|
Clients |
42.896.345,00 |
45.369.340,19 |
51.416.175,99 |
|
Amounts owned by affiliated companies |
12.243.924,71 |
10.245.302,37 |
8.731.437,46 |
|
Amounts owned by associated companies |
|
|
|
|
Other debts |
14.633,31 |
10.081,29 |
47.870,20 |
|
Staff Expenses |
31.477,68 |
68.497,12 |
58.637,39 |
|
Government |
1.326.849,07 |
3.194.527,19 |
4.094.447,33 |
|
Provisions |
-11.789.669,55 |
-10.011.340,75 |
-10.577.783,65 |
|
IV. Temporary financial investment |
15.504.253,71 |
10.398.508,20 |
13.007.700,48 |
|
Shares in affiliated companies |
|
|
|
|
Receivables in affiliated companies |
116.402,62 |
1.943.181,94 |
2.481.379,83 |
|
Shares in associated companies |
|
8.338.836,56 |
|
|
Loans to associated companies |
|
|
|
|
Short term investment |
15.380.048,28 |
|
9.321.181,37 |
|
Other loans |
754,55 |
116.489,70 |
1.200.420,61 |
|
Short Term Deposit and guarantees |
7.048,26 |
|
4.718,67 |
|
Provisions |
|
|
|
|
V. Short-term own shares |
|
|
|
|
VI. Treasury |
1.594.826,82 |
2.243.928,01 |
1.636.451,00 |
|
VII. Periodification adjustments |
|
|
|
|
ASSETS (A + B + C + D) |
158.449.414,67 |
182.192.319,15 |
190.667.419,12 |
Assets composition
Liabilities
Figures given in €
|
|
31/12/2004 (12) |
31/12/2005 (12) |
31/12/2006 (12) |
|
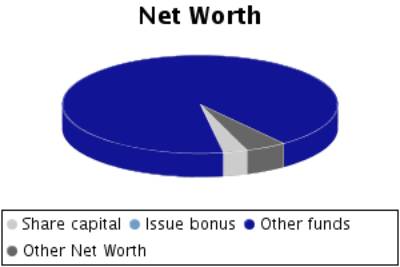
A) SHAREHOLDERS EQUITY |
96.606.492,90 |
104.300.219,12 |
105.885.127,65 |
|
I. Share capital |
3.000.000,00 |
3.000.000,00 |
3.000.000,00 |
|
II. Issue bonus |
19.833,40 |
19.833,40 |
19.833,40 |
|
III.Revaluation reserve |
572.827,31 |
572.827,31 |
572.827,31 |
|
IV.Reserves |
80.436.000,00 |
87.313.000,00 |
97.707.000,00 |
|
Retained earnings |
600.000,00 |
600.000,00 |
600.000,00 |
|
Sinking fund from owner equity |
79.836.000,00 |
|
97.107.000,00 |
|
Reserve for the parent company capital |
|
|
|
|
Statutory reserve |
|
|
|
|
Other funds |
|
86.713.000,00 |
|
|
Capital adjustments in Euros |
|
|
|
|
V.Results from previous years |
733,81 |
832,19 |
558,41 |
|
Carry Over |
733,81 |
832,19 |
558,41 |
|
Prior years losses |
|
|
|
|
Loans from
partners for losses compensation |
|
|
|
|
VI.Profit and Losses |
12.577.098,38 |
13.393.726,22 |
4.584.908,53 |
|
VII.Dividend paid during the year |
|
|
|
|
VIII.Own shares for capital reduction |
|
|
|
|
B) DEFERRED INCOME |
42.712,37 |
49.486,00 |
4.662,08 |
|
Capital grants |
|
|
|
|
Positive change difference |
42.712,37 |
49.486,00 |
4.662,08 |
|
Other deferred income |
|
|
|
|
Fiscal deferred income |
|
|
|
|
C) PROVISIONS FOR LIABILITIES AND EXPENSES |
267.450,47 |
267.450,47 |
267.450,47 |
|
Provision for pensions plans |
267.450,47 |
267.450,47 |
267.450,47 |
|
Provision for taxes |
|
|
|
|
Other provisions |
|
|
|
|
Reversion fund |
|
|
|
|
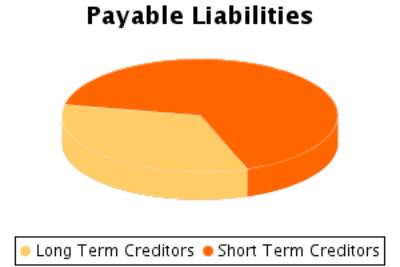
D) LONG TERM LIABILITIES |
20.852.146,77 |
32.605.301,95 |
28.490.046,69 |
|
I.Negotiable bonds and other negotiable values |
|
|
|
|
Non convertible securities |
|
|
|
|
Convertible securities |
|
|
|
|
Other convertible debentures |
|
|
|
|
II.Debt with bank entities |
18.696.774,89 |
30.460.819,31 |
26.633.583,56 |
|
Long term bank loans |
18.696.774,89 |
30.460.819,31 |
26.633.583,56 |
|
Leasing |
|
|
|
|
III.Debts with associated and affiliated
companies |
|
|
19.289,74 |
|
With affiliated companies |
|
|
|
|
Associated companies |
|
|
19.289,74 |
|
IV. Other creditors |
2.155.371,88 |
2.144.482,64 |
1.837.173,39 |
|
Bills payable |
|
|
|
|
Other debts |
2.150.527,73 |
2.139.638,49 |
1.832.329,24 |
|
Long term deposit and guaranties |
4.844,15 |
4.844,15 |
4.844,15 |
|
Taxes receivable |
|
|
|
|
V. Deferred debts on shares |
|
|
|
|
From affiliated companies |
|
|
|
|
From associated companies |
|
|
|
|
Other companies |
|
|
|
|
VI. Long term debt with creditor |
|
|
|
|
E) SHORT TERM LIABILITIES |
40.680.612,16 |
44.969.861,61 |
56.020.132,23 |
|
I.Negotiable bonds and other negotiable values |
|
|
|
|
Non convertible securities |
|
|
|
|
Convertible securities |
|
|
|
|
Other convertible debentures |
|
|
|
|
Interests from bonds |
|
|
|
|
II.Debt with bank entities |
8.546.201,17 |
11.584.845,20 |
17.197.771,42 |
|
Loans and other debts |
8.480.767,87 |
11.481.238,46 |
17.045.723,86 |
|
Debt interest |
65.433,30 |
103.606,74 |
152.047,56 |
|
Leasing |
|
|
|
|
III. Short term debts with associated and
affiliated companies |
1.199.196,41 |
2.128.407,08 |
1.749.919,14 |
|
With affiliated companies |
1.199.196,41 |
2.128.407,08 |
1.749.919,14 |
|
Associated companies |
|
|
|
|
IV. Commercial creditors |
21.326.845,03 |
22.346.701,50 |
29.688.348,11 |
|
Accounts payable |
96.118,90 |
|
3.223.138,60 |
|
Expenses |
21.045.559,58 |
22.346.701,50 |
26.465.151,27 |
|
Bills payable |
185.166,55 |
|
58,24 |
|
V. Other non-commercial debt |
7.721.055,02 |
6.822.732,66 |
5.360.012,69 |
|
Government |
4.164.071,20 |
4.046.220,99 |
2.894.705,67 |
|
Bills payable |
|
|
|
|
Other debts |
2.138.917,68 |
1.625.202,31 |
1.263.132,26 |
|
Accounts receivable |
1.417.795,68 |
1.151.309,36 |
1.202.174,76 |
|
Short term deposits and guarantees |
270,46 |
|
|
|
VI. Provisions for current assets |
1.887.314,53 |
2.087.175,17 |
2.024.080,87 |
|
VII. Periodification adjustments |
|
|
|
|
F) SHORT TERM PROVISIONS FOR LIABILITIES AND
EXPENSES |
|
|
|
|
LIABILITIES (A + B + C + D + E + F) |
158.449.414,67 |
182.192.319,15 |
190.667.419,12 |
Liabilities
Composition
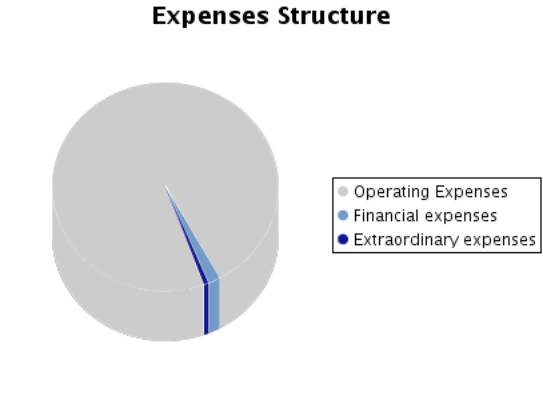
PROFIT AND LOSS ACCOUNT
Itams of the Profit and Loss Account
Figures given in €
|
|
31/12/2004 (12) |
31/12/2005 (12) |
31/12/2006 (12) |
|
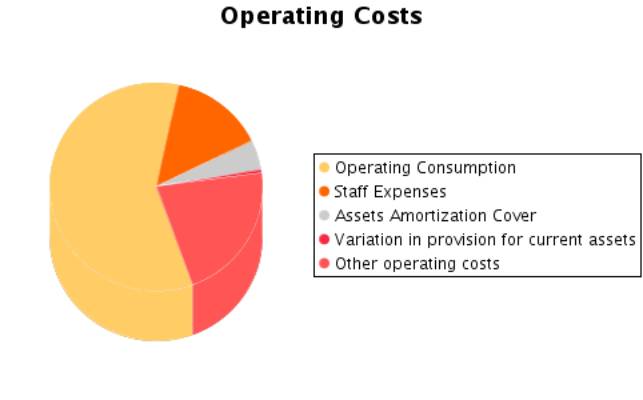
A) EXPENSES (A.1 a A.16) |
80.587.231,54 |
78.903.742,65 |
105.342.512,31 |
|
A.1.Reduction in stocks of finished goods and
work in progress |
|
|
|
|
A.2.Supplies |
41.323.357,93 |
46.378.273,42 |
59.823.161,19 |
|
Material consumed |
4.262.624,22 |
5.160.123,35 |
7.142.203,64 |
|
Raw materials consumed |
36.966.161,62 |
41.197.254,02 |
52.608.307,70 |
|
Other expenses |
94.572,09 |
20.896,05 |
72.649,85 |
|
A.3. Labour cost |
13.704.484,31 |
14.223.122,22 |
14.077.975,83 |
|
Wages |
11.130.101,68 |
11.471.720,29 |
11.192.062,60 |
|
Social security expenses |
2.574.382,63 |
2.751.401,93 |
2.885.913,23 |
|
A.4. Assets depreciation |
3.651.223,05 |
4.134.887,08 |
4.467.940,87 |
|
A.5.Variance in the traffic provisions |
-2.148.975,95 |
-1.776.940,11 |
566.442,90 |
|
Variance in provision for inventory |
-2.148.975,95 |
|
566.442,90 |
|
Variance in provision for bad debts |
|
|
|
|
Variance in provision for other current assets |
|
-1.776.940,11 |
|
|
A.6. Other operating costs |
17.182.938,98 |
18.676.425,02 |
21.105.349,91 |
|
External costs |
16.957.914,11 |
16.687.753,34 |
18.637.124,66 |
|
Taxes |
225.024,87 |
269.228,78 |
216.859,88 |
|
Other day to day expenses |
|
1.719.442,90 |
2.251.365,37 |
|
Allowance to
reversion fund |
|
|
|
|
A.I.OPERATING
RESULT (B.1+B.2+B.3+B.4-A.1-A.2-A.3-A.4-A.5-A.6) |
13.545.073,54 |
6.845.379,04 |
1.716.306,59 |
|
A.7.Financial expenses and similar |
504.277,93 |
722.242,41 |
1.425.384,48 |
|
Debts with related companies |
|
|
|
|
Debts with associated companies |
|
|
|
|
Other companies debts By debts with third parties and similar expenses |
504.277,93 |
720.062,49 |
1.425.384,48 |
|
Losses from financial investments |
|
2.179,92 |
|
|
A.8. Variation in financial investment provision |
|
|
|
|
A.9.Negative exchange difference |
62.697,26 |
33.656,40 |
346.407,31 |
|
A.II.POSITIVE FINANCIAL RESULTS
(B.5+B.6+B.7+B.8-A.7-A.8-A.9) |
4.384.733,00 |
2.990.368,14 |
3.569.536,57 |
|
A.III.PROFIT
FROM ORDINARY ACTIVITIES (A.I+A.II-B.I-B.II) |
17.929.806,54 |
9.835.747,18 |
5.285.843,16 |
|
A.10. Variation
in provision in fixed assets |
2.611.794,40 |
-2.783.203,87 |
4.205.883,55 |
|
A.11. Losses in
fixed assets |
14.358,75 |
4.842,89 |
645.538,35 |
|
A.12. Losses from
own shares and bonds |
|
|
|
|
A.13.
Extraordinary charges |
272,78 |
633,50 |
1.297,20 |
|
A.14.Other
exercises’ expenses and losses |
|
8.987,05 |
|
|
A.IV.POSITIVE
EXTRAORDINARY RESULT (B.9+B.10+B.11+B.12+B.13-A.10-A.11-A.12-A.13-A.14) |
|
2.838.795,68 |
|
|
A.V.PROFIT
BEFORE TAXES (A.III+A.IV-B.III-B.IV) |
16.257.900,48 |
12.674.542,86 |
3.262.039,25 |
|
A.15.Corporate Taxes |
3.680.802,10 |
-719.183,36 |
-1.322.869,28 |
|
A.16. Other taxes |
|
|
|
|
A.VI.EXERCISE RESULT (PROFIT) (A.V-A.14-A.15) |
12.577.098,38 |
13.393.726,22 |
4.584.908,53 |
|
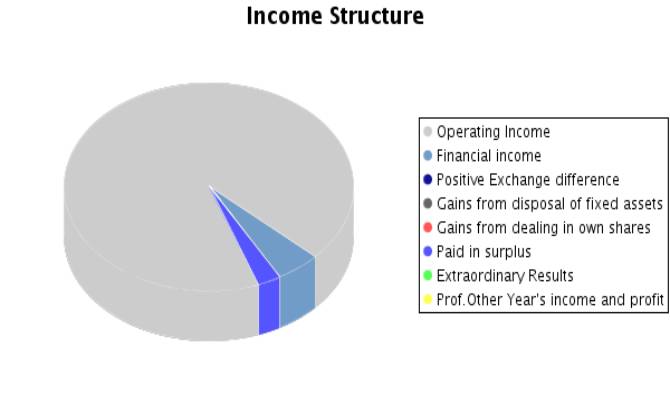
B) INCOMES (B.1 a B13) |
93.164.329,92 |
92.297.468,87 |
109.927.420,84 |
|
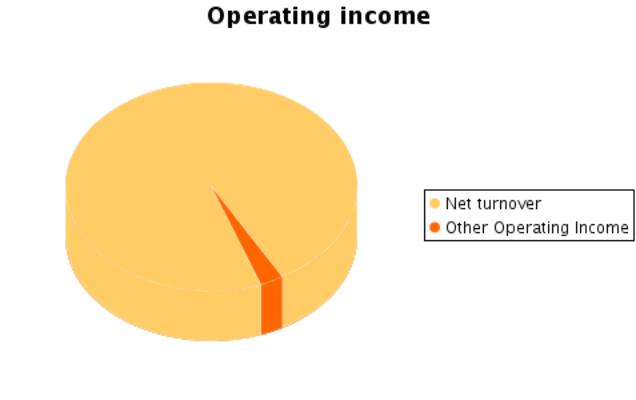
B.1. Turnover |
86.201.307,42 |
85.181.055,65 |
97.193.294,59 |
|
Sales |
90.534.508,31 |
90.002.593,85 |
103.029.166,98 |
|
Services
provided |
52.882,99 |
30.295,67 |
638.391,88 |
|
Refunds and sale
reminders |
-4.386.083,88 |
-4.851.833,87 |
-6.474.264,27 |
|
B.2.Increase in
inventory of finished goods and works in progress |
49.815,44 |
520.203,55 |
2.005.831,77 |
|
B.3.Expenses
capitalized |
|
|
|
|
B.4. Other
operating income |
1.006.979,00 |
2.779.887,47 |
2.558.050,93 |
|
Other incomes |
868.595,47 |
954.502,64 |
2.548.920,22 |
|
Grants |
121.675,45 |
1.825.384,83 |
9.130,71 |
|
Excess in
provision for liabilities and charges |
16.708,08 |
|
|
|
B.I.OPERATING
LOSSES (A.1+A.2+A.3+A.4+A.5+A.6-B.1-B.2-B.3-B.4) |
|
|
|
|
B.5.Incomes from share participations |
4.374.735,79 |
2.527.394,09 |
4.738.554,24 |
|
From affiliated companies |
4.222.173,96 |
2.365.123,13 |
4.547.955,87 |
|
From associated companies |
|
|
|
|
From other companies |
152.561,83 |
162.270,96 |
190.598,37 |
|
B.6.Income from other securities and credits to
fixed assets |
74.931,73 |
327.264,56 |
185.114,87 |
|
From affiliated companies |
7.379,28 |
22.676,23 |
46.355,78 |
|
From associated companies |
|
|
|
|
Other companies |
67.552,45 |
304.588,33 |
138.759,09 |
|
B.7.Other interests and similar |
443.738,86 |
775.706,89 |
400.649,96 |
|
From affiliated companies |
257.530,62 |
443.666,60 |
337.378,15 |
|
From associated companies |
|
|
|
|
Other Interests |
186.208,24 |
256.691,82 |
63.271,81 |
|
Profits from investments |
|
75.348,47 |
|
|
B.8. Positive change difference |
58.301,81 |
115.901,41 |
17.009,29 |
|
B.II. NEGATIVE FINANCIAL RESULTS
(A.7+A.8+A.9-B.5-B.6-B.7-B.8) |
|
|
|
|
B.III.LOSSES FROM ORDINARY ACTIVITIES
(B.I+B.II-A.I-A.II) |
|
|
|
|
B.9.B.9. Gains from disposal of fixed assets |
856.734,90 |
19.537,51 |
71.982,45 |
|
B.10.Gains from dealing in own shares |
|
|
|
|
B.11. Paid in surplus |
|
|
2.755.527,53 |
|
B.12. Extraordinary income |
5.311,04 |
30.926,61 |
1.405,21 |
|
B.13.Other year’s income and profits |
92.473,93 |
19.591,13 |
|
|
B.IV.NEGATIVE EXTRAORDINARY LOSSES
(A.10+A.11+A.12+A.13+A.14-B.9-B.10-B.11-B.12-B.13) |
1.671.906,06 |
|
2.023.803,91 |
|
B.V.LOSS BEFORE TAXES (B.III+B.IV-A.III-A.IV) |
|
|
|
|
B.VI.EXERCISE RESULTS (LOSS) (B.V+A.14+A.15) |
|
|
|
Composition of the
Profit and Loss Account
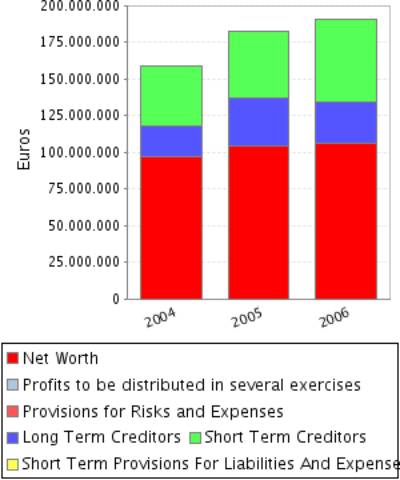
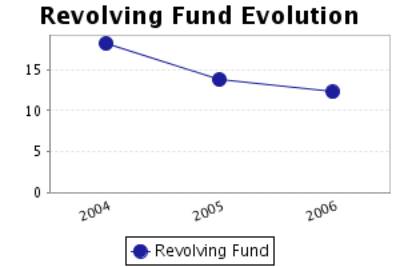
FINANCIAL BALANCE
Here the Main Capital Amounts of the company and the Revolving Fund
Evolution are analysed.
Financial Balance Table
Figures given in €
|
|
31/12/2004 (12) |
% |
31/12/2005 (12) |
% |
31/12/2006 (12) |
% |
|
A) DUE FROM
SHAREHOLDERS FOR UNCALLED CAPITAL |
|
|
|
|
|
|
|
B) FIXED ASSETS |
88.920.356,86 |
56,12 |
112.109.289,61 |
61,53 |
111.257.757,01 |
58,35 |
|
C) DEFERRED
EXPENSES |
|
|
|
|
|
|
|
D) CURRENT
ASSETS |
69.529.057,81 |
43,88 |
70.083.029,54 |
38,47 |
79.409.662,11 |
41,65 |
|
ASSETS (A + B +
C + D) |
158.449.414,67 |
|
182.192.319,15 |
|
190.667.419,12 |
|
|
|
||||||
|
A) SHAREHOLDERS
EQUITY |
96.606.492,90 |
60,97 |
104.300.219,12 |
57,25 |
105.885.127,65 |
55,53 |
|
B) DEFERRED
INCOME |
42.712,37 |
0,03 |
49.486,00 |
0,03 |
4.662,08 |
0,00 |
|
C) PROVISIONS
FOR LIABILITIES AND EXPENSES |
267.450,47 |
0,17 |
267.450,47 |
0,15 |
267.450,47 |
0,14 |
|
D) LONG TERM
LIABILITIES |
20.852.146,77 |
13,16 |
32.605.301,95 |
17,90 |
28.490.046,69 |
14,94 |
|
E) SHORT TERM
LIABILITIES |
40.680.612,16 |
25,67 |
44.969.861,61 |
24,68 |
56.020.132,23 |
29,38 |
|
F) SHORT TERM
PROVISIONS FOR LIABILITIES AND EXPENSES |
|
|
|
|
|
|
|
LIABILITIES (A + B + C + D + E + F) |
158.449.414,67 |
|
182.192.319,15 |
|
190.667.419,12 |
|
Financial Balance
Composition
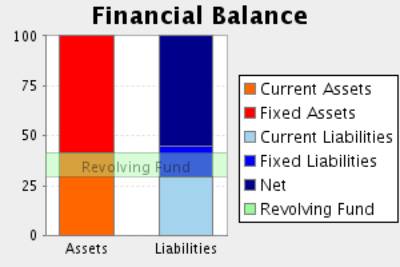
Comments on Financial Balance
In the 2004, the assets of the company were formed in 56,12% of Fixed
Assets and in 43,88% of Current Assets.This assets were financed in 61,00% with
own capitals, and in 13,33% with long term debt and in 25,67% with current
liabilities.
The result of this financial structure is a positive turnover fund of
28.848.445,65 Euros, which is equivalent to 18,21% proportion of the
company’s total assets.
In the 2005, the assets of the company were formed in 61,53% of Fixed
Assets and in 38,47% of Current Assets.This assets were financed in 57,27% with
own capitals, and in 18,04% with long term debt and in 24,68% with current
liabilities.
The result of this financial structure is a positive turnover fund of
25.113.167,93 Euros, which is equivalent to 13,78% proportion of the
company’s total assets.
This measure has diminished with respect to the previous exercise in
12,95% having also diminished its proportion with respect to the total assets
of the company.
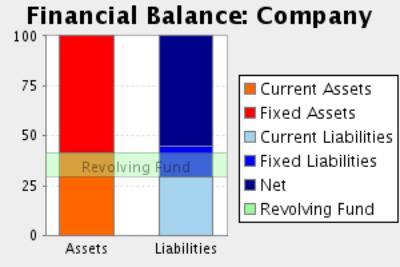
In the 2006, the assets of the company were formed in 58,35% of Fixed
Assets and in 41,65% of Current Assets.This assets were financed in 55,54% with
own capitals, and in 15,08% with long term debt and in 29,38% with current
liabilities.
The result of this financial structure is a positive turnover fund of
23.389.529,88 Euros, which is equivalent to 12,27% proportion of the
company’s total assets.
This measure has diminished with respect to the previous exercise in
6,86% having also diminished its proportion with respect to the total assets of
the company.
RATIOS
Main Ratios
|
|
31/12/2004 (12) |
31/12/2005 (12) |
31/12/2006 (12) |
|
STRUCTURAL RATIOS |
|
|
|
|
Management fund |
28.848.445,65 |
25.113.167,93 |
23.389.529,88 |
|
Management Fund Requirement |
20.295.566,29 |
24.055.576,92 |
25.943.149,82 |
|
Indebtedness (%) |
39,00 |
42,73 |
44,46 |
|
External Funds on Net Worth |
0,64 |
0,75 |
0,80 |
|
GENERAL ACTIVITY RATIO |
|
|
|
|
Turnover Increase (%) |
-0,20 |
-1,18 |
14,10 |
|
Added value growth (%) |
-3,20 |
-18,52 |
-11,09 |
|
Cash Flow |
16.691.139,88 |
12.968.469,32 |
13.825.175,85 |
|
Labour Productivity |
2,10 |
1,65 |
1,48 |
|
Assets turnover |
0,54 |
0,47 |
0,51 |
|
Breakdown Point |
61.492.617,80 |
73.659.638,96 |
95.668.648,28 |
|
Security Margin of the Breakdown Point (%) |
29,49 |
16,26 |
4,09 |
|
ACTIVITY RATIOS |
|
|
|
|
Average Payment Period |
186 |
175 |
185 |
|
Average Collection Period |
187 |
207 |
199 |
|
Inventory Turnover Period |
32 |
36 |
41 |
|
SOLVENCY RATIOS |
|
|
|
|
Payback Capacity |
0,27 |
0,17 |
0,16 |
|
Assets Guarantee |
2,56 |
2,34 |
2,25 |
|
Short Term Debts Proportion (%) |
65,83 |
57,77 |
66,08 |
|
Interest Coverage |
16,11 |
15,85 |
-0,39 |
|
LIQUIDITY RATIOS |
|
|
|
|
Current Ratio |
1,71 |
1,56 |
1,42 |
|
Immediate liquidity |
0,42 |
0,28 |
0,26 |
|
Treasury |
8.552.879,36 |
1.057.591,01 |
-2.553.619,94 |
|
Sales on Current Assets |
446 |
438 |
441 |
Results Analysis
Ratios
|
|
31/12/2004 (12) |
31/12/2005 (12) |
31/12/2006 (12) |
|
Economic profitability (%) |
8,55 |
3,76 |
0,90 |
|
Operating Profitability (%) |
15,71 |
8,04 |
1,77 |
|
Equity gearing |
2,17 |
2,51 |
5,55 |
|
Financial profitability (%) |
13,01 |
12,84 |
4,33 |
|
General Profitability (%) |
14,59 |
15,72 |
4,72 |
Comments on the
Results Analysis Ratios
The economic profitability in the year2005 achieved a 3,76% positive
level, due to a 8,04% economic margin and to an assets turnover of0,47%.
The economic profitability in the year has reduced from 8,55% up to
3,76% of2005, even if it remains positive. This fall is due to the decrease in
operating profitability, that has passe from 15,71% to 8,04%, as assets
turnover whose index has passed from 0,54 to 0,47%.
Financial profitability on 2005 achieved a 12,84%.
The company’s financial structure has instigated its economic
profitability with an indebtedness level of 2,51.
The general profitability on 2005 achieved a 15,72%.
The economic profitability in the year2006 achieved a 0,90% positive
level, due to a 1,77% economic margin and to an assets turnover of0,51%.
The economic profitability in the year has reduced from 3,76% up to
0,90% of2006, even if it remains positive. Assets turnover increase whose index
has passed from 0,47 to 0,51, could not compensate operating profitability
reduction from8,04% to the current level of 1,77%.
Financial profitability on 2006 achieved a 4,33%.
The company’s financial structure has instigated its economic
profitability with an indebtedness level of 5,55.
The general profitability on 2006 achieved a 4,72%.
SECTORIAL ANÁLYSIS
Large Capital Amounts and Financial Balance
Figures given in %
|
|
COMPANY (2006) |
SECTOR |
DIFFERENCE |
DIFFERENCE RELATIVE |
|
|
|
|
|
|
ASSETS |
|
|
|
|
|
|
|
|
|
|
A) DUE FROM
SHAREHOLDERS FOR UNCALLED CAPITAL |
|
0,00 |
|
|
|
|
|
|
|
|
B) FIXED ASSETS |
58,35 |
39,34 |
19,01 |
48,32 |
|
|
|
|
|
|
C) DEFERRED
EXPENSES |
|
0,23 |
|
|
|
|
|
|
|
|
D) CURRENT
ASSETS |
41,65 |
60,43 |
-18,78 |
-31,08 |
|
|
|
|
|
|
ASSETS (A + B +
C + D) |
100 |
100 |
|
|
|
|
|
|
|
|
|
|
|
|
|
|
|
|
|
|
|
|
COMPANY (2006) |
SECTOR |
DIFFERENCE |
DIFFERENCE RELATIVE |
|
|
|
|
|
|
LIABILITIES |
|
|
|
|
|
|
|
|
|
|
A) SHAREHOLDERS
EQUITY |
55,53 |
54,07 |
1,46 |
2,70 |
|
|
|
|
|
|
B) DEFERRED
INCOME |
0,00 |
0,22 |
-0,22 |
-100,00 |
|
|
|
|
|
|
C) PROVISIONS FOR
LIABILITIES AND EXPENSES |
0,14 |
1,36 |
-1,22 |
-89,72 |
|
|
|
|
|
|
D) LONG TERM
LIABILITIES |
14,94 |
8,78 |
6,16 |
70,20 |
|
|
|
|
|
|
E) SHORT TERM
LIABILITIES |
29,38 |
35,26 |
-5,88 |
-16,69 |
|
|
|
|
|
|
F) SHORT TERM
PROVISIONS FOR LIABILITIES AND EXPENSES |
|
0,31 |
|
|
|
|
|
|
|
|
LIABILITIES (A + B + C + D + E + F) |
100 |
100 |
|
|
|
|
|
|
|
Sectorial Financial
Balance Comparison
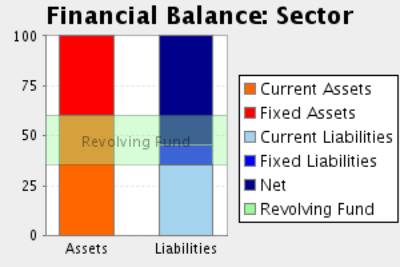
Comments to the Sectorial Analysis
In the 2006, the assets of the company were formed in 58,35% of fixed
assets and in 41,65Current Assets % In the sector, the proportion of fixed
assets was of 39,57%, 47,46% inferior, and the proportion of current assets was
of 60,43%, 31,08% superior.
The assets were financed in the company in 55,54% with own capitals , in
15,08% with fixed liabilities and in 29,38% with current liabilities In the
sector, the self financing represented 54,29%, 2,31% inferior. On the other
hand the long term debts represented in the sector an average of 10,14%
financing, with a relative difference of 48,72% in favour of the companyAnd,
short term liabilities represented in the sector an average of 35,57%
financing, with a relative difference of 17,41% favourable to the sector
The result of this company’s financial structure is a turnover fund that
represents 12,27% of the total assets; in the sector, this same proportion is
24,86%, therefore, we can say that the company’s turnover fund is 50,64%
smaller than the sector one.
Analytical Account of Results
Figures given in %
|
|
COMPANY (2006) |
SECTOR |
DIFFERENCE |
DIFFERENCE RELATIVE |
|
Turnover |
97,44 |
98,98 |
-1,54 |
-1,55 |
|
Other operating income |
2,56 |
1,02 |
1,54 |
150,24 |
|
Production Value |
100,00 |
100,00 |
0,00 |
0,00 |
|
Operating expenses |
57,96 |
56,04 |
1,92 |
3,43 |
|
Other operation expenses |
21,16 |
18,26 |
2,90 |
15,89 |
|
Added value |
20,88 |
25,70 |
-4,82 |
-18,76 |
|
Labour cost |
14,11 |
17,23 |
-3,12 |
-18,10 |
|
Gross Economic Result |
6,77 |
8,47 |
-1,70 |
-20,10 |
|
Assets depreciation |
4,48 |
3,02 |
1,46 |
48,10 |
|
Variation in provision for current assets and bad debt losses |
0,57 |
0,20 |
0,37 |
187,88 |
|
Net Economic Result |
1,72 |
5,25 |
-3,53 |
-67,24 |
|
Financial income |
5,35 |
0,84 |
4,51 |
539,95 |
|
Financial Charges |
1,78 |
1,31 |
0,47 |
36,19 |
|
Variation in financial investment provision |
|
0,00 |
|
|
|
Ordinary Activities Result |
5,30 |
4,78 |
0,52 |
10,90 |
|
Extraordinary income |
2,84 |
1,03 |
1,81 |
175,73 |
|
Extraordinary charges |
0,65 |
0,54 |
0,11 |
19,71 |
|
Variation in provision in fixed assets |
4,22 |
0,11 |
4,11 |
3.667,86 |
|
Results before Taxes |
3,27 |
5,15 |
-1,88 |
-36,55 |
|
Corporate taxes |
-1,33 |
1,36 |
-2,69 |
-197,58 |
|
Net Result |
4,60 |
3,79 |
0,81 |
21,34 |
|
Assets depreciation |
4,48 |
3,02 |
1,46 |
48,10 |
|
Change of Provisions |
4,78 |
0,31 |
4,47 |
1.436,98 |
|
Net Self-Financing |
13,86 |
7,13 |
6,73 |
94,50 |
Main Ratios
|
|
COMPANY (2006) |
PTILE25 |
PTILE50 |
PTILE75 |
|
STRUCTURAL RATIOS |
|
|
|
|
|
Management fund |
23.389.529,88 |
5.818,01 |
11.350,19 |
26.856,80 |
|
Management Fund
Requirement |
25.943.149,82 |
3.812,00 |
7.406,16 |
16.937,96 |
|
Indebtedness (%) |
44,46 |
31,80 |
47,63 |
73,40 |
|
External Funds
on Net Worth |
0,80 |
0,47 |
0,91 |
2,77 |
|
GENERAL ACTIVITY
RATIO |
|
|
|
|
|
Turnover Increase (%) |
14,10 |
-4,62 |
3,63 |
7,66 |
|
Added value growth (%) |
-11,09 |
-12,78 |
-2,44 |
9,01 |
|
Cash Flow |
13.825.175,85 |
2.752,35 |
6.001,49 |
9.404,68 |
|
Labour Productivity |
1,48 |
1,26 |
1,38 |
1,75 |
|
Assets turnover |
0,51 |
0,74 |
1,46 |
1,75 |
|
Breakdown Point |
95.668.648,28 |
39.781.109,54 |
61.319.330,40 |
126.372.647,69 |
|
Security Margin of the Breakdown Point (%) |
4,09 |
4,79 |
9,79 |
19,67 |
|
ACTIVITY RATIOS |
|
|
|
|
|
Average Payment Period |
185 |
78 |
108 |
128 |
|
Average Collection Period |
199 |
91 |
114 |
144 |
|
Inventory Turnover Period |
41 |
33 |
42 |
53 |
|
SOLVENCY RATIOS |
|
|
|
|
|
Payback Capacity |
0,16 |
0,10 |
0,16 |
0,35 |
|
Assets Guarantee |
2,25 |
1,34 |
2,08 |
3,05 |
|
Short Term Debts Proportion (%) |
66,08 |
65,05 |
87,05 |
95,12 |
|
Interest Coverage |
-0,39 |
1,48 |
9,31 |
22,81 |
|
LIQUIDITY RATIOS |
|
|
|
|
|
Current Ratio |
1,42 |
1,25 |
1,72 |
2,16 |
|
Immediate liquidity |
0,26 |
0,03 |
0,10 |
0,30 |
|
Treasury |
-2.553.619,94 |
-3.909,36 |
20,83 |
4.032,89 |
|
Sales on Current Assets |
441 |
538 |
753 |
985 |
Results Analysis
Ratios
|
|
COMPANY (2006) |
PTILE25 |
PTILE50 |
PTILE75 |
|
Economic profitability (%) |
0,90 |
2,75 |
8,26 |
12,22 |
|
Operating Profitability (%) |
1,77 |
2,14 |
4,44 |
9,44 |
|
Equity gearing |
5,55 |
1,35 |
1,84 |
3,06 |
|
Financial profitability (%) |
4,33 |
3,96 |
12,84 |
19,09 |
|
General Profitability (%) |
4,72 |
1,30 |
3,74 |
7,67 |
NOTES
ABOUT YOUR REQUEST:
-The correct address is Ptda Torreta, S/N 12110 Alcora (Castellon).
Apdo 18.
FOREIGN EXCHANGE
RATES
|
Currency |
Unit
|
Indian Rupees |
|
US Dollar |
1 |
Rs.49.69 |
|
UK Pound |
1 |
Rs.72.96 |
|
Euro |
1 |
Rs.63.46 |
RATING
EXPLANATIONS
|
RATING |
STATUS |
PROPOSED CREDIT LINE |
|
|
>86 |
Aaa |
Possesses an extremely sound financial base with the strongest
capability for timely payment of interest and principal sums |
Unlimited |
|
71-85 |
Aa |
Possesses adequate working capital. No caution needed for credit
transaction. It has above average (strong) capability for payment of interest
and principal sums |
Large |
|
56-70 |
A |
Financial & operational base are regarded healthy. General
unfavourable factors will not cause fatal effect. Satisfactory capability for
payment of interest and principal sums |
Fairly Large |
|
41-55 |
Ba |
Overall operation is considered normal. Capable to meet normal
commitments. |
Satisfactory |
|
26-40 |
B |
Unfavourable & favourable factors carry similar weight in credit consideration.
Capability to overcome financial difficulties seems comparatively below
average. |
Small |
|
11-25 |
Ca |
Adverse factors are apparent. Repayment of interest and principal sums
in default or expected to be in default upon maturity |
Limited with
full security |
|
<10 |
C |
Absolute credit risk exists. Caution needed to be exercised |
Credit not
recommended |
|
NR |
In view of the lack of information, we have no basis upon which to
recommend credit dealings |
No Rating |
|
This score serves as a reference to assess SC’s credit risk
and to set the amount of credit to be extended. It is calculated from a
composite of weighted scores obtained from each of the major sections of this
report. The assessed factors and their relative weights (as indicated through
%) are as follows:
Financial
condition (40%) Ownership
background (20%) Payment
record (10%)
Credit history
(10%) Market trend
(10%) Operational
size (10%)