![]()
MIRA
INFORM REPORT
|
Report Date : |
05.12.2008 |
IDENTIFICATION
DETAILS
|
Name : |
INDUSTRIA DE DISENO TEXTIL SA INDITEX |
|
|
|
|
Registered Office : |
Avenida Diputacio
(Pg Ind Sabon. Ed
Inditex), S/N, Cp 15142, Arteixo La Coruña |
|
|
|
|
Country : |
Spain |
|
|
|
|
Financials (as on) : |
31.01.2008 |
|
|
|
|
Date of Incorporation : |
|
|
|
|
|
Legal Form : |
Joint Stock Company |
|
|
|
|
Line of Business : |
RATING &
COMMENTS
|
MIRA’s Rating : |
A |
|
RATING |
STATUS |
PROPOSED CREDIT LINE |
|
|
56-70 |
A |
Financial & operational base are regarded healthy. General
unfavourable factors will not cause fatal effect. Satisfactory capability for
payment of interest and principal sums |
Fairly Large |
|
Maximum Credit Limit : |
6.000.000,00 € |
|
|
|
|
Status : |
Good |
|
|
|
|
Payment Behaviour : |
Regular |
|
|
|
|
Litigation : |
Clear |
FINANCIAL REPORT
INDUSTRIA DE DISENO TEXTIL SA ”INDITEX”
TAX NUMBER: A15075062
EXECUTIVE SUMMARY
Identification
Current Business Name: INDUSTRIA DE
DISENO TEXTIL SA
Commercial Name: STRADIVARIUS
Commercial Name: INDITEX
Other names: NO
Current Address: AVENIDA DIPUTACIO
(PG IND SABON. ED INDITEX), S/N, CP 15142, ARTEIXO LA
CORUÑA
Branches: 3
Telephone number: 981647109 Fax: 981185544
URL: www.inditex.com
Corporate e-mail: direct@inditex.com
Commercial Risk
Credit Appraisal: 6.000.000,00 €
RAI: NO
Legal Actions: YES
Financial Information
Latest Balance sheet sales (2008): 3.299.641.000,00 € (MERCANTILE REGISTER)
Result: 699.699.000 €
Total Assets:
3.387.874.000 €
Social Capital: 93.500.000,00 €
Employees: 1.053
Commercial Information
Constitution Date: 12/06/1985
Business activity: Wholesale of
clothing (outerwear)
NACE Code: 5142
International Operations: Imports and
Exports
Corporate
Structure
President:
Parent Company:
Participations: 106
Other Complementary Information
Latest proceeding published in BORME: 03/10/2008 Registration
of accounts
Latest press article: 25/11/2008 ELECONOMISTA (NEW
PRODUCTS AND ACTIVITIES INFORMATION)
Bank Entities: Yes
COMMERCIAL RISK
Credit Appraisal
Maximum Credit
(from 0 a 6,000,000 €)
Favourable to 6.000.000,00 €
Rating Evolution

Financial Situation
Fiscal year2008
|
Treasury |
Restrained |
|
Indebtedness |
Weak |
|
Profitability |
Excellent |
|
Balance |
Weak |
Performance
|
Legal Actions |
None or Negligible |
|
Business
Trajectory |
Excellent |
COMPANY NOT REGISTERED IN THE R.A.I.
This company is not registered in the Disputed Bills register (R.A.I.)
INCIDENTS

Summary
LEGAL ACTIONS: No legal incidences registered
|
CLAIM FILED
AGAINST THE ADMINISTRATION: 1 ( last: 11/04/2001 )With the
Social Security: |
0 |
|
With the Tax
Authorities: |
0 |
|
With Other Official bodies: |
1 |
AFFECTED BY: No significant element.
Last claim filed against the
administration
Figures expressed in €
WITH OTHER OFFICIAL BODIES
1 claim(s)
Seizures
|
DATE |
ORGANIZATION |
AMOUNT |
|
11/04/2001 |
DEPUTATION/ DELEGATION DE LA CORUNA |
|
FINANCIAL ELEMENTS AND SECTORIAL
COMPARATIVE
FINANCIAL ELEMENTS
Figures given in thousands €
|
|
2006 (12) |
2007 (12) |
2008 (12) |
% ASSETS |
|
|
|
|
|
|
BALANCE SHEET
ANALYSIS |
|
|
|
|
|
|
|
|
|
|
OWN FUNDS |
1.447.345,00 |
1.586.334,00 |
1.772.910,00 |
52,33 |
|
|
|
|
|
|
DEBT |
1.230.805,00 |
1.490.516,00 |
1.614.964,00 |
47,67 |
|
|
|
|
|
|
FIXED ASSETS |
1.289.940,00 |
1.776.111,00 |
1.856.365,00 |
54,79 |
|
|
|
|
|
|
TOTAL ASSETS |
2.678.150,00 |
3.076.850,00 |
3.387.874,00 |
|
|
|
|
|
|
|
|
|
|
|
|
|
|
|
|
|
|
|
2006 (12) |
2007 (12) |
2008 (12) |
% SALES |
|
|
|
|
|
|
PROFIT AND LOSS
ACCOUNT ANALYSIS |
|
|
|
|
|
|
|
|
|
|
SALES |
2.332.152,00 |
2.860.367,00 |
3.299.641,00 |
|
|
|
|
|
|
|
ADDED VALUE |
194.771,00 |
308.137,00 |
390.662,00 |
11,84 |
|
|
|
|
|
|
EBITDA |
125.532,00 |
241.036,00 |
298.995,00 |
9,06 |
|
|
|
|
|
|
EBIT |
97.024,00 |
211.467,00 |
272.273,00 |
8,25 |
|
|
|
|
|
|
NET RESULT |
520.669,00 |
558.282,00 |
699.699,00 |
21,21 |
|
|
|
|
|
Balance Sheets Items
Analysis


Balance Sheet Comments
Total assets of the company grew 14,89% between 2006 and 2007.
This growth is a consequence of the fixed assets increase of 37,69%.
This growth has been mainly financed with a debt increase of 21,10%.
Nevertheless the net worth increased 9,60%.
Total assets of the company grew 10,11% between 2007 and 2008.
This growth has been inferior in the case of the fixed assets that
increased just in 4,52%.
This growth has been financed, on a wider scale, with a Shareholders’
equity increase of 11,76% and in a smaller proportion with an debt increase of
8,35%.
Profit and Loss Account Analysis


Profit and Loss Account Comments
The company’s sales figure grew 22,65% between 2006 and 2007.
The company’s EBIT grew 117,95% between 2006 and 2007.
This evolution implies an increase in the company’s operating
profitability.
The result of these variations is an increase of the company’s Economic
Profitability of 89,71% in the analysed period, being this profitability of
6,87% in the year 2007.
The company’s Net Result grew 7,22% between 2006 and 2007.
This evolution, compared to the EBIT’s performance, implies that the
financial and extraordinary activities have had a negative effect in the
company’s Financial Profitability.
The result of these variations is a reduction of the company’s
profitability of 2,17% in the analysed period, being equal to 35,19% in the
year 2007.
The company’s sales figure grew 15,36% between 2007 and 2008.
The company’s EBIT grew 28,75% between 2007 and 2008.
This evolution implies an increase in the company’s operating
profitability.
The result of these variations is an increase of the company’s Economic
Profitability of 16,93% in the analysed period, being this profitability of
8,04% in the year 2008.
The company’s Net Result grew 25,33% between 2007 and 2008.
This evolution, compared to the EBIT’s performance, implies that the
financial and extraordinary activities have had a negative effect in the
company’s Financial Profitability.
The result of these variations is an increase of the company’s Economic
Profitability of 12,14% in the analysed period, being equal to 39,47% in the
year 2008.
ANNUAL FINANCIAL REPORT ADDITIONAL DATA
Source: annual financial report 2007
Results Distribution
Figures given in €
|
DISTRIBUTION
BASE |
DISTRIBUTION TO |
||
|
Profit and Loss |
699.699.000,00 |
Retained earnings |
0,00 |
|
Carry Over |
0,00 |
Voluntary Reserve |
47.699.000,00 |
|
Voluntary reserves |
0,00 |
Prior years losses |
0,00 |
|
Reserves |
0,00 |
Carry Over |
0,00 |
|
Other concepts |
0,00 |
Other funds |
0,00 |
|
Total of Amounts to be distributed |
699.699.000,00 |
Dividends |
652.000.000,00 |
|
|
|
Other Applications |
0,00 |
Auditing
Auditors’ opinion: FAVOURABLE
Auditor: KPMG AUDITORES S.L.
COMPARATIVE SECTOR ANALYSIS
Values table
Figures expressed in %
|
|
COMPANY (2008) |
SECTOR |
DIFFERENCE |
DIFFERENCE RELATIVE |
|
|
|
|
|
|
BALANCE SHEET
ANALYSIS: % on the total assets |
|
|
|
|
|
|
|
|
|
|
OWN FUNDS |
52,33 |
36,54 |
15,79 |
43,20 |
|
|
|
|
|
|
DEBT |
47,67 |
63,46 |
-15,79 |
-24,88 |
|
|
|
|
|
|
FIXED ASSETS |
54,79 |
24,38 |
30,41 |
124,71 |
|
|
|
|
|
|
|
|
|
|
|
|
|
|
|
|
|
|
COMPANY (2008) |
SECTOR |
DIFFERENCE |
DIFFERENCE RELATIVE |
|
|
|
|
|
|
PROFIT AND LOSS
ACCOUNT ANALYSIS: % on the total operating income |
|
|
|
|
|
|
|
|
|
|
SALES |
96,38 |
97,56 |
-1,17 |
-1,20 |
|
|
|
|
|
|
ADDED VALUE |
11,41 |
13,17 |
-1,76 |
-13,37 |
|
|
|
|
|
|
EBIT |
7,95 |
4,86 |
3,09 |
63,51 |
|
|
|
|
|
|
NET RESULT |
20,44 |
4,42 |
16,02 |
362,71 |
|
|
|
|
|
Sector Composition
Compared sector (NACE): 514
Number of companies: 171
Size (Sales Figure) : > 40.000.000,00
Euros
Comments on the sectorial comparative
Compared to its sector the assets of the companies show a greater
proportion of fixed assets. Specifically the difference with the sector average
is 30,41% , which means a relative difference of 124,71% .
In liabilities composition the company appeals on a wider scale to self
financing, being the proportion of net worth of 15,79% superior, which means a
relative difference of 43,20% . As a consequence, external financing sources
are less used by the company in 15,79% less than the sector, which means a
difference of 24,88% .
The proportion that the sales mean to the company’s total ordinary
income is 96,38%, 1,17% lower than in the sector, which means a relative
difference of 1,20% .
The company’s EBIT was positive and was 7,95% with regard to the total
ordinary income, 3,09% higher than in the sector, which means a relative
difference of 63,51% .
The company’s capacity to generate operating income is higher than the
one of the sector as its ratio EBIT/Sales is higher (ES Company versus ES
Sector).
The company’s net result was positive and equal to 20,44% with regard to
the total ordinary income, 16,02% less than the sector, which means a relative
difference of 362,71% .
The financial and extraordinary results and the tax impact have had a
more positive impact on the Net result in the company than in the sector; as a
consequence, the company shows a better Net Result/EBIT ratio.
ADDRESSES
Current Legal Seat Address:
AVENIDA DIPUTACIO (PG IND SABON. ED INDITEX), S/N
15142 ARTEIXO LA CORUÑA
Previous Seat Address:
POLIGONO INDUSTRIAL SABON - PAR, 79
15142
ARTEIXO LA CORUÑA
|
STREET |
POSTAL CODE |
TOWN |
PROVINCE |
|
AVENIDA VERGE MONTSERRAT S/N |
08820 |
EL PRAT DE LLOBREGAT |
Barcelona |
|
POLIGONO INDUSTRIAL ONZONILLA |
24231 |
ONZONILLA |
León |
|
STREET TURIASO 11 PG. PZA. |
50197 |
ZARAGOZA |
Zaragoza |
3 branches registered
CORPORATE STRUCTURE
ADMINISTRATIVE LINKS
Main Board members, Directors and Auditor ![]()
|
POSITION |
SURNAMES AND
NAME |
APPOINTMENT DATE |
|
|
PRESIDENT |
ORTEGA GAONA AMANCIO |
06/09/2005 |
|
|
VICEPRESIDENT |
ISLA ALVAREZ DE TEJERA PABLO |
02/11/2005 |
|
|
VICEPRESIDENT |
ESPINOSA DE LOS MONTEROS Y BERNALDO DE QUIROS CARL |
02/11/2005 |
|
|
CHIEF OFFICER |
ABRIL ABADIN ANTONIO GERARDO |
17/09/2003 |
|
|
CHIEF OFFICER |
LUZON LOPEZ FRANCISCO |
21/09/2004 |
|
|
CHIEF OFFICER |
URGOITI LOPEZ DE OCANA JUAN MANUEL |
06/09/2005 |
|
|
CHIEF OFFICER |
VAZQUEZ MARINO JOSE LUIS |
06/09/2005 |
|
|
CHIEF OFFICER |
MILLER IRENE RUTH |
23/08/2006 |
|
|
CHIEF OFFICER |
GARTLER SL |
18/09/2007 |
|
|
AUDITOR |
APPOINTMENT DATE |
||
|
KPMG AUDITORES SL |
02/09/2008 |
||
Functional Managers
|
POSITION |
SURNAMES AND
NAME |
|
Financial Manager |
RUBIO MERINO ANTONIO |
|
Human Resources Manager |
LOPEZ BEGONA |
|
Marketing Manager |
JOSE MARIA GONZALEZ |
|
Exports Manager |
ROMAY DE LA COLINA JOSE MARIA |
|
IT Manager |
SALGADO JUAN |
FINANCIAL LINKS
|
|
BUSINESS NAME |
CIF / COUNTRY |
% |
SOURCE |
DATA INF. |
|
|
GARTLER S.L. |
B70080601 |
50,01 |
TRADE REG. |
31/01/2008 |
|
|
CHASE NOMINEES LTD |
UNITED KINGDOM |
10,00 |
TRADE REG. |
31/01/2008 |
|
|
PARTLER 2006 S.L. |
B70080593 |
9,28 |
TRADE REG. |
31/01/2008 |
|
|
ROSP CORUNNA
PARTICIPACIONES EMPRESARIALES S.L. |
B15792278 |
6,99 |
TRADE REG. |
31/01/2008 |
|
|
CAPITAL RESEARCH
& MANAGEMENT COMPANY |
|
5,17 |
STOCK EXCH. |
12/02/2008 |
|
|
STATE STREET
BANK AND TRUST CO |
ESTADOS UNIDOS |
5,05 |
STOCK EXCH. |
13/11/2007 |
|
|
BUSINESS NAME |
CIF / COUNTRY |
% |
SOURCE |
DATA INF. |
|
|
ZARA RETAIL KOREA LTD |
REPÚBLICA DE COREA |
100,00 |
TRADE REG. |
31/01/2008 |
|
|
SAMLOR S.A. |
A15022585 |
100,00 |
TRADE REG. |
31/01/2008 |
|
|
ZA CLOTHING IRELAND LTD |
IRELAND |
100,00 |
TRADE REG. |
31/01/2008 |
|
|
ZARA MAGYARORSZAG KFT |
HUNGRÍA |
100,00 |
TRADE REG. |
31/01/2008 |
|
|
ZARA UKRAINE LLC |
UCRANIA |
100,00 |
TRADE REG. |
31/01/2008 |
|
|
ZARA SVERIGE AB |
SUECIA |
100,00 |
TRADE REG. |
31/01/2008 |
CREDIT INFORMATION
Constitution Date: 12/06/1985
Business activity 
Activity: Wholesale of clothing (outerwear)
NACE Code: 5142
NACE Activity: Wholesale of
clothing and footwear
Business: LA FABRICACION, PRODUCCION, COMERCIALIZACION,
IMPORTACION Y EXPORTACION, Y VENTA AL POR MAYOR Y DETALLE DE MATERIAS PRIMAS
TEXTILES, HILADOS, TELAS, TANTO TEJIDAS COMO TRICOTADAS, Y SU ACABADO, ASI COMO
DE PRENDAS Y ARTI
Number of total employees: 1.053 (2008)
Number of fixed employees: 98,20%
Number of
temporary employees: 1,80%
Employees evolution

COMMERCIAL OPERATIONS 
PURCHASES
Payments (estimated):
Import Percentage: 40%
Imports from: C.E., Paises
Asiaticos
SALES
Collection (estimated):
Export Percentage: 18%
Exports to: C.E. EE.UU
National Distribution: 82%
Banks 
|
ENTITY |
BRANCH |
ADDRESS |
TOWN OR CITY |
PROVINCE |
|
BANCO BILBAO VIZCAYA ARGENTARIA, S.A. |
|
|
ARTEIXO |
|
|
BANCO PASTOR, S.A. |
|
|
A CORUNA |
|
|
BANCO CAIXA GERAL, S.A. |
|
|
ARTEIXO |
|
|
BANCO SANTANDER, S.A. |
|
|
ARTEIXO |
|
|
CAIXA AFORROS VIGO,OURENSE E PONTEVEDRA(CAIXANOVA) |
|
|
ARTEIXO |
|
6 bank entities registered
Brands, Signs and Commercial
Names 
ANAGRAM: INDITEX
Brand name: FOR & FROM SPECIAL PEOPLE (Valid)
Type: DENOMINATIVE Date: 14/07/2008
Brand name: PULL BY PULL & BEAR (Valid)
Type: DENOMINATIVE Date: 02/04/2008
Brand name: GRUPO INDITEX (Valid)
Type: DENOMINATIVE Date: 29/01/2008
Brand name: SAFE TO WEAR (Valid)
Type: JOINT Date: 27/12/2007
Brand name: INDITEX (Valid)
Type: DENOMINATIVE Date: 03/09/2007
LEGAL STRUCTURE
Constitution Data
Register Date: 12/06/1985
Current Legal Form: JOINT STOCK
COMPANY
Current Capital:
93.500.000,00 €
Legal Aspects
Obligation to fill in Financial
Statements: YES
Chamber census: YES (2006)
Listed on a Stock Exchange: YES
Type of quoting: ONLY EQUITY
SECURITIES
Stock Exchanges in which it is listed: MADRID, BARCELONA,
BILBAO, VALENCIA
B.O.R.M.E.(Official Companies Registry Gazette) ![]()
Registered Proceedings
|
PROCEEDINGS |
DATE |
NOTICE NUM. |
TRADE REG. |
|
Re-elections |
19/09/2008 |
439143 |
La Coruña |
|
Re-elections |
19/09/2008 |
439142 |
La Coruña |
|
Re-elections |
02/09/2008 |
416511 |
La Coruña |
Other Proceedings published
|
PROCEEDINGS |
DATE |
NOTICE NUM. |
TRADE REG. |
|
Registration of
accounts (2007) Individual |
03/10/2008 |
749406 |
La Coruña |
|
Registration of
accounts (2007) Consolidated |
03/10/2008 |
748040 |
La Coruña |
Press articles

25/11/2008 ELECONOMISTA (NEW PRODUCTS AND ACTIVITIES
INFORMATION)
INDITEX HA PUESTO EN MARCHA UNA NUEVA COLECCION INFANTIL BAJO EL NOMBRE
DE BOYS & GIRLS CON LA QUE PRETENDE COMPLETAR LA OFERTA ACTUAL DE SU
FORMATO MASSIMO DUTTI. ASIMISMO, INDITEX SE HA DECIDIDO POR EXPLOTAR EL SECTOR
DE LAS GAFAS DE SOL CON SU NUEVA MARCA, EYEWEAR, QUE PONDRA A LA VENTA EN LA
MAYORIA DE SUS FORMATOS. LA CADENA ESPERA ALCANZAR LAS MAS DE 500 APERTURAS AL
FINALIZAR SU EJERCICIO FISCAL, EN MARZO DE 2009.
18/11/2008 EL DIARIO VASCO (BRANCHES INFORMATION)
LA PROMOTORA DEL CENTRO COMERCIAL ERREBAL CENTER TIENE AVANZADOS LOS
ACUERDOS DE VENTA DE SU SUPERFICIE A FIRMAS COMO INDITEX, CORTEFIEL Y EL GRUPO
HOLANDES C&A. EN BASE A LOS PLAZOS PREVISTOS, EL CENTRO COMERCIAL ENTRARA
EN FUNCIONAMIENTO EN 2010 EN EIBAR. POR LO QUE RESPECTA A INDITEX, SE DA COMO
SEGURO SE ABRAN TIENDAS DE MASSIMO DUTTI, BERSHKA, STRADIVARIUS, OYSHO O PULL
AND BEAR.
Complementary Information
Por causas ajenas a nuestra voluntad el
deposito de cuentas del
ejercicio 2004, se ha recibido erroneamente.
Por causas ajenas a nuestra voluntad el deposito de cuentas del ejer-
cicio 2007 se ha recibido erroneamente.
FINANCIAL INFORMATION
The information on the last account contained in this report is
extracted from the Mercantile Register file of the legal address of the Company
and dated 29/10/2008.
BALANCE SHEET
Assets
Figures given in thousands €
|
|
31/01/2006 (12) |
31/01/2007 (12) |
31/01/2008 (12) |
|
A) DUE FROM SHAREHOLDERS FOR UNCALLED CAPITAL |
|
|
|
|
B) FIXED ASSETS |
1.289.940,00 |
1.776.111,00 |
1.856.365,00 |
|
I. Incorporation costs |
|
|
|
|
II. Intangible fixed assets |
10.361,00 |
5.584,00 |
5.440,00 |
|
R & D expenses |
|
|
|
|
Concessions, patents, licences , trademarks |
14.142,00 |
14.979,00 |
15.968,00 |
|
Goodwill |
|
|
|
|
Acquired rights from finance leases |
45,00 |
45,00 |
45,00 |
|
Software |
3.790,00 |
4.428,00 |
4.663,00 |
|
Leasing |
5.048,00 |
|
|
|
Cash advance |
489,00 |
554,00 |
554,00 |
|
Provisions |
|
|
|
|
Depreciation |
-13.153,00 |
-14.422,00 |
-15.790,00 |
|
III. Tangible fixed assets |
309.068,00 |
415.794,00 |
355.810,00 |
|
Property, plant and equipment |
169.352,00 |
190.106,00 |
257.301,00 |
|
Machinery, equipment and other |
210.993,00 |
212.784,00 |
128.036,00 |
|
Other property plant and equipment |
12.333,00 |
16.585,00 |
13.300,00 |
|
Prepaid expenses on fixed assets |
20.495,00 |
122.250,00 |
35.949,00 |
|
Other assets |
60.306,00 |
66.640,00 |
70.934,00 |
|
Provisions |
|
|
|
|
Depreciation |
-164.411,00 |
-192.571,00 |
-149.710,00 |
|
IV. Financial fixed assets |
970.422,00 |
1.347.763,00 |
1.488.188,00 |
|
Shares in affiliated companies |
1.084.679,00 |
1.516.621,00 |
1.703.121,00 |
|
Receivables in affiliated companies |
|
|
|
|
Shares in associated companies |
89.412,00 |
89.412,00 |
113.777,00 |
|
Loans to associated companies |
|
|
|
|
Securities |
5.257,00 |
5.257,00 |
5.357,00 |
|
Other loans |
20.000,00 |
|
|
|
Long term deposits and guarantees |
646,00 |
631,00 |
633,00 |
|
Provisions |
-229.572,00 |
-264.158,00 |
-334.700,00 |
|
Taxes receivable |
|
|
|
|
V.Owners equity |
89,00 |
6.970,00 |
6.927,00 |
|
VI.Long term trade liabilities |
|
|
|
|
C) DEFERRED EXPENSES |
567,00 |
|
|
|
D) CURRENT ASSETS |
1.387.643,00 |
1.300.739,00 |
1.531.509,00 |
|
I. Shareholders by required outlays |
|
|
|
|
II. Stocks |
207.914,00 |
265.095,00 |
334.499,00 |
|
Goods available for sale |
188.821,00 |
238.477,00 |
299.019,00 |
|
Raw material inventory |
19.003,00 |
26.528,00 |
35.480,00 |
|
Work in Progress |
|
|
|
|
Finished goods |
|
|
|
|
Subproducts and recycled materials |
|
|
|
|
Cash advance |
90,00 |
90,00 |
|
|
Provisions |
|
|
|
|
III. Debtors |
375.373,00 |
414.713,00 |
407.439,00 |
|
Clients |
25.818,00 |
32.511,00 |
49.582,00 |
|
Amounts owned by affiliated companies |
299.394,00 |
271.323,00 |
341.882,00 |
|
Amounts owned by associated companies |
|
|
|
|
Other debts |
1.409,00 |
4.121,00 |
14.243,00 |
|
Staff Expenses |
203,00 |
294,00 |
257,00 |
|
Government |
48.629,00 |
106.681,00 |
1.555,00 |
|
Provisions |
-80,00 |
-217,00 |
-80,00 |
|
IV. Temporary financial investment |
798.075,00 |
610.545,00 |
784.702,00 |
|
Shares in affiliated companies |
|
|
|
|
Receivables in affiliated companies |
435.694,00 |
558.681,00 |
683.988,00 |
|
Shares in associated companies |
|
|
|
|
Loans to associated companies |
|
|
|
|
Short term investment |
|
|
|
|
Other loans |
362.372,00 |
51.855,00 |
100.705,00 |
|
Short Term Deposit and guarantees |
9,00 |
9,00 |
9,00 |
|
Provisions |
|
|
|
|
V. Short-term own shares |
|
|
|
|
VI. Treasury |
6.281,00 |
10.386,00 |
4.869,00 |
|
VII. Periodification adjustments |
|
|
|
|
ASSETS (A + B + C + D) |
2.678.150,00 |
3.076.850,00 |
3.387.874,00 |
Assets composition


Liabilities
Figures given in thousands €
|
|
31/01/2006 (12) |
31/01/2007 (12) |
31/01/2008 (12) |
|
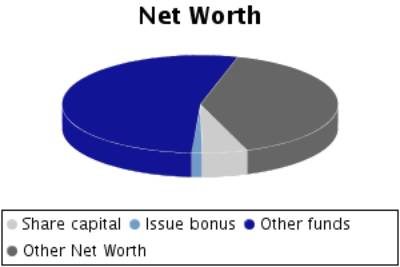
A) SHAREHOLDERS EQUITY |
1.433.685,00 |
1.574.336,00 |
1.750.394,00 |
|
I. Share capital |
93.500,00 |
93.500,00 |
93.500,00 |
|
II. Issue bonus |
20.379,00 |
20.379,00 |
20.379,00 |
|
III.Revaluation reserve |
1.692,00 |
1.692,00 |
1.692,00 |
|
IV.Reserves |
797.445,00 |
900.483,00 |
935.124,00 |
|
Retained earnings |
18.700,00 |
18.700,00 |
18.700,00 |
|
Sinking fund from owner equity |
89,00 |
6.970,00 |
6.927,00 |
|
Reserve for the parent company capital |
|
|
|
|
Statutory reserve |
|
|
|
|
Other funds |
778.656,00 |
|
|
|
Capital adjustments in Euros |
|
874.813,00 |
909.497,00 |
|
V.Results from previous years |
|
|
|
|
Carry Over |
|
|
|
|
Prior years losses |
|
|
|
|
Loans from partners for losses compensation |
|
|
|
|
VI.Profit and Losses |
520.669,00 |
558.282,00 |
699.699,00 |
|
VII.Dividend paid during the year |
|
|
|
|
VIII.Own shares for capital reduction |
|
|
|
|
B) DEFERRED INCOME |
13.660,00 |
11.998,00 |
22.516,00 |
|
Capital grants |
|
58,00 |
77,00 |
|
Positive change difference |
1.468,00 |
|
7.899,00 |
|
Other deferred income |
12.192,00 |
11.940,00 |
14.540,00 |
|
Fiscal deferred income |
|
|
|
|
C) PROVISIONS FOR LIABILITIES AND EXPENSES |
25.700,00 |
87.335,00 |
42.367,00 |
|
Provision for pensions plans |
52,00 |
52,00 |
|
|
Provision for taxes |
|
|
|
|
Other provisions |
25.376,00 |
86.943,00 |
41.959,00 |
|
Reversion fund |
272,00 |
340,00 |
408,00 |
|
D) LONG TERM LIABILITIES |
49.208,00 |
29.500,00 |
29.290,00 |
|
I.Negotiable
bonds and other negotiable values |
|
|
|
|
Non convertible
securities |
|
|
|
|
Convertible
securities |
|
|
|
|
Other
convertible debentures |
|
|
|
|
II.Debt with
bank entities |
|
|
|
|
Long term bank
loans |
|
|
|
|
Leasing |
|
|
|
|
III.Debts with
associated and affiliated companies |
713,00 |
728,00 |
717,00 |
|
With affiliated
companies |
713,00 |
728,00 |
717,00 |
|
Associated
companies |
|
|
|
|
IV. Other creditors |
48.495,00 |
28.772,00 |
28.573,00 |
|
Bills payable |
|
|
|
|
Other debts |
48.474,00 |
28.751,00 |
28.552,00 |
|
Long term
deposit and guaranties |
21,00 |
21,00 |
21,00 |
|
Taxes receivable |
|
|
|
|
V. Deferred debts on shares |
|
|
|
|
From affiliated companies |
|
|
|
|
From associated companies |
|
|
|
|
Other companies |
|
|
|
|
VI. Long term debt with creditor |
|
|
|
|
E) SHORT TERM LIABILITIES |
1.155.897,00 |
1.373.681,00 |
1.543.307,00 |
|
I.Negotiable
bonds and other negotiable values |
|
|
|
|
Non convertible securities |
|
|
|
|
Convertible securities |
|
|
|
|
Other convertible debentures |
|
|
|
|
Interests from bonds |
|
|
|
|
II.Debt with bank entities |
296,00 |
2.675,00 |
13,00 |
|
Loans and other debts |
296,00 |
2.675,00 |
13,00 |
|
Debt interest |
|
|
|
|
Leasing |
|
|
|
|
III. Short term debts with associated and
affiliated companies |
571.878,00 |
767.744,00 |
952.918,00 |
|
With affiliated companies |
571.878,00 |
767.744,00 |
952.918,00 |
|
Associated companies |
|
|
|
|
IV. Commercial creditors |
387.080,00 |
433.909,00 |
454.781,00 |
|
Accounts payable |
|
|
|
|
Expenses |
387.080,00 |
433.909,00 |
454.781,00 |
|
Bills payable |
|
|
|
|
V. Other non-commercial debt |
196.291,00 |
169.037,00 |
135.595,00 |
|
Government |
170.657,00 |
144.317,00 |
92.037,00 |
|
Bills payable |
|
|
|
|
Other debts |
13.926,00 |
14.957,00 |
10.494,00 |
|
Accounts receivable |
11.708,00 |
9.763,00 |
33.064,00 |
|
Short term deposits and guarantees |
|
|
|
|
VI. Provisions for current assets |
|
|
|
|
VII. Periodification adjustments |
352,00 |
316,00 |
|
|
F) SHORT TERM PROVISIONS FOR LIABILITIES AND
EXPENSES |
|
|
|
|
LIABILITIES (A + B + C + D + E + F) |
2.678.150,00 |
3.076.850,00 |
3.387.874,00 |
Liabilities
Composition


PROFIT AND LOSS ACCOUNT
Itams of the Profit and Loss Account
Figures given in thousands €
|
|
31/01/2006 (12) |
31/01/2007 (12) |
31/01/2008 (12) |
|
A) EXPENSES (A.1 a A.16) |
2.301.982,00 |
2.813.888,00 |
3.267.948,00 |
|
A.1.Reduction in stocks of finished goods and
work in progress |
|
|
|
|
A.2.Supplies |
2.038.200,00 |
2.433.389,00 |
2.745.251,00 |
|
Material consumed |
1.706.834,00 |
2.038.797,00 |
2.333.004,00 |
|
Raw materials consumed |
309.371,00 |
374.373,00 |
388.936,00 |
|
Other expenses |
21.995,00 |
20.219,00 |
23.311,00 |
|
A.3. Labour cost |
69.239,00 |
67.101,00 |
91.667,00 |
|
Wages |
60.205,00 |
56.514,00 |
65.131,00 |
|
Social security expenses |
9.034,00 |
10.587,00 |
26.536,00 |
|
A.4. Assets depreciation |
28.417,00 |
29.432,00 |
26.722,00 |
|
A.5.Variance in the traffic provisions |
91,00 |
137,00 |
|
|
Variance in provision for inventory |
|
|
|
|
Variance in provision for bad debts |
91,00 |
137,00 |
|
|
Variance in provision for other current assets |
|
|
|
|
A.6. Other operating costs |
190.343,00 |
218.255,00 |
287.601,00 |
|
External costs |
187.593,00 |
214.174,00 |
283.646,00 |
|
Taxes |
1.109,00 |
1.747,00 |
1.235,00 |
|
Other day to day expenses |
1.573,00 |
2.266,00 |
2.652,00 |
|
Allowance to reversion fund |
68,00 |
68,00 |
68,00 |
|
A.I.OPERATING
RESULT (B.1+B.2+B.3+B.4-A.1-A.2-A.3-A.4-A.5-A.6) |
97.024,00 |
211.467,00 |
272.273,00 |
|
A.7.Financial expenses and similar |
6.380,00 |
11.497,00 |
22.353,00 |
|
Debts with related companies |
5.896,00 |
11.050,00 |
22.215,00 |
|
Debts with associated companies |
|
|
|
|
Other companies debts By debts with third parties and similar expenses |
484,00 |
447,00 |
138,00 |
|
Losses from financial investments |
|
|
|
|
A.8. Variation in financial investment provision |
|
|
|
|
A.9.Negative exchange difference |
7.267,00 |
12.434,00 |
17.166,00 |
|
A.II.POSITIVE
FINANCIAL RESULTS (B.5+B.6+B.7+B.8-A.7-A.8-A.9) |
385.013,00 |
388.257,00 |
476.868,00 |
|
A.III.PROFIT
FROM ORDINARY ACTIVITIES (A.I+A.II-B.I-B.II) |
482.037,00 |
599.724,00 |
749.141,00 |
|
A.10. Variation
in provision in fixed assets |
-30.967,00 |
22.962,00 |
50.155,00 |
|
A.11. Losses in
fixed assets |
4.152,00 |
|
693,00 |
|
A.12. Losses
from own shares and bonds |
|
|
|
|
A.13.
Extraordinary charges |
1.025,00 |
757,00 |
10,00 |
|
A.14.Other
exercises’ expenses and losses |
222,00 |
303,00 |
7.319,00 |
|
A.IV.POSITIVE
EXTRAORDINARY RESULT (B.9+B.10+B.11+B.12+B.13-A.10-A.11-A.12-A.13-A.14) |
26.245,00 |
|
|
|
A.V.PROFIT
BEFORE TAXES (A.III+A.IV-B.III-B.IV) |
508.282,00 |
575.903,00 |
718.710,00 |
|
A.15.Corporate
Taxes |
-12.387,00 |
17.621,00 |
19.011,00 |
|
A.16. Other
taxes |
|
|
|
|
A.VI.EXERCISE
RESULT (PROFIT) (A.V-A.14-A.15) |
520.669,00 |
558.282,00 |
699.699,00 |
|
B) INCOMES (B.1 a B13) |
2.822.651,00 |
3.372.170,00 |
3.967.647,00 |
|
B.1. Turnover |
2.332.152,00 |
2.860.367,00 |
3.299.641,00 |
|
Sales |
2.401.573,00 |
2.951.894,00 |
3.393.280,00 |
|
Services provided |
19.668,00 |
20.316,00 |
23.428,00 |
|
Refunds and sale reminders |
-89.089,00 |
-111.843,00 |
-117.067,00 |
|
B.2.Increase in inventory of finished goods and
works in progress |
|
|
|
|
B.3.Expenses capitalized |
|
|
|
|
B.4. Other operating income |
91.162,00 |
99.414,00 |
123.873,00 |
|
Other incomes |
90.814,00 |
99.037,00 |
123.292,00 |
|
Grants |
348,00 |
377,00 |
529,00 |
|
Excess in provision for liabilities and charges |
|
|
52,00 |
|
B.I.OPERATING
LOSSES (A.1+A.2+A.3+A.4+A.5+A.6-B.1-B.2-B.3-B.4) |
|
|
|
|
B.5.Incomes from share participations |
378.234,00 |
380.261,00 |
474.908,00 |
|
From affiliated companies |
378.088,00 |
380.114,00 |
474.743,00 |
|
From associated companies |
|
|
|
|
From other companies |
146,00 |
147,00 |
165,00 |
|
B.6.Income from other securities and credits to
fixed assets |
|
|
|
|
From affiliated companies |
|
|
|
|
From associated companies |
|
|
|
|
Other companies |
|
|
|
|
B.7.Other interests and similar |
12.915,00 |
18.926,00 |
23.625,00 |
|
From affiliated companies |
5.217,00 |
8.909,00 |
18.621,00 |
|
From associated companies |
|
|
|
|
Other Interests |
7.698,00 |
10.017,00 |
5.004,00 |
|
Profits from investments |
|
|
|
|
B.8. Positive change difference |
7.511,00 |
13.001,00 |
17.854,00 |
|
B.II. NEGATIVE FINANCIAL RESULTS
(A.7+A.8+A.9-B.5-B.6-B.7-B.8) |
|
|
|
|
B.III.LOSSES FROM ORDINARY ACTIVITIES
(B.I+B.II-A.I-A.II) |
|
|
|
|
B.9.B.9. Gains from disposal of fixed assets |
28,00 |
|
27.563,00 |
|
B.10.Gains from dealing in own shares |
|
|
|
|
B.11. Paid in surplus |
|
|
|
|
B.12. Extraordinary income |
649,00 |
41,00 |
183,00 |
|
B.13.Other year’s income and profits |
|
160,00 |
|
|
B.IV.NEGATIVE
EXTRAORDINARY LOSSES (A.10+A.11+A.12+A.13+A.14-B.9-B.10-B.11-B.12-B.13) |
|
23.821,00 |
30.431,00 |
|
B.V.LOSS BEFORE
TAXES (B.III+B.IV-A.III-A.IV) |
|
|
|
|
B.VI.EXERCISE
RESULTS (LOSS) (B.V+A.14+A.15) |
|
|
|
Composition of the
Profit and Loss Account


FINANCIAL BALANCE
Here the Main Capital Amounts of the company and the Revolving Fund
Evolution are analysed.
Financial Balance Table
Figures given in thousands €
|
|
31/01/2006 (12) |
% |
31/01/2007 (12) |
% |
31/01/2008 (12) |
% |
|
A) DUE FROM
SHAREHOLDERS FOR UNCALLED CAPITAL |
|
|
|
|
|
|
|
B) FIXED ASSETS |
1.289.940,00 |
48,17 |
1.776.111,00 |
57,72 |
1.856.365,00 |
54,79 |
|
C) DEFERRED EXPENSES |
567,00 |
0,02 |
|
|
|
|
|
D) CURRENT ASSETS |
1.387.643,00 |
51,81 |
1.300.739,00 |
42,28 |
1.531.509,00 |
45,21 |
|
ASSETS (A + B +
C + D) |
2.678.150,00 |
|
3.076.850,00 |
|
3.387.874,00 |
|
|
|
||||||
|
A) SHAREHOLDERS
EQUITY |
1.433.685,00 |
53,53 |
1.574.336,00 |
51,17 |
1.750.394,00 |
51,67 |
|
B) DEFERRED
INCOME |
13.660,00 |
0,51 |
11.998,00 |
0,39 |
22.516,00 |
0,66 |
|
C) PROVISIONS
FOR LIABILITIES AND EXPENSES |
25.700,00 |
0,96 |
87.335,00 |
2,84 |
42.367,00 |
1,25 |
|
D) LONG TERM
LIABILITIES |
49.208,00 |
1,84 |
29.500,00 |
0,96 |
29.290,00 |
0,86 |
|
E) SHORT TERM
LIABILITIES |
1.155.897,00 |
43,16 |
1.373.681,00 |
44,65 |
1.543.307,00 |
45,55 |
|
F) SHORT TERM
PROVISIONS FOR LIABILITIES AND EXPENSES |
|
|
|
|
|
|
|
LIABILITIES (A +
B + C + D + E + F) |
2.678.150,00 |
|
3.076.850,00 |
|
3.387.874,00 |
|
Financial Balance
Composition


Comments on Financial Balance
In the 2006, the assets of the company were formed in 48,19% of Fixed
Assets and in 51,81% of Current Assets.This assets were financed in 54,04% with
own capitals, and in 2,80% with long term debt and in 43,16% with current
liabilities.
The result of this financial structure is a positive turnover fund of
231.746,00 Euros, which is equivalent to 8,65% proportion of the
company’s total assets.
In the 2007, the assets of the company were formed in 57,72% of Fixed
Assets and in 42,28% of Current Assets.This assets were financed in 51,56% with
own capitals, and in 3,80% with long term debt and in 44,65% with current
liabilities.
The result of this financial structure is a negative turnover fund of
-72.942,00 thousands Euros, which is equivalent to -2,37% proportion of
the company’s total assets.
This measure has diminished with respect to the previous exercise in
131,47% having also diminished its proportion with respect to the total assets
of the company.
In the 2008, the assets of the company were formed in 54,79% of Fixed
Assets and in 45,21% of Current Assets.This assets were financed in 52,33% with
own capitals, and in 2,12% with long term debt and in 45,55% with current
liabilities.
The result of this financial structure is a negative turnover fund of
-11.798,00 thousands Euros, which is equivalent to -0,35% proportion of
the company’s total assets.
This measure has increased with respect to the previous exercise in
83,83% having also increased its proportion with respect to the total assets of
the company.
RATIOS
Main Ratios
|
|
31/01/2006 (12) |
31/01/2007 (12) |
31/01/2008 (12) |
|
STRUCTURAL RATIOS |
|
|
|
|
Management fund |
231.746,00 |
-72.942,00 |
-11.798,00 |
|
Management Fund Requirement |
-572.314,00 |
-691.198,00 |
-801.356,00 |
|
Indebtedness (%) |
45,96 |
48,44 |
47,67 |
|
External Funds on Net Worth |
0,85 |
0,94 |
0,91 |
|
GENERAL ACTIVITY RATIO |
|
|
|
|
Turnover Increase (%) |
16,20 |
22,65 |
15,36 |
|
Added value growth (%) |
4,23 |
58,20 |
26,78 |
|
Cash Flow |
518.210,00 |
610.813,00 |
776.576,00 |
|
Labour Productivity |
2,81 |
4,59 |
4,26 |
|
Assets turnover |
0,87 |
0,93 |
0,97 |
|
Breakdown Point |
1.812.794,47 |
1.770.750,75 |
2.049.223,46 |
|
Security Margin of the Breakdown Point (%) |
25,19 |
40,17 |
40,14 |
|
ACTIVITY RATIOS |
|
|
|
|
Average Payment Period |
68 |
64 |
60 |
|
Average Collection Period |
58 |
52 |
44 |
|
Inventory Turnover Period |
32 |
33 |
36 |
|
SOLVENCY RATIOS |
|
|
|
|
Payback Capacity |
0,42 |
0,41 |
0,48 |
|
Assets Guarantee |
2,18 |
2,06 |
2,10 |
|
Short Term Debts Proportion (%) |
93,91 |
92,16 |
95,56 |
|
Interest Coverage |
23,49 |
15,26 |
8,16 |
|
LIQUIDITY RATIOS |
|
|
|
|
Current Ratio |
1,20 |
0,95 |
0,99 |
|
Immediate liquidity |
0,70 |
0,45 |
0,51 |
|
Treasury |
804.060,00 |
618.256,00 |
789.558,00 |
|
Sales on Current Assets |
605 |
792 |
776 |
Results Analysis
Ratios
|
|
31/01/2006 (12) |
31/01/2007 (12) |
31/01/2008 (12) |
|
Economic profitability (%) |
3,62 |
6,87 |
8,04 |
|
Operating Profitability (%) |
4,16 |
7,39 |
8,25 |
|
Equity gearing |
9,19 |
5,50 |
5,26 |
|
Financial profitability (%) |
35,97 |
35,19 |
39,47 |
|
General Profitability (%) |
22,33 |
19,52 |
21,20 |
Comments on the
Results Analysis Ratios
The economic profitability in the year2007 achieved a 6,87% positive
level, due to a 7,39% economic margin and to an assets turnover of0,93%.
The economic profitability in the year has increased from 3,62% up to
6,87%. This growth is due to the economic margin increase, from 4,16% to the
current 7,39Y%, and to the assets turnover index, which in the last period has
achieved 0,93, compared to 0,87 del 2006.
Financial profitability on 2007 achieved a 35,19%.
The company’s financial structure has instigated its economic
profitability with an indebtedness level of 5,50.
The general profitability on 2007 achieved a 19,52%.
The economic profitability in the year2008 achieved a 8,04% positive
level, due to a 8,25% economic margin and to an assets turnover of0,97%.
The economic profitability in the year has increased from 6,87% up to
8,04%. This growth is due to the economic margin increase, from 7,39% to the
current 8,25Y%, and to the assets turnover index, which in the last period has
achieved 0,97, compared to 0,93 del 2007.
Financial profitability on 2008 achieved a 39,47%.
The company’s financial structure has instigated its economic
profitability with an indebtedness level of 5,26.
The general profitability on 2008 achieved a 21,20%.
SECTORIAL ANÁLYSIS
Large Capital Amounts and Financial Balance
Figures given in %
|
|
COMPANY (2008) |
SECTOR |
DIFFERENCE |
DIFFERENCE RELATIVE |
|
|
|
|
|
|
ASSETS |
|
|
|
|
|
|
|
|
|
|
A) DUE FROM
SHAREHOLDERS FOR UNCALLED CAPITAL |
|
0,37 |
|
|
|
|
|
|
|
|
B) FIXED ASSETS |
54,79 |
24,38 |
30,41 |
124,70 |
|
|
|
|
|
|
C) DEFERRED
EXPENSES |
|
1,13 |
|
|
|
|
|
|
|
|
D) CURRENT
ASSETS |
45,21 |
74,11 |
-28,90 |
-39,00 |
|
|
|
|
|
|
ASSETS (A + B +
C + D) |
100 |
100 |
|
|
|
|
|
|
|
|
|
|
|
|
|
|
|
|
|
|
|
|
COMPANY (2008) |
SECTOR |
DIFFERENCE |
DIFFERENCE RELATIVE |
|
|
|
|
|
|
LIABILITIES |
|
|
|
|
|
|
|
|
|
|
A) SHAREHOLDERS
EQUITY |
51,67 |
36,34 |
15,33 |
42,18 |
|
|
|
|
|
|
B) DEFERRED
INCOME |
0,66 |
0,20 |
0,46 |
223,53 |
|
|
|
|
|
|
C) PROVISIONS
FOR LIABILITIES AND EXPENSES |
1,25 |
1,66 |
-0,41 |
-24,74 |
|
|
|
|
|
|
D) LONG TERM
LIABILITIES |
0,86 |
9,09 |
-8,23 |
-90,54 |
|
|
|
|
|
|
E) SHORT TERM
LIABILITIES |
45,55 |
52,68 |
-7,13 |
-13,53 |
|
|
|
|
|
|
F) SHORT TERM
PROVISIONS FOR LIABILITIES AND EXPENSES |
|
0,03 |
|
|
|
|
|
|
|
|
LIABILITIES (A +
B + C + D + E + F) |
100 |
100 |
|
|
|
|
|
|
|
Sectorial Financial
Balance Comparison


Comments to the Sectorial Analysis
In the 2008, the assets of the company were formed in 54,79% of fixed
assets and in 45,21Current Assets % In the sector, the proportion of fixed
assets was of 25,89%, 111,66% inferior, and the proportion of current assets
was of 74,11%, 39,00% superior.
The assets were financed in the company in 52,33% with own capitals , in
2,12% with fixed liabilities and in 45,55% with current liabilities In the
sector, the self financing represented 36,54%, 43,19% inferior. On the other
hand the long term debts represented in the sector an average of 10,75%
financing, with a relative difference of 80,28% favourable to the sectorAnd,
short term liabilities represented in the sector an average of 52,71%
financing, with a relative difference of 13,58% favourable to the sector
The result of this company’s financial structure is a turnover fund that
represents -0,35% of the total assets; in the sector, this same proportion is
21,41%, therefore, we can say that the company’s turnover fund is 101,64%
smaller than the sector one.
Analytical Account of Results
Figures given in %
|
|
COMPANY (2008) |
SECTOR |
DIFFERENCE |
DIFFERENCE RELATIVE |
|
Turnover |
96,38 |
97,56 |
-1,18 |
-1,20 |
|
Other operating income |
3,62 |
2,44 |
1,18 |
48,06 |
|
Production Value |
100,00 |
100,00 |
0,00 |
0,00 |
|
Operating expenses |
80,19 |
73,66 |
6,53 |
8,87 |
|
Other operation expenses |
8,40 |
13,17 |
-4,77 |
-36,23 |
|
Added value |
11,41 |
13,17 |
-1,76 |
-13,38 |
|
Labour cost |
2,68 |
7,00 |
-4,32 |
-61,71 |
|
Gross Economic Result |
8,73 |
6,17 |
2,56 |
41,42 |
|
Assets depreciation |
0,78 |
1,02 |
-0,24 |
-23,60 |
|
Variation in provision for current assets and bad debt losses |
|
0,29 |
|
|
|
Net Economic Result |
7,95 |
4,86 |
3,09 |
63,45 |
|
Financial income |
15,08 |
1,76 |
13,32 |
757,31 |
|
Financial Charges |
1,15 |
0,91 |
0,24 |
26,10 |
|
Variation in financial investment provision |
|
0,01 |
|
|
|
Ordinary
Activities Result |
21,88 |
5,70 |
16,17 |
283,52 |
|
Extraordinary income |
0,81 |
0,42 |
0,39 |
91,94 |
|
Extraordinary charges |
0,23 |
0,22 |
0,02 |
6,98 |
|
Variation in provision in fixed assets |
1,47 |
0,15 |
1,32 |
880,00 |
|
Results before Taxes |
20,99 |
5,76 |
15,23 |
264,35 |
|
Corporate taxes |
0,56 |
1,34 |
-0,78 |
-58,36 |
|
Net Result |
20,44 |
4,42 |
16,02 |
362,76 |
|
Assets depreciation |
0,78 |
1,02 |
-0,24 |
-23,60 |
|
Change of Provisions |
1,47 |
0,45 |
1,02 |
229,60 |
|
Net Self-Financing |
22,68 |
5,88 |
16,80 |
285,52 |
Main Ratios
|
|
COMPANY (2008) |
PTILE25 |
PTILE50 |
PTILE75 |
|
STRUCTURAL RATIOS |
|
|
|
|
|
Management fund |
-11.798,00 |
1.893,87 |
6.539,56 |
16.462,04 |
|
Management Fund
Requirement |
-801.356,00 |
-6.472,01 |
222,03 |
7.497,13 |
|
Indebtedness (%) |
47,67 |
53,44 |
68,81 |
78,95 |
|
External Funds
on Net Worth |
0,91 |
1,15 |
2,21 |
3,75 |
|
GENERAL ACTIVITY
RATIO |
|
|
|
|
|
Turnover Increase (%) |
15,36 |
-1,28 |
4,86 |
11,96 |
|
Added value growth (%) |
26,78 |
-7,39 |
5,13 |
18,29 |
|
Cash Flow |
776.576,00 |
901,45 |
2.848,08 |
8.164,62 |
|
Labour Productivity |
4,26 |
1,28 |
1,63 |
2,05 |
|
Assets turnover |
0,97 |
1,38 |
1,93 |
3,05 |
|
Breakdown Point |
2.049.223,46 |
44.557.946,31 |
69.549.962,25 |
131.007.076,84 |
|
Security Margin of
the Breakdown Point (%) |
40,14 |
6,91 |
13,90 |
24,96 |
|
ACTIVITY RATIOS |
|
|
|
|
|
Average Payment
Period |
60 |
21 |
45 |
90 |
|
Average
Collection Period |
44 |
50 |
84 |
121 |
|
Inventory
Turnover Period |
36 |
19 |
34 |
53 |
|
SOLVENCY RATIOS |
|
|
|
|
|
Payback Capacity |
0,48 |
0,04 |
0,10 |
0,23 |
|
Assets Guarantee |
2,10 |
1,25 |
1,45 |
1,87 |
|
Short Term Debts Proportion (%) |
95,56 |
89,41 |
97,41 |
99,91 |
|
Interest Coverage |
8,16 |
0,94 |
4,51 |
17,33 |
|
LIQUIDITY RATIOS |
|
|
|
|
|
Current Ratio |
0,99 |
1,10 |
1,33 |
1,71 |
|
Immediate liquidity |
0,51 |
0,02 |
0,09 |
0,29 |
|
Treasury |
789.558,00 |
-3.514,44 |
630,00 |
5.968,19 |
|
Sales on Current Assets |
776 |
625 |
941 |
1.411 |
Results Analysis
Ratios
|
|
COMPANY (2008) |
PTILE25 |
PTILE50 |
PTILE75 |
|
Economic profitability (%) |
8,04 |
1,77 |
5,59 |
11,65 |
|
Operating Profitability (%) |
8,25 |
0,83 |
3,00 |
7,41 |
|
Equity gearing |
5,26 |
1,80 |
2,67 |
4,83 |
|
Financial profitability (%) |
39,47 |
5,74 |
13,49 |
27,81 |
|
General Profitability (%) |
21,20 |
0,54 |
1,86 |
5,02 |
FOREIGN EXCHANGE
RATES
|
Currency |
Unit
|
Indian Rupees |
|
US Dollar |
1 |
Rs.49.69 |
|
UK Pound |
1 |
Rs.72.96 |
|
Euro |
1 |
Rs.63.46 |
RATING
EXPLANATIONS
|
RATING |
STATUS |
PROPOSED CREDIT LINE |
|
|
>86 |
Aaa |
Possesses an extremely sound financial base with the strongest
capability for timely payment of interest and principal sums |
Unlimited |
|
71-85 |
Aa |
Possesses adequate working capital. No caution needed for credit
transaction. It has above average (strong) capability for payment of interest
and principal sums |
Large |
|
56-70 |
A |
Financial & operational base are regarded healthy. General unfavourable
factors will not cause fatal effect. Satisfactory capability for payment of
interest and principal sums |
Fairly Large |
|
41-55 |
Ba |
Overall operation is considered normal. Capable to meet normal
commitments. |
Satisfactory |
|
26-40 |
B |
Unfavourable & favourable factors carry similar weight in credit
consideration. Capability to overcome financial difficulties seems
comparatively below average. |
Small |
|
11-25 |
Ca |
Adverse factors are apparent. Repayment of interest and principal sums
in default or expected to be in default upon maturity |
Limited with
full security |
|
<10 |
C |
Absolute credit risk exists. Caution needed to be exercised |
Credit not
recommended |
|
NR |
In view of the lack of information, we have no basis upon which to
recommend credit dealings |
No Rating |
|
This score serves as a reference to assess SC’s credit risk
and to set the amount of credit to be extended. It is calculated from a composite
of weighted scores obtained from each of the major sections of this report. The
assessed factors and their relative weights (as indicated through %) are as
follows:
Financial
condition (40%) Ownership
background (20%) Payment
record (10%)
Credit history
(10%) Market trend
(10%) Operational
size (10%)