![]()
MIRA
INFORM REPORT
|
Report Date : |
10.12.2008 |
IDENTIFICATION
DETAILS
|
Name : |
PUNTO-FA SL |
|
|
|
|
Registered Office : |
Street Dels
Mercaders, 9 - 11 Pg Ind Riera Caldes, Cp 08184, Palau-Solita
I Plegamans Barcelona |
|
|
|
|
Country : |
Spain |
|
|
|
|
Financials (as on) : |
30.12.2006 |
|
|
|
|
Date of Incorporation : |
|
|
|
|
|
Legal Form : |
Limited Liability Company |
|
|
|
|
Line of Business : |
RATING &
COMMENTS
|
MIRA’s Rating : |
A |
|
RATING |
STATUS |
PROPOSED CREDIT LINE |
|
|
56-70 |
A |
Financial & operational base are regarded healthy. General
unfavourable factors will not cause fatal effect. Satisfactory capability for
payment of interest and principal sums |
Fairly Large |
|
Maximum Credit Limit : |
6.000.000,00 € |
|
|
|
|
Status : |
Good |
|
|
|
|
Payment Behaviour : |
Regular |
|
|
|
|
Litigation : |
Exists |
FINANCIAL REPORT
PUNTO-FA SL
TAX NUMBER: B59088948
EXECUTIVE SUMMARY
Identification
Current Business Name: PUNTO-FA SL
Commercial Name: MANGO
Other names: NO
Current Address: STREET DELS
MERCADERS, 9 - 11 PG IND RIERA CALDES, CP 08184, PALAU-SOLITA I
PLEGAMANS BARCELONA
Branches: 4
Telephone number: 938602222 Fax: 938602200
URL: www.mango.es Corporate
e-mail: atencioncliente@mango.es
Commercial Risk
Credit Appraisal:
6.000.000,00 €
RAI: NO
Legal Actions: YES
Financial Information
Latest Balance sheet sales (2006): 750.680.000,00 € (MERCANTILE REGISTER)
Result: 87.422.000 €
Total Assets:
1.196.502.000 €
Social Capital: 12.565,00 €
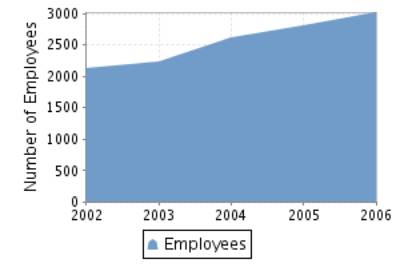
Employees: 3.024
Commercial Information
Constitution Date: 13/12/1989
Business activity: Textile
confection: mass production
NACE Code: 1820
International Operations: Imports and
Exports
Corporate Structure
President:
Participations: 58
Other Complementary Information
Latest proceeding published in BORME: 13/12/2007 Resignations
Latest press article: 27/11/2008 ELECONOMISTA (FINANCIAL
INFORMATION)
Bank Entities: Yes
COMMERCIAL RISK
Credit Appraisal
Maximum Credit
(from 0 a 6,000,000 €)
Favourable to 6.000.000,00 €
Rating Evolution
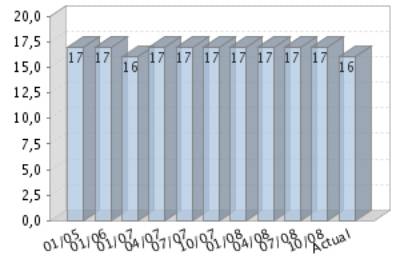
Financial Situation
Fiscal year2006
|
Treasury |
Excellent |
|
Indebtedness |
Average |
|
Profitability |
Good |
|
Balance |
Very good |
Performance
|
Legal Actions |
None or Negligible |
|
Business
Trajectory |
Excellent |
COMPANY NOT REGISTERED IN THE R.A.I.
This company is not registered in the Disputed Bills register (R.A.I.)
INCIDENTS

Summary
LEGAL ACTIONS: No legal incidences registered
|
CLAIM FILED
AGAINST THE ADMINISTRATION: 2 ( First: 26/06/2003, last:
22/09/2008 )With the Social Security: |
1 |
|
With the Tax
Authorities: |
0 |
|
With Other
Official bodies: |
1 |
AFFECTED BY: No significant element.
Last claim filed against the administration
Figures expressed in €
WITH THE SOCIAL SECURITY
1 claim(s)
Notifications
|
DATE |
ORGANIZATION |
AMOUNT |
|
26/06/2003 |
CENTRAL TREASURY
FOR SOCIAL SECURITY DIRECCION PROVINCIAL DE TRABAJO Y SEGURIDAD SOCIAL |
1.156,46 |
WITH OTHER OFFICIAL BODIES
1 claim(s)
Notifications
|
DATE |
ORGANIZATION |
AMOUNT |
|
22/09/2008 |
TOWN/ CITY HALL DE EIVISSA |
450,76 |
FINANCIAL ELEMENTS AND
SECTORIAL COMPARATIVE
FINANCIAL ELEMENTS
Figures given in thousands €
|
|
2004 (12) |
2005 (12) |
2006 (12) |
% ASSETS |
|
|
|
|
|
|
BALANCE SHEET
ANALYSIS |
|
|
|
|
|
|
|
|
|
|
OWN FUNDS |
432.003,00 |
497.503,00 |
420.755,00 |
35,17 |
|
|
|
|
|
|
DEBT |
452.102,00 |
585.087,00 |
775.747,00 |
64,83 |
|
|
|
|
|
|
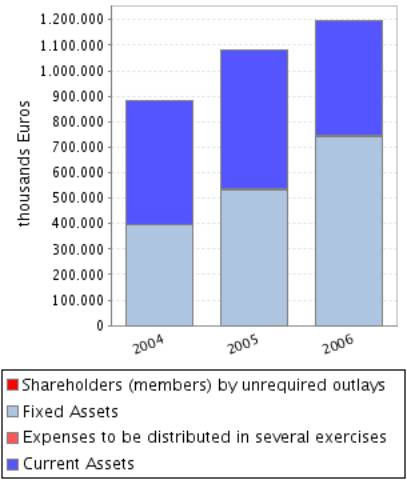
FIXED ASSETS |
395.353,00 |
533.431,00 |
742.815,00 |
62,08 |
|
|
|
|
|
|
TOTAL ASSETS |
884.105,00 |
1.082.590,00 |
1.196.502,00 |
|
|
|
|
|
|
|
|
|
|
|
|
|
|
|
|
|
|
|
2004 (12) |
2005 (12) |
2006 (12) |
% SALES |
|
|
|
|
|
|
PROFIT AND LOSS
ACCOUNT ANALYSIS |
|
|
|
|
|
|
|
|
|
|
SALES |
663.310,00 |
675.758,00 |
750.680,00 |
|
|
|
|
|
|
|
ADDED VALUE |
224.537,00 |
208.068,00 |
255.474,00 |
34,03 |
|
|
|
|
|
|
EBITDA |
155.470,00 |
130.893,00 |
167.492,00 |
22,31 |
|
|
|
|
|
|
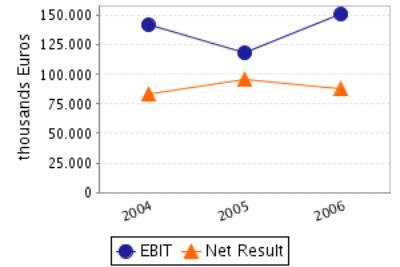
EBIT |
142.087,00 |
118.205,00 |
151.210,00 |
20,14 |
|
|
|
|
|
|
NET RESULT |
83.377,00 |
95.730,00 |
87.422,00 |
11,65 |
|
|
|
|
|
Balance Sheets Items
Analysis
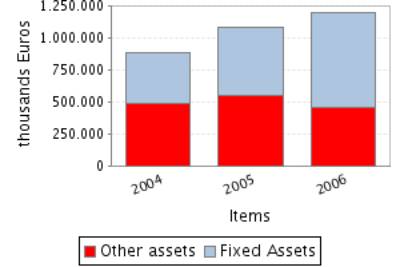
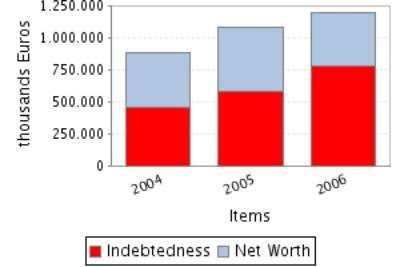
Balance Sheet Comments
Total assets of the company grew 22,45% between 2004 and 2005.
This growth is a consequence of the fixed assets increase of 34,93%.
This growth has been mainly financed with a debt increase of 29,41%.
Nevertheless the net worth increased 15,16%.
Total assets of the company grew 10,52% between 2005 and 2006.
This growth is a consequence of the fixed assets increase of 39,25%.
This growth has been financed with an indebtedness increase of
32,59%.Moreover, net worth has been reduced in 15,43%, which explains a part of
the indebtedness increase. .
Profit and Loss Account Analysis
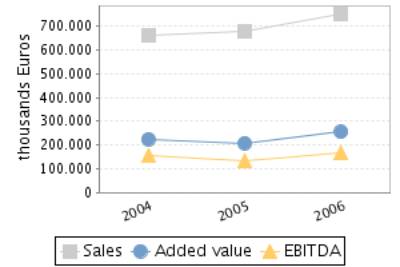
Profit and Loss Account Comments
The company’s sales figure grew 1,88% between 2004 and 2005.
The company’s EBIT decreased in 16,81% between 2004 and 2005.
This evolution implies a reduction in the company’s operating
profitability.
The result of these variations is a decrease of the company’s Economic
Profitability of 32,06% in the analysed period, being this profitability of
10,92% in the year 2005.
The company’s Net Result grew 14,82% between 2004 and 2005.
This evolution, compared to the EBIT’s performance, implies that the
financial and extraordinary activities have had a positive effect in the
company’s Financial Profitability.
The result of these variations is a reduction of the company’s
profitability of 0,30% in the analysed period, being equal to 19,24% in the
year 2005.
The company’s sales figure grew 11,09% between 2005 and 2006.
The company’s EBIT grew 27,92% between 2005 and 2006.
This evolution implies an increase in the company’s operating
profitability.
The result of these variations is an increase of the company’s Economic
Profitability of 15,74% in the analysed period, being this profitability of
12,64% in the year 2006.
The company’s Net Result decreased in 8,68% between 2005 and 2006.
This evolution, compared to the EBIT’s performance, implies that the
financial and extraordinary activities have had a negative effect in the
company’s Financial Profitability.
The result of these variations is an increase of the company’s Economic
Profitability of 7,98% in the analysed period, being equal to 20,78% in the
year 2006.
ANNUAL FINANCIAL REPORT ADDITIONAL DATA
Source: annual financial report 2006
Results Distribution
Figures given in €
|
DISTRIBUTION
BASE |
DISTRIBUTION TO |
||
|
Profit and Loss |
87.422.673,35 |
Retained earnings |
0,00 |
|
Carry Over |
0,00 |
Voluntary Reserve |
85.654.673,35 |
|
Voluntary reserves |
0,00 |
Prior years losses |
0,00 |
|
Reserves |
0,00 |
Carry Over |
0,00 |
|
Other concepts |
0,00 |
Other funds |
1.768.000,00 |
|
Total of Amounts to be distributed |
87.422.673,35 |
Dividends |
0,00 |
|
|
|
Other Applications |
0,00 |
Auditing
Auditors’ opinion: FAVOURABLE
Auditor: PRICEWATERHOUSECOOPERS AUDITORES SL
COMPARATIVE SECTOR ANALYSIS
Values table
Figures expressed in %
|
|
COMPANY (2006) |
SECTOR |
DIFFERENCE |
DIFFERENCE RELATIVE |
|
|
|
|
|
|
BALANCE SHEET ANALYSIS:
%
on the total assets |
|
|
|
|
|
|
|
|
|
|
OWN FUNDS |
35,17 |
45,97 |
-10,80 |
-23,50 |
|
|
|
|
|
|
DEBT |
64,83 |
54,03 |
10,80 |
19,99 |
|
|
|
|
|
|
FIXED ASSETS |
62,08 |
26,33 |
35,75 |
135,75 |
|
|
|
|
|
|
|
|
|
|
|
|
|
|
|
|
|
|
COMPANY (2006) |
SECTOR |
DIFFERENCE |
DIFFERENCE RELATIVE |
|
|
|
|
|
|
PROFIT AND LOSS
ACCOUNT ANALYSIS: % on the total operating income |
|
|
|
|
|
|
|
|
|
|
SALES |
91,13 |
98,19 |
-7,05 |
-7,18 |
|
|
|
|
|
|
ADDED VALUE |
31,01 |
25,34 |
5,67 |
22,40 |
|
|
|
|
|
|
EBIT |
18,36 |
8,43 |
9,93 |
117,84 |
|
|
|
|
|
|
NET RESULT |
10,61 |
5,28 |
5,34 |
101,20 |
|
|
|
|
|
Sector Composition
Compared sector (NACE): 182
Number of companies: 19
Size (Sales Figure) : > 40.000.000,00
Euros
Comments on the sectorial comparative
Compared to its sector the assets of the companies show a greater
proportion of fixed assets. Specifically the difference with the sector average
is 35,75% , which means a relative difference of 135,75% .
In liabilities composition the company appeals on a wider scale to self
financing, being the proportion of net worth of 10,80% inferior, which means a
relative difference of 23,50% 10,80% more than the sector, which means a
difference of 19,99% .
The proportion that the sales mean to the company’s total ordinary
income is 91,13%, 7,05% lower than in the sector, which means a relative
difference of 7,18% .
The company’s EBIT was positive and was 18,36% with regard to the total
ordinary income, 9,93% higher than in the sector, which means a relative
difference of 117,84% .
The company’s capacity to generate operating income is higher than the
one of the sector as its ratio EBIT/Sales is higher (ES Company versus ES
Sector).
The company’s net result was positive and equal to 10,61% with regard to
the total ordinary income, 5,34% less than the sector, which means a relative
difference of 101,20% .
The financial and extraordinary results and the tax impact have had a
negative impact on the Net result in the company with a worse behaviour than in
the sector; as a consequence, the company shows a worse Net Result/EBIT ratio
(REBEmpresa vs. REBSector).
ADDRESSES
Current Legal Seat Address:
STREET DELS MERCADERS, 9 - 11 PG IND RIERA CALDES
08184
PALAU-SOLITA I PLEGAMANS BARCELONA
|
STREET |
POSTAL CODE |
TOWN |
PROVINCE |
|
AVENIDA DIAGONAL |
08000 |
BARCELONA |
Barcelona |
|
STREET VIA AUGUSTA 10 |
08006 |
BARCELONA |
Barcelona |
|
AVENIDA FRANCIA CENTRO
COMERCIAL AQUA MULTIESPACIO |
46023 |
VALENCIA |
Valencia |
|
STREET APARTADO
DE CORREOS 280 |
08184 |
PALAU-SOLITA I PLEGAMANS |
Barcelona |
4 branches registered
CORPORATE STRUCTURE
ADMINISTRATIVE LINKS
Main Board members, Directors and Auditor ![]()
|
POSITION |
SURNAMES AND
NAME |
APPOINTMENT DATE |
|
|
PRESIDENT |
ISAK ANDIC ERMAY |
08/08/2007 |
|
|
MANAGING DIRECTOR |
NAHMAN ANDIC ERMAY |
08/08/2007 |
|
|
CHIEF OFFICER |
KAPIT ADMINT SL REPR 143 RRM CASI BRUNSO ENRIC |
08/08/2007 |
|
|
AUDITOR |
APPOINTMENT DATE |
||
|
PRICEWATERHOUSECOOPERS AUDITORES SL |
16/05/2007 |
||
|
AUREN AUDITORS CONSULTORS BARCELONA SA |
16/05/2007 |
||
Functional Managers
|
POSITION |
SURNAMES AND
NAME |
|
General Manager |
CASI ERIC |
|
Financial Manager |
GARCIA LECUMBERRI MARIA JESUS |
|
Human Resources Manager |
GARCIA LECUMBERRI MARIA JESUS |
|
Commercial Manager |
HALFONS ISAC |
|
Marketing Manager |
PUIG DELI |
|
Purchases Manager |
PUIG DELI |
|
Exports Manager |
HALFONS ISAC |
|
IT Manager |
RISSO EDUARDO |
FINANCIAL LINKS
|
|
BUSINESS NAME |
CIF / COUNTRY |
% |
SOURCE |
DATA INF. |
|
|
MANGO MNG S.L. |
B62013529 |
Indet. |
OWN SOURCES |
23/11/2007 |
|
|
BUSINESS NAME |
CIF / COUNTRY |
% |
SOURCE |
DATA INF. |
|
|
MANGO DANMARK ASP |
DENMARK |
100,00 |
TRADE REG. |
30/12/2006 |
|
|
PUNTA NA DEUTSCHLAND |
GERMANY |
100,00 |
TRADE REG. |
30/12/2006 |
|
|
MANGO SUISSE SA |
GERMANY |
100,00 |
TRADE REG. |
30/12/2005 |
|
|
MANGO (OSTERREICH) HANDELS GMBH |
GERMANY |
100,00 |
TRADE REG. |
30/12/2006 |
|
|
MNG HUNGARY KFT |
HUNGRÍA |
100,00 |
TRADE REG. |
30/12/2006 |
|
|
MANGO ITALIA SRL |
ITALY |
100,00 |
TRADE REG. |
30/12/2006 |
CREDIT INFORMATION
Constitution Date: 13/12/1989
Foundation Date: 01/01/1989
Founder / Origin: LA TITULAR ES LA
FUNDADORA INICIAL DEL NEGOCIO
Activity: Textile confection: mass production
NACE Code: 1820
NACE Activity: Manufacture of
other wearing apparel and accessories
Business: COMERCIO, IMPORTACION Y EXPORTACION DE
PRENDAS DE VESTIR Y ARTICULOS DE COMPLEMENTO DE DICHAS PRENDAS.
Number of total employees: 3.024 (2006)
Number of fixed employees: 100,00%
Number of temporary employees: 0,00%
Employees evolution
PURCHASES
Payments (estimated):
Import Percentage: 60%
Imports from: PAISES DEL ESTE, ALEMANIA Y HONG KONG
SALES
Collection (estimated):
Exports to: NIVEL MUNDIAL
National Distribution: 100%
Banks 
|
ENTITY |
BRANCH |
ADDRESS |
TOWN OR CITY |
PROVINCE |
|
BANCO BILBAO
VIZCAYA ARGENTARIA, S.A. |
|
|
BARCELONA |
|
|
BANCO POPULAR
ESPAÑOL, S.A. |
0002 |
PASSEIG DE GRACIA, 17 |
BARCELONA |
Barcelona |
|
BANCO DE SABADELL, S.A. |
|
|
|
|
|
BANCO SANTANDER, S.A. |
|
|
|
|
4 bank entities registered
LEGAL STRUCTURE
Constitution Data
Register Date: 13/12/1989
Current Legal Form: LIMITED LIABILITY
COMPANY
Current Capital: 12.565,00 €
Legal Aspects
Obligation to fill in Financial
Statements: YES
Chamber census: YES (2006)
Listed on a Stock Exchange: NO
B.O.R.M.E.(Official Companies Registry Gazette) ![]()
Registered Proceedings
|
PROCEEDINGS |
DATE |
NOTICE NUM. |
TRADE REG. |
|
Resignations |
13/12/2007 |
620782 |
Barcelona |
|
Appointments |
13/12/2007 |
620780 |
Barcelona |
|
Appointments |
13/12/2007 |
620778 |
Barcelona |
|
Resignations |
08/08/2007 |
414927 |
Barcelona |
Other Proceedings published
|
PROCEEDINGS |
DATE |
NOTICE NUM. |
TRADE REG. |
|
Registration of accounts (2006) Individual |
27/09/2007 |
650265 |
Barcelona |
27/11/2008 ELECONOMISTA (FINANCIAL INFORMATION)
EL GRUPO TEXTIL ESPAÑOL MANGO REGISTRO EL PASADO AÑO UN BENEFICIO NETO
DE 129 MM. DE EUROS, LO QUE SUPONE UN AUMENTO DEL 4% RESPECTO AL AÑO ANTERIOR.
LA FACTURACION, POR SU PARTE, SE INCREMENTO UN 11,5%, HASTA LOS 1.104 MM. DE
EUROS, SEGUN LAS CUENTAS CONSOLIDADAS DEL GRUPO. LAS CIFRAS NO INCLUYEN LOS
DATOS DE LAS EMPRESAS FRANQUICIADAS. LA INTENCION DE LA TEXTIL CATALANA ES
DUPLICAR SU ACTUAL FACTURACION EN EL PLAZO DE TRES AÑOS Y QUE EL MERCADO
INTERNACIONAL REPRESENTE EL 90% DE SUS INGRESOS. LA INVERSION PREVISTA PARA EL
PRESENTE AÑO SERA DE 164 MM., DE LOS QUE 139 MM. SE DESTINARAN A NUEVAS
APERTURAS Y REFORMAS, Y 25 A SISTEMAS LOGISTICOS Y DE INFORMACION.
08/10/2008 EXPANSIÓN (BRANCHES INFORMATION)
MANGO INAUGURO EL 07/10/08 EN BARCELONA SU PRIMERA TIENDA HE BY MANGO,
DEDICADA EXCLUSIVAMENTE AL PUBLICO MASCULINO. EL LOCAL CUENTA CON 500 MTS.
CUADRADOS Y SE ENCUENTRA EN LA AVENIDA DIAGONAL.
FINANCIAL INFORMATION
The information on the last account contained in this report is
extracted from the Mercantile Register file of the legal address of the Company
and dated 05/10/2007.
BALANCE SHEET
Assets
Figures given in thousands €
|
|
31/12/2004 (12) |
31/12/2005 (12) |
30/12/2006 (12) |
|
A) DUE FROM SHAREHOLDERS FOR UNCALLED CAPITAL |
|
|
|
|
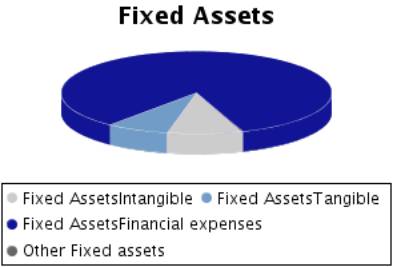
B) FIXED ASSETS |
395.353,00 |
533.431,00 |
742.815,00 |
|
I. Incorporation costs |
|
|
|
|
II. Intangible fixed assets |
29.246,00 |
61.655,00 |
67.305,00 |
|
R & D expenses |
|
|
|
|
Concessions,
patents, licences , trademarks |
5,00 |
|
|
|
Goodwill |
|
|
|
|
Acquired rights from finance leases |
8.594,00 |
9.014,00 |
9.614,00 |
|
Software |
1.298,00 |
1.901,00 |
3.109,00 |
|
Leasing |
42.466,00 |
68.735,00 |
72.029,00 |
|
Cash advance |
|
|
|
|
Provisions |
|
|
|
|
Depreciation |
-23.117,00 |
-17.995,00 |
-17.447,00 |
|
III. Tangible fixed assets |
29.473,00 |
40.612,00 |
55.506,00 |
|
Property, plant and equipment |
6.130,00 |
6.284,00 |
6.284,00 |
|
Machinery, equipment and other |
6.231,00 |
7.006,00 |
8.645,00 |
|
Other property plant and equipment |
46.888,00 |
57.763,00 |
67.279,00 |
|
Prepaid expenses on fixed assets |
3.160,00 |
8.697,00 |
21.511,00 |
|
Other assets |
16.493,00 |
22.484,00 |
25.555,00 |
|
Provisions |
|
|
|
|
Depreciation |
-49.429,00 |
-61.622,00 |
-73.768,00 |
|
IV. Financial fixed assets |
336.634,00 |
431.164,00 |
620.004,00 |
|
Shares in affiliated companies |
514.897,00 |
597.118,00 |
770.694,00 |
|
Receivables in affiliated companies |
|
10.931,00 |
23.596,00 |
|
Shares in associated companies |
|
|
|
|
Loans to associated companies |
|
|
|
|
Securities |
|
|
|
|
Other loans |
|
138,00 |
10.462,00 |
|
Long term deposits and guarantees |
2.149,00 |
2.309,00 |
2.609,00 |
|
Provisions |
-180.412,00 |
-179.332,00 |
-187.357,00 |
|
Taxes receivable |
|
|
|
|
V.Owners equity |
|
|
|
|
VI.Long term trade liabilities |
|
|
|
|
C) DEFERRED EXPENSES |
602,00 |
4.911,00 |
5.331,00 |
|
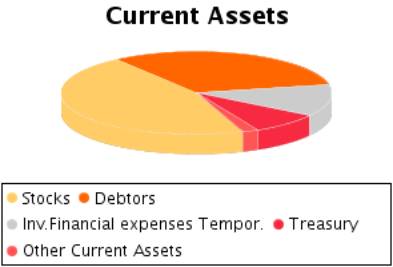
D) CURRENT ASSETS |
488.150,00 |
544.248,00 |
448.356,00 |
|
I. Shareholders by required outlays |
|
|
|
|
II. Stocks |
188.680,00 |
162.862,00 |
204.326,00 |
|
Goods available for sale |
164.816,00 |
142.651,00 |
185.456,00 |
|
Raw material inventory |
11.845,00 |
12.819,00 |
11.086,00 |
|
Work in Progress |
10.468,00 |
7.340,00 |
7.776,00 |
|
Finished goods |
1.551,00 |
52,00 |
8,00 |
|
Subproducts and recycled materials |
|
|
|
|
Cash advance |
|
|
|
|
Provisions |
|
|
|
|
III. Debtors |
111.915,00 |
117.129,00 |
141.830,00 |
|
Clients |
93.812,00 |
100.266,00 |
118.726,00 |
|
Amounts owned by affiliated companies |
14.466,00 |
14.035,00 |
17.037,00 |
|
Amounts owned by associated companies |
|
|
|
|
Other debts |
514,00 |
95,00 |
3.301,00 |
|
Staff Expenses |
404,00 |
|
87,00 |
|
Government |
3.096,00 |
3.110,00 |
3.056,00 |
|
Provisions |
-377,00 |
-377,00 |
-377,00 |
|
IV. Temporary financial investment |
139.942,00 |
232.670,00 |
56.748,00 |
|
Shares in affiliated companies |
|
|
|
|
Receivables in affiliated companies |
35.507,00 |
4.491,00 |
2.392,00 |
|
Shares in associated companies |
|
|
|
|
Loans to associated companies |
|
|
|
|
Short term investment |
84.798,00 |
225.064,00 |
54.195,00 |
|
Other loans |
19.637,00 |
3.115,00 |
409,00 |
|
Short Term Deposit and guarantees |
|
|
|
|
Provisions |
|
|
-248,00 |
|
V. Short-term own shares |
|
|
|
|
VI. Treasury |
43.533,00 |
25.048,00 |
36.639,00 |
|
VII. Periodification adjustments |
4.080,00 |
6.539,00 |
8.813,00 |
|
ASSETS (A + B + C + D) |
884.105,00 |
1.082.590,00 |
1.196.502,00 |
Assets composition
Liabilities
Figures given in thousands €
|
|
31/12/2004 (12) |
31/12/2005 (12) |
30/12/2006 (12) |
|
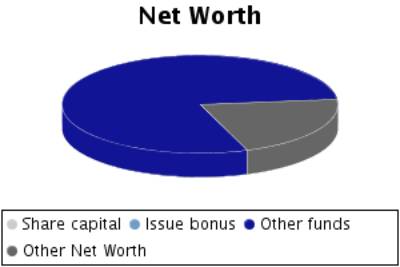
A) SHAREHOLDERS EQUITY |
424.312,00 |
487.542,00 |
414.465,00 |
|
I. Share capital |
3,00 |
3,00 |
3,00 |
|
II. Issue bonus |
|
|
|
|
III.Revaluation reserve |
340,00 |
340,00 |
340,00 |
|
IV.Reserves |
340.592,00 |
391.469,00 |
326.700,00 |
|
Retained earnings |
1,00 |
1,00 |
1,00 |
|
Sinking fund from owner equity |
|
|
|
|
Reserve for the parent company capital |
|
|
|
|
Statutory reserve |
|
|
|
|
Other funds |
340.591,00 |
391.468,00 |
326.699,00 |
|
Capital adjustments in Euros |
|
|
|
|
V.Results from previous years |
|
|
|
|
Carry Over |
|
|
|
|
Prior years losses |
|
|
|
|
Loans from
partners for losses compensation |
|
|
|
|
VI.Profit and
Losses |
83.377,00 |
95.730,00 |
87.422,00 |
|
VII.Dividend
paid during the year |
|
|
|
|
VIII.Own shares
for capital reduction |
|
|
|
|
B) DEFERRED
INCOME |
7.691,00 |
9.961,00 |
6.290,00 |
|
Capital grants |
9,00 |
|
|
|
Positive change
difference |
1.799,00 |
|
|
|
Other deferred
income |
5.883,00 |
9.961,00 |
6.290,00 |
|
Fiscal deferred
income |
|
|
|
|
C) PROVISIONS FOR LIABILITIES AND EXPENSES |
1.274,00 |
1.593,00 |
17.805,00 |
|
Provision for pensions plans |
|
|
|
|
Provision for taxes |
|
|
|
|
Other provisions |
1.274,00 |
1.593,00 |
17.805,00 |
|
Reversion fund |
|
|
|
|
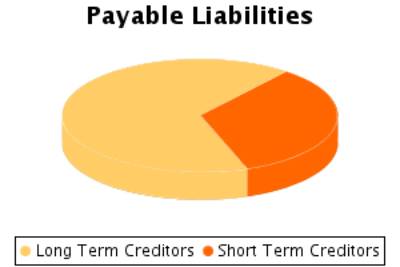
D) LONG TERM LIABILITIES |
297.490,00 |
416.581,00 |
502.922,00 |
|
I.Negotiable
bonds and other negotiable values |
|
|
|
|
Non convertible
securities |
|
|
|
|
Convertible
securities |
|
|
|
|
Other
convertible debentures |
|
|
|
|
II.Debt with
bank entities |
228.337,00 |
351.256,00 |
413.373,00 |
|
Long term bank
loans |
228.337,00 |
351.256,00 |
413.373,00 |
|
Leasing |
|
|
|
|
III.Debts with associated
and affiliated companies |
63.043,00 |
36.697,00 |
81.463,00 |
|
With affiliated companies |
63.043,00 |
36.697,00 |
81.463,00 |
|
Associated companies |
|
|
|
|
IV. Other creditors |
5.304,00 |
27.095,00 |
6.485,00 |
|
Bills payable |
|
|
|
|
Other debts |
|
20.282,00 |
|
|
Long term deposit and guaranties |
277,00 |
577,00 |
1.122,00 |
|
Taxes receivable |
5.027,00 |
6.236,00 |
5.363,00 |
|
V. Deferred debts on shares |
806,00 |
1.533,00 |
1.601,00 |
|
From affiliated companies |
806,00 |
1.533,00 |
1.601,00 |
|
From associated companies |
|
|
|
|
Other companies |
|
|
|
|
VI. Long term debt with creditor |
|
|
|
|
E) SHORT TERM LIABILITIES |
153.338,00 |
166.913,00 |
255.020,00 |
|
I.Negotiable
bonds and other negotiable values |
|
|
|
|
Non convertible
securities |
|
|
|
|
Convertible
securities |
|
|
|
|
Other
convertible debentures |
|
|
|
|
Interests from
bonds |
|
|
|
|
II.Debt with
bank entities |
53.595,00 |
23.131,00 |
69.533,00 |
|
Loans and other
debts |
53.595,00 |
23.131,00 |
69.533,00 |
|
Debt interest |
|
|
|
|
Leasing |
|
|
|
|
III. Short term
debts with associated and affiliated companies |
|
38.487,00 |
59.518,00 |
|
With affiliated companies |
|
38.487,00 |
59.518,00 |
|
Associated companies |
|
|
|
|
IV. Commercial creditors |
67.369,00 |
89.288,00 |
101.857,00 |
|
Accounts payable |
|
|
|
|
Expenses |
67.369,00 |
89.288,00 |
101.857,00 |
|
Bills payable |
|
|
|
|
V. Other non-commercial debt |
29.573,00 |
9.972,00 |
13.221,00 |
|
Government |
8.831,00 |
7.055,00 |
9.915,00 |
|
Bills payable |
|
|
|
|
Other debts |
17.724,00 |
8,00 |
178,00 |
|
Accounts receivable |
3.018,00 |
2.909,00 |
3.128,00 |
|
Short term deposits and guarantees |
|
|
|
|
VI. Provisions for current assets |
|
|
|
|
VII. Periodification adjustments |
2.801,00 |
6.035,00 |
10.891,00 |
|
F) SHORT TERM PROVISIONS FOR LIABILITIES AND
EXPENSES |
|
|
|
|
LIABILITIES (A + B + C + D + E + F) |
884.105,00 |
1.082.590,00 |
1.196.502,00 |
Liabilities
Composition
PROFIT AND LOSS ACCOUNT
Itams of the Profit and Loss Account
Figures given in thousands €
|
|
31/12/2004 (12) |
31/12/2005 (12) |
30/12/2006 (12) |
|
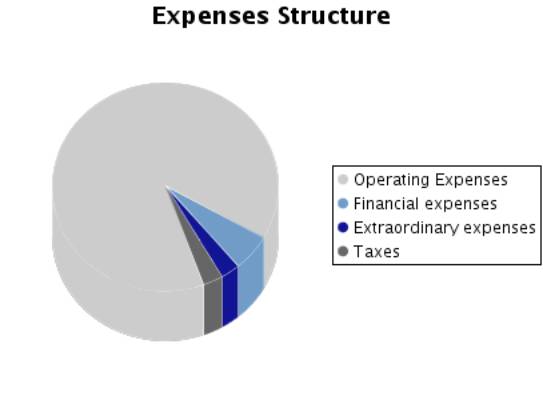
A) EXPENSES (A.1 a A.16) |
642.653,00 |
679.715,00 |
769.999,00 |
|
A.1.Reduction in
stocks of finished goods and work in progress |
4.172,00 |
4.628,00 |
|
|
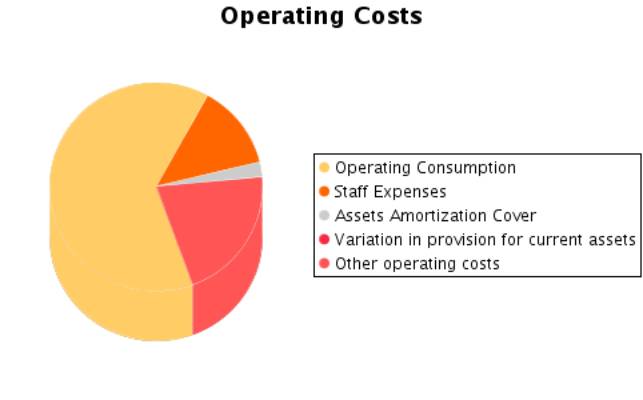
A.2.Supplies |
380.697,00 |
396.770,00 |
428.267,00 |
|
Material
consumed |
283.367,00 |
315.831,00 |
326.627,00 |
|
Raw materials
consumed |
63.666,00 |
56.240,00 |
69.875,00 |
|
Other expenses |
33.664,00 |
24.699,00 |
31.765,00 |
|
A.3. Labour cost |
69.067,00 |
77.175,00 |
87.982,00 |
|
Wages |
53.094,00 |
59.256,00 |
68.011,00 |
|
Social security
expenses |
15.973,00 |
17.919,00 |
19.971,00 |
|
A.4. Assets
depreciation |
13.468,00 |
12.688,00 |
16.282,00 |
|
A.5.Variance in
the traffic provisions |
-85,00 |
|
|
|
Variance in
provision for inventory |
|
|
|
|
Variance in
provision for bad debts |
-85,00 |
|
|
|
Variance in provision
for other current assets |
|
|
|
|
A.6. Other
operating costs |
101.943,00 |
122.085,00 |
140.364,00 |
|
External costs |
101.090,00 |
121.026,00 |
139.024,00 |
|
Taxes |
853,00 |
1.059,00 |
1.340,00 |
|
Other day to day
expenses |
|
|
|
|
Allowance to
reversion fund |
|
|
|
|
A.I.OPERATING RESULT
(B.1+B.2+B.3+B.4-A.1-A.2-A.3-A.4-A.5-A.6) |
142.087,00 |
118.205,00 |
151.210,00 |
|
A.7.Financial expenses and similar |
14.990,00 |
21.631,00 |
30.025,00 |
|
Debts with related companies |
1.998,00 |
2.835,00 |
3.421,00 |
|
Debts with associated companies |
|
|
|
|
Other companies debts By debts with third parties and similar expenses |
12.706,00 |
17.599,00 |
26.602,00 |
|
Losses from financial investments |
286,00 |
1.197,00 |
2,00 |
|
A.8. Variation in financial investment provision |
|
|
|
|
A.9.Negative exchange difference |
19.831,00 |
3.626,00 |
13.961,00 |
|
A.II.POSITIVE
FINANCIAL RESULTS (B.5+B.6+B.7+B.8-A.7-A.8-A.9) |
|
12.901,00 |
|
|
A.III.PROFIT
FROM ORDINARY ACTIVITIES (A.I+A.II-B.I-B.II) |
120.031,00 |
131.106,00 |
130.818,00 |
|
A.10. Variation
in provision in fixed assets |
14.113,00 |
16.217,00 |
11.270,00 |
|
A.11. Losses in
fixed assets |
316,00 |
273,00 |
1.340,00 |
|
A.12. Losses
from own shares and bonds |
|
|
|
|
A.13.
Extraordinary charges |
7.894,00 |
8.077,00 |
19.314,00 |
|
A.14.Other
exercises’ expenses and losses |
|
|
|
|
A.IV.POSITIVE
EXTRAORDINARY RESULT (B.9+B.10+B.11+B.12+B.13-A.10-A.11-A.12-A.13-A.14) |
|
|
|
|
A.V.PROFIT
BEFORE TAXES (A.III+A.IV-B.III-B.IV) |
99.624,00 |
112.275,00 |
108.616,00 |
|
A.15.Corporate
Taxes |
16.247,00 |
16.545,00 |
21.194,00 |
|
A.16. Other
taxes |
|
|
|
|
A.VI.EXERCISE
RESULT (PROFIT) (A.V-A.14-A.15) |
83.377,00 |
95.730,00 |
87.422,00 |
|
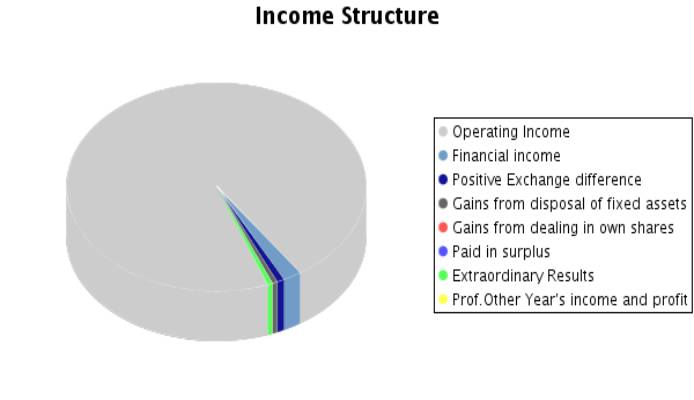
B) INCOMES (B.1 a B13) |
726.030,00 |
775.445,00 |
857.421,00 |
|
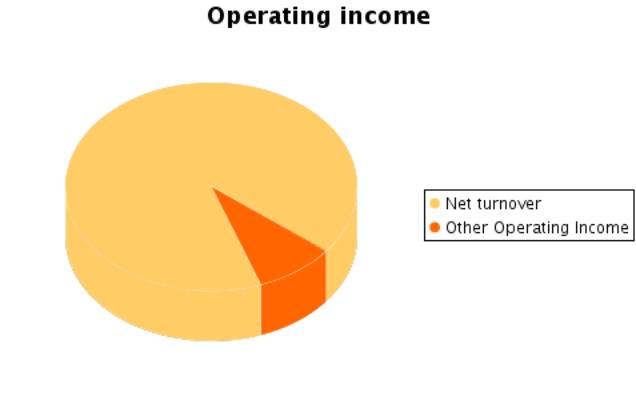
B.1. Turnover |
663.310,00 |
675.758,00 |
750.680,00 |
|
Sales |
663.312,00 |
675.761,00 |
750.682,00 |
|
Services provided |
|
|
|
|
Refunds and sale reminders |
-2,00 |
-3,00 |
-2,00 |
|
B.2.Increase in inventory of finished goods and
works in progress |
|
|
393,00 |
|
B.3.Expenses capitalized |
|
|
|
|
B.4. Other operating income |
48.039,00 |
55.793,00 |
73.032,00 |
|
Other incomes |
48.039,00 |
55.793,00 |
73.032,00 |
|
Grants |
|
|
|
|
Excess in provision for liabilities and charges |
|
|
|
|
B.I.OPERATING
LOSSES (A.1+A.2+A.3+A.4+A.5+A.6-B.1-B.2-B.3-B.4) |
|
|
|
|
B.5.Incomes from
share participations |
|
8.638,00 |
1.346,00 |
|
From affiliated
companies |
|
8.638,00 |
1.346,00 |
|
From associated
companies |
|
|
|
|
From other
companies |
|
|
|
|
B.6.Income from
other securities and credits to fixed assets |
1.701,00 |
5.280,00 |
5.000,00 |
|
From affiliated
companies |
|
|
|
|
From associated companies |
|
|
|
|
Other companies |
1.701,00 |
5.280,00 |
5.000,00 |
|
B.7.Other interests and similar |
3.101,00 |
6.628,00 |
10.504,00 |
|
From affiliated companies |
909,00 |
524,00 |
642,00 |
|
From associated companies |
|
|
|
|
Other Interests |
2.192,00 |
6.104,00 |
9.862,00 |
|
Profits from investments |
|
|
|
|
B.8. Positive change difference |
7.963,00 |
17.612,00 |
6.744,00 |
|
B.II. NEGATIVE FINANCIAL RESULTS
(A.7+A.8+A.9-B.5-B.6-B.7-B.8) |
22.056,00 |
|
20.392,00 |
|
B.III.LOSSES
FROM ORDINARY ACTIVITIES (B.I+B.II-A.I-A.II) |
|
|
|
|
B.9.B.9. Gains
from disposal of fixed assets |
30,00 |
2.663,00 |
5.057,00 |
|
B.10.Gains from
dealing in own shares |
|
|
|
|
B.11. Paid in
surplus |
|
|
|
|
B.12.
Extraordinary income |
1.886,00 |
3.073,00 |
4.665,00 |
|
B.13.Other
year’s income and profits |
|
|
|
|
B.IV.NEGATIVE
EXTRAORDINARY LOSSES (A.10+A.11+A.12+A.13+A.14-B.9-B.10-B.11-B.12-B.13) |
20.407,00 |
18.831,00 |
22.202,00 |
|
B.V.LOSS BEFORE
TAXES (B.III+B.IV-A.III-A.IV) |
|
|
|
|
B.VI.EXERCISE
RESULTS (LOSS) (B.V+A.14+A.15) |
|
|
|
Composition of the
Profit and Loss Account
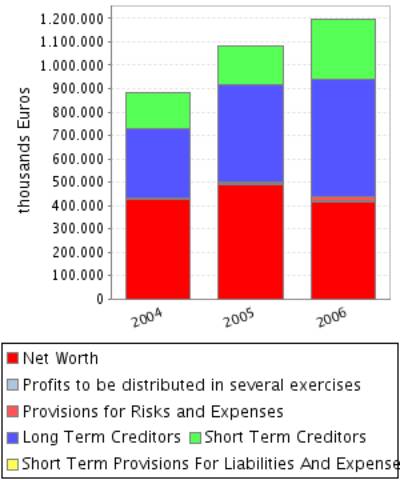
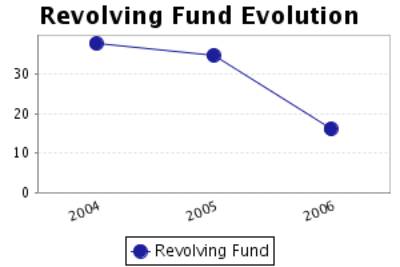
FINANCIAL BALANCE
Here the Main Capital Amounts of the company and the Revolving Fund
Evolution are analysed.
Financial Balance Table
Figures given in thousands €
|
|
31/12/2004 (12) |
% |
31/12/2005 (12) |
% |
30/12/2006 (12) |
% |
|
A) DUE FROM
SHAREHOLDERS FOR UNCALLED CAPITAL |
|
|
|
|
|
|
|
B) FIXED ASSETS |
395.353,00 |
44,72 |
533.431,00 |
49,27 |
742.815,00 |
62,08 |
|
C) DEFERRED
EXPENSES |
602,00 |
0,07 |
4.911,00 |
0,45 |
5.331,00 |
0,45 |
|
D) CURRENT
ASSETS |
488.150,00 |
55,21 |
544.248,00 |
50,27 |
448.356,00 |
37,47 |
|
ASSETS (A + B +
C + D) |
884.105,00 |
|
1.082.590,00 |
|
1.196.502,00 |
|
|
|
||||||
|
A) SHAREHOLDERS
EQUITY |
424.312,00 |
47,99 |
487.542,00 |
45,03 |
414.465,00 |
34,64 |
|
B) DEFERRED
INCOME |
7.691,00 |
0,87 |
9.961,00 |
0,92 |
6.290,00 |
0,53 |
|
C) PROVISIONS
FOR LIABILITIES AND EXPENSES |
1.274,00 |
0,14 |
1.593,00 |
0,15 |
17.805,00 |
1,49 |
|
D) LONG TERM
LIABILITIES |
297.490,00 |
33,65 |
416.581,00 |
38,48 |
502.922,00 |
42,03 |
|
E) SHORT TERM
LIABILITIES |
153.338,00 |
17,34 |
166.913,00 |
15,42 |
255.020,00 |
21,31 |
|
F) SHORT TERM
PROVISIONS FOR LIABILITIES AND EXPENSES |
|
|
|
|
|
|
|
LIABILITIES (A +
B + C + D + E + F) |
884.105,00 |
|
1.082.590,00 |
|
1.196.502,00 |
|
Financial Balance
Composition
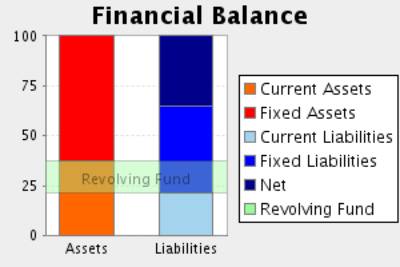
Comments on Financial Balance
In the 2004, the assets of the company were formed in 44,79% of Fixed
Assets and in 55,21% of Current Assets.This assets were financed in 48,86% with
own capitals, and in 33,79% with long term debt and in 17,34% with current
liabilities.
The result of this financial structure is a positive turnover fund of
334.812,00 Euros, which is equivalent to 37,87% proportion of the
company’s total assets.
In the 2005, the assets of the company were formed in 49,73% of Fixed
Assets and in 50,27% of Current Assets.This assets were financed in 45,95% with
own capitals, and in 38,63% with long term debt and in 15,42% with current
liabilities.
The result of this financial structure is a positive turnover fund of
377.335,00 Euros, which is equivalent to 34,85% proportion of the
company’s total assets.
This measure has increased with respect to the previous exercise in
12,70% having, however, diminished its proportion with respect to the total
assets of the company.
In the 2006, the assets of the company were formed in 62,53% of Fixed
Assets and in 37,47% of Current Assets.This assets were financed in 35,17% with
own capitals, and in 43,52% with long term debt and in 21,31% with current
liabilities.
The result of this financial structure is a positive turnover fund of
193.336,00 Euros, which is equivalent to 16,16% proportion of the
company’s total assets.
RATIOS
Main Ratios
|
|
31/12/2004 (12) |
31/12/2005 (12) |
30/12/2006 (12) |
|
STRUCTURAL RATIOS |
|
|
|
|
Management fund |
334.812,00 |
377.335,00 |
193.336,00 |
|
Management Fund Requirement |
204.932,00 |
142.748,00 |
169.482,00 |
|
Indebtedness (%) |
51,14 |
54,04 |
64,84 |
|
External Funds on Net Worth |
1,05 |
1,18 |
1,84 |
|
GENERAL ACTIVITY RATIO |
|
|
|
|
Turnover Increase (%) |
1,95 |
1,88 |
11,09 |
|
Added value growth (%) |
9,90 |
-7,34 |
22,78 |
|
Cash Flow |
110.873,00 |
124.635,00 |
114.974,00 |
|
Labour Productivity |
3,25 |
2,70 |
2,90 |
|
Assets turnover |
0,75 |
0,62 |
0,63 |
|
Breakdown Point |
401.763,59 |
469.633,08 |
509.054,26 |
|
Security Margin of the Breakdown Point (%) |
43,52 |
35,80 |
38,20 |
|
ACTIVITY RATIOS |
|
|
|
|
Average Payment Period |
63 |
80 |
86 |
|
Average Collection Period |
61 |
62 |
68 |
|
Inventory Turnover Period |
102 |
87 |
98 |
|
SOLVENCY RATIOS |
|
|
|
|
Payback Capacity |
0,24 |
0,21 |
0,15 |
|
Assets Guarantee |
1,95 |
1,84 |
1,54 |
|
Short Term Debts Proportion (%) |
33,92 |
28,53 |
32,87 |
|
Interest Coverage |
5,58 |
3,16 |
2,33 |
|
LIQUIDITY RATIOS |
|
|
|
|
Current Ratio |
3,18 |
3,26 |
1,76 |
|
Immediate liquidity |
1,20 |
1,54 |
0,37 |
|
Treasury |
129.880,00 |
234.587,00 |
23.854,00 |
|
Sales on Current Assets |
489 |
447 |
603 |
Results Analysis
Ratios
|
|
31/12/2004 (12) |
31/12/2005 (12) |
30/12/2006 (12) |
|
Economic profitability (%) |
16,07 |
10,92 |
12,64 |
|
Operating Profitability (%) |
21,42 |
17,49 |
20,14 |
|
Equity gearing |
1,73 |
2,41 |
2,46 |
|
Financial profitability (%) |
19,30 |
19,24 |
20,78 |
|
General Profitability (%) |
12,57 |
14,17 |
11,65 |
Comments on the
Results Analysis Ratios
The economic profitability in the year2005 achieved a 10,92% positive
level, due to a 17,49% economic margin and to an assets turnover of0,62%.
The economic profitability in the year has reduced from 16,07% up to
10,92% of2005, even if it remains positive. This fall is due to the decrease in
operating profitability, that has passe from 21,42% to 17,49%, as assets
turnover whose index has passed from 0,75 to 0,62%.
Financial profitability on 2005 achieved a 19,24%.
The company’s financial structure has instigated its economic
profitability with an indebtedness level of 2,41.
The general profitability on 2005 achieved a 14,17%.
The economic profitability in the year2006 achieved a 12,64% positive
level, due to a 20,14% economic margin and to an assets turnover of0,63%.
The economic profitability in the year has increased from 10,92% up to
12,64%. This growth is due to the economic margin increase, from 17,49% to the
current 20,14Y%, and to the assets turnover index, which in the last period has
achieved 0,63, compared to 0,62 del 2005.
Financial profitability on 2006 achieved a 20,78%.
The company’s financial structure has instigated its economic
profitability with an indebtedness level of 2,46.
The general profitability on 2006 achieved a 11,65%.
SECTORIAL ANÁLYSIS
Large Capital Amounts and Financial Balance
Figures given in %
|
|
COMPANY (2006) |
SECTOR |
DIFFERENCE |
DIFFERENCE RELATIVE |
|
|
|
|
|
|
ASSETS |
|
|
|
|
|
|
|
|
|
|
A) DUE FROM
SHAREHOLDERS FOR UNCALLED CAPITAL |
|
0,00 |
|
|
|
|
|
|
|
|
B) FIXED ASSETS |
62,08 |
26,33 |
35,75 |
135,74 |
|
|
|
|
|
|
C) DEFERRED
EXPENSES |
0,45 |
0,02 |
0,43 |
2.268,42 |
|
|
|
|
|
|
D) CURRENT ASSETS |
37,47 |
73,65 |
-36,18 |
-49,12 |
|
|
|
|
|
|
ASSETS (A + B +
C + D) |
100 |
100 |
|
|
|
|
|
|
|
|
|
|
|
|
|
|
|
|
|
|
|
|
COMPANY (2006) |
SECTOR |
DIFFERENCE |
DIFFERENCE RELATIVE |
|
|
|
|
|
|
LIABILITIES |
|
|
|
|
|
|
|
|
|
|
A) SHAREHOLDERS
EQUITY |
34,64 |
45,73 |
-11,09 |
-24,25 |
|
|
|
|
|
|
B) DEFERRED
INCOME |
0,53 |
0,24 |
0,29 |
122,69 |
|
|
|
|
|
|
C) PROVISIONS
FOR LIABILITIES AND EXPENSES |
1,49 |
0,69 |
0,80 |
116,57 |
|
|
|
|
|
|
D) LONG TERM
LIABILITIES |
42,03 |
4,78 |
37,26 |
780,21 |
|
|
|
|
|
|
E) SHORT TERM
LIABILITIES |
21,31 |
48,45 |
-27,14 |
-56,02 |
|
|
|
|
|
|
F) SHORT TERM
PROVISIONS FOR LIABILITIES AND EXPENSES |
|
0,12 |
|
|
|
|
|
|
|
|
LIABILITIES (A +
B + C + D + E + F) |
100 |
100 |
|
|
|
|
|
|
|
Sectorial Financial
Balance Comparison
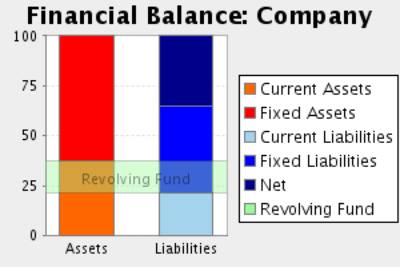
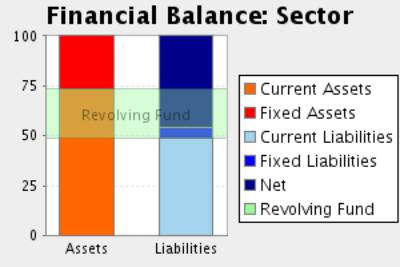
Comments to the Sectorial Analysis
In the 2006, the assets of the company were formed in 62,53% of fixed
assets and in 37,47Current Assets % In the sector, the proportion of fixed
assets was of 26,35%, 137,28% inferior, and the proportion of current assets
was of 73,65%, 49,12% superior.
The assets were financed in the company in 35,17% with own capitals , in
43,52% with fixed liabilities and in 21,31% with current liabilities In the
sector, the self financing represented 45,97%, 23,49% superior. On the other
hand the long term debts represented in the sector an average of 5,46%
financing, with a relative difference of 696,63% in favour of the companyAnd,
short term liabilities represented in the sector an average of 48,57%
financing, with a relative difference of 56,13% favourable to the sector
The result of this company’s financial structure is a turnover fund that
represents 16,16% of the total assets; in the sector, this same proportion is
25,08%, therefore, we can say that the company’s turnover fund is 35,56%
smaller than the sector one.
Analytical Account of Results
Figures given in %
|
|
COMPANY (2006) |
SECTOR |
DIFFERENCE |
DIFFERENCE RELATIVE |
|
Turnover |
91,13 |
98,19 |
-7,06 |
-7,19 |
|
Other operating income |
8,87 |
1,81 |
7,06 |
388,97 |
|
Production Value |
100,00 |
100,00 |
0,00 |
0,00 |
|
Operating expenses |
51,94 |
62,81 |
-10,87 |
-17,30 |
|
Other operation expenses |
17,04 |
11,85 |
5,19 |
43,75 |
|
Added value |
31,01 |
25,34 |
5,67 |
22,38 |
|
Labour cost |
10,68 |
15,28 |
-4,60 |
-30,09 |
|
Gross Economic Result |
20,33 |
10,06 |
10,27 |
102,03 |
|
Assets depreciation |
1,98 |
1,76 |
0,22 |
12,24 |
|
Variation in provision for current assets and bad debt losses |
|
-0,13 |
|
|
|
Net Economic Result |
18,36 |
8,43 |
9,93 |
117,87 |
|
Financial income |
2,86 |
0,42 |
2,44 |
582,58 |
|
Financial Charges |
5,34 |
0,83 |
4,51 |
546,49 |
|
Variation in financial investment provision |
|
0,08 |
|
|
|
Ordinary
Activities Result |
15,88 |
7,94 |
7,94 |
100,03 |
|
Extraordinary income |
1,18 |
0,64 |
0,54 |
83,23 |
|
Extraordinary charges |
2,51 |
0,35 |
2,16 |
613,07 |
|
Variation in provision in fixed assets |
1,37 |
0,39 |
0,98 |
251,28 |
|
Results before Taxes |
13,19 |
7,84 |
5,35 |
68,22 |
|
Corporate taxes |
2,57 |
2,57 |
0,00 |
0,16 |
|
Net Result |
10,61 |
5,28 |
5,33 |
101,14 |
|
Assets depreciation |
1,98 |
1,76 |
0,22 |
12,24 |
|
Change of Provisions |
1,37 |
0,34 |
1,03 |
299,42 |
|
Net Self-Financing |
13,96 |
7,38 |
6,58 |
89,11 |
Main Ratios
|
|
COMPANY (2006) |
PTILE25 |
PTILE50 |
PTILE75 |
|
STRUCTURAL RATIOS |
|
|
|
|
|
Management fund |
193.336,00 |
4.087,06 |
9.337,85 |
26.511,00 |
|
Management Fund
Requirement |
169.482,00 |
-973,51 |
5.071,65 |
9.831,28 |
|
Indebtedness (%) |
64,84 |
48,18 |
55,26 |
76,13 |
|
External Funds
on Net Worth |
1,84 |
0,93 |
1,24 |
3,19 |
|
GENERAL ACTIVITY
RATIO |
|
|
|
|
|
Turnover Increase (%) |
11,09 |
-5,89 |
2,68 |
17,53 |
|
Added value growth (%) |
22,78 |
-11,25 |
1,10 |
18,84 |
|
Cash Flow |
114.974,00 |
1.819,74 |
3.124,72 |
13.409,66 |
|
Labour Productivity |
2,90 |
1,38 |
1,92 |
2,99 |
|
Assets turnover |
0,63 |
1,07 |
1,95 |
3,01 |
|
Breakdown Point |
509.054,26 |
32.919.904,32 |
53.972.842,11 |
95.015.481,18 |
|
Security Margin
of the Breakdown Point (%) |
38,20 |
9,58 |
27,75 |
55,15 |
|
ACTIVITY RATIOS |
|
|
|
|
|
Average Payment
Period |
86 |
17 |
44 |
82 |
|
Average
Collection Period |
68 |
61 |
88 |
105 |
|
Inventory
Turnover Period |
98 |
13 |
37 |
49 |
|
SOLVENCY RATIOS |
|
|
|
|
|
Payback Capacity |
0,15 |
0,06 |
0,24 |
0,33 |
|
Assets Guarantee |
1,54 |
1,31 |
1,81 |
2,08 |
|
Short Term Debts
Proportion (%) |
32,87 |
82,84 |
95,64 |
99,50 |
|
Interest Coverage |
2,33 |
1,03 |
19,64 |
16.511,32 |
|
LIQUIDITY RATIOS |
|
|
|
|
|
Current Ratio |
1,76 |
1,19 |
1,74 |
2,04 |
|
Immediate liquidity |
0,37 |
0,04 |
0,17 |
0,34 |
|
Treasury |
23.854,00 |
-3.088,04 |
2.346,32 |
16.468,00 |
|
Sales on Current Assets |
603 |
558 |
947 |
1.141 |
Results Analysis
Ratios
|
|
COMPANY (2006) |
PTILE25 |
PTILE50 |
PTILE75 |
|
Economic profitability (%) |
12,64 |
4,11 |
15,94 |
20,53 |
|
Operating Profitability (%) |
20,14 |
2,42 |
6,51 |
15,49 |
|
Equity gearing |
2,46 |
1,63 |
2,03 |
2,32 |
|
Financial profitability (%) |
20,78 |
3,20 |
17,02 |
25,92 |
|
General Profitability (%) |
11,65 |
0,34 |
3,60 |
10,02 |
NOTES
In answer to your request of a Financial
Report on the above-mentioned company,
we inform you that the requested product cannot be processed as the necessary
accounts haven’t been published yet.
Last Accounts published in Borme are those from the exercise: 2006.
FOREIGN EXCHANGE
RATES
|
Currency |
Unit
|
Indian Rupees |
|
US Dollar |
1 |
Rs.48.52 |
|
UK Pound |
1 |
Rs.72.62 |
|
Euro |
1 |
Rs.63.76 |
RATING
EXPLANATIONS
|
RATING |
STATUS |
PROPOSED CREDIT LINE |
|
|
>86 |
Aaa |
Possesses an extremely sound financial base with the strongest
capability for timely payment of interest and principal sums |
Unlimited |
|
71-85 |
Aa |
Possesses adequate working capital. No caution needed for credit
transaction. It has above average (strong) capability for payment of interest
and principal sums |
Large |
|
56-70 |
A |
Financial & operational base are regarded healthy. General unfavourable
factors will not cause fatal effect. Satisfactory capability for payment of
interest and principal sums |
Fairly Large |
|
41-55 |
Ba |
Overall operation is considered normal. Capable to meet normal
commitments. |
Satisfactory |
|
26-40 |
B |
Unfavourable & favourable factors carry similar weight in credit
consideration. Capability to overcome financial difficulties seems
comparatively below average. |
Small |
|
11-25 |
Ca |
Adverse factors are apparent. Repayment of interest and principal sums
in default or expected to be in default upon maturity |
Limited with
full security |
|
<10 |
C |
Absolute credit risk exists. Caution needed to be exercised |
Credit not
recommended |
|
NR |
In view of the lack of information, we have no basis upon which to
recommend credit dealings |
No Rating |
|
This score serves as a reference to assess SC’s credit risk
and to set the amount of credit to be extended. It is calculated from a composite
of weighted scores obtained from each of the major sections of this report. The
assessed factors and their relative weights (as indicated through %) are as
follows:
Financial
condition (40%) Ownership
background (20%) Payment
record (10%)
Credit history
(10%) Market trend
(10%) Operational
size (10%)