![]()
MIRA
INFORM REPORT
|
Report Date : |
12.12.2008 |
IDENTIFICATION
DETAILS
|
Name : |
ACERINOX SA |
|
|
|
|
Registered Office : |
|
|
|
|
|
Country : |
Spain |
|
|
|
|
Financials (as on) : |
31.12.2007 |
|
|
|
|
Date of Incorporation : |
|
|
|
|
|
Legal Form : |
Joint Stock Company |
|
|
|
|
Line of Business : |
RATING &
COMMENTS
|
MIRA’s Rating : |
A |
|
RATING |
STATUS |
PROPOSED CREDIT LINE |
|
|
56-70 |
A |
Financial & operational base are regarded healthy. General
unfavourable factors will not cause fatal effect. Satisfactory capability for
payment of interest and principal sums |
Fairly Large |
|
Maximum Credit Limit : |
6.000.000,00 € |
|
|
|
|
Status : |
Good |
|
|
|
|
Payment Behaviour : |
Regular |
|
|
|
|
Litigation : |
Exists |
FINANCIAL REPORT
ACERINOX SA
TAX NUMBER: A28250777
EXECUTIVE SUMMARY
Identification
Current Business Name: ACERINOX SA
Other names: NO
Current Address: STREET SANTIAGO
DE COMPOSTELA, 100, CP 28035 MADRID
Branches: 6
Telephone number: 913985157 Fax: 913985196
URL: www.acerinox.com Corporate e-mail: webmaster@acxgrup.com
Commercial Risk
Credit Appraisal:
6.000.000,00 €
RAI: NO
Legal Actions: YES
Financial Information
Latest Balance sheet sales (2007): 2.648.088.000,00 € (MERCANTILE REGISTER)
Result: 130.722.000 €
Total Assets:
2.417.200.000 €
Social Capital: 63.575.000,00 €
Employees: 2.696
Commercial Information
Constitution Date: 30/09/1970
Business activity: Iron &
steel industry
NACE Code: 2710
International Operations: Imports
Corporate Structure
President:
Participations: 38
Other Complementary Information
Latest proceeding published in BORME: 24/11/2008 Other
statutory acts
Latest press article: 04/11/2008 CINCO
DIAS (SUBSIDIARIES INFORMATION)
Bank Entities: Yes
COMMERCIAL RISK
Credit Appraisal
Maximum Credit
(from 0 a 6,000,000 €)
Favourable to 6.000.000,00 €
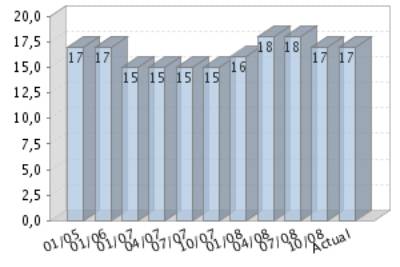
Rating Evolution
Financial Situation
Fiscal year2007
|
Treasury |
Excellent |
|
Indebtedness |
Weak |
|
Profitability |
Average |
|
Balance |
Excellent |
Performance
|
Legal Actions |
None or Negligible |
|
Business
Trajectory |
Excellent |
COMPANY NOT REGISTERED IN THE R.A.I.
This company is not registered in the Disputed Bills register (R.A.I.)
INCIDENTS

Summary
|
LEGAL ACTIONS: 1 ( last:
29/10/2008 )Insolvency Proceeding: |
0 |
|
Civil Court: |
0 |
|
Social Court/
Industrial Tribunal: |
1 |
CLAIM FILED AGAINST THE ADMINISTRATION: No administrative
claims registered
AFFECTED BY:
1 Company / Companies in Insolvency Proceedings.
Last Legal Actions
Figures expressed in €
SOCIAL COURT/INDUSTRIAL TRIBUNAL
1 incidence(s)
|
DATE |
INCIDENCE STATUS |
ACTOR |
AMOUNT |
|
29/10/2008 |
SOCIAL LEGAL ACTION |
RODRIGUEZ LUQUE MIGUEL ANGEL |
3.441,25 |
FINANCIAL ELEMENTS AND SECTORIAL
COMPARATIVE
FINANCIAL ELEMENTS
Figures given in thousands €
|
|
2005 (12) |
2006 (12) |
2007 (12) |
% ASSETS |
|
|
|
|
|
|
BALANCE SHEET
ANALYSIS |
|
|
|
|
|
|
|
|
|
|
OWN FUNDS |
1.266.937,00 |
1.311.491,00 |
1.319.960,00 |
54,61 |
|
|
|
|
|
|
DEBT |
719.402,00 |
1.188.207,00 |
1.097.240,00 |
45,39 |
|
|
|
|
|
|
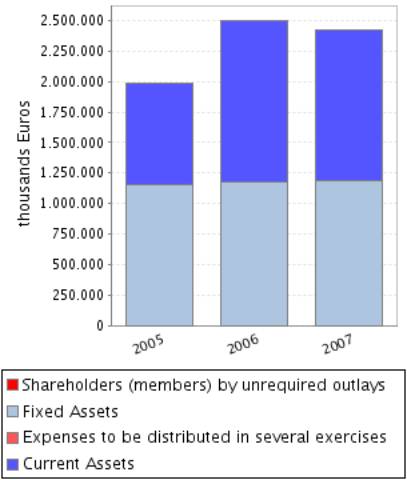
FIXED ASSETS |
1.158.592,00 |
1.172.002,00 |
1.183.197,00 |
48,95 |
|
|
|
|
|
|
TOTAL ASSETS |
1.986.339,00 |
2.499.698,00 |
2.417.200,00 |
|
|
|
|
|
|
|
|
|
|
|
|
|
|
|
|
|
|
|
2005 (12) |
2006 (12) |
2007 (12) |
% SALES |
|
|
|
|
|
|
PROFIT AND LOSS
ACCOUNT ANALYSIS |
|
|
|
|
|
|
|
|
|
|
SALES |
1.603.288,00 |
2.278.886,00 |
2.648.088,00 |
|
|
|
|
|
|
|
ADDED VALUE |
221.408,00 |
394.161,00 |
377.672,00 |
14,26 |
|
|
|
|
|
|
EBITDA |
109.262,00 |
262.900,00 |
248.293,00 |
9,38 |
|
|
|
|
|
|
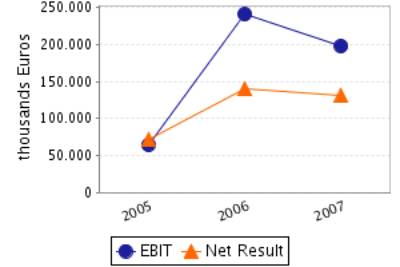
EBIT |
64.249,00 |
241.155,00 |
198.149,00 |
7,48 |
|
|
|
|
|
|
NET RESULT |
71.524,00 |
140.337,00 |
130.722,00 |
4,94 |
|
|
|
|
|
Balance Sheets Items
Analysis
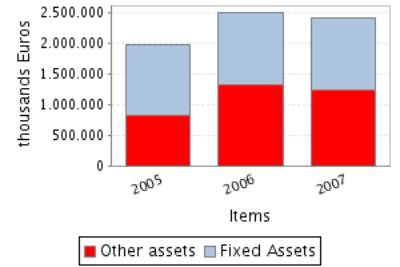
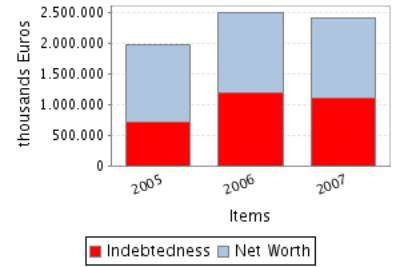
Balance Sheet Comments
Total assets of the company grew 25,84% between 2005 and 2006.
This growth has been inferior in the case of the fixed assets that
increased just in 1,16%.
This growth has been mainly financed with a debt increase of 65,17%.
Nevertheless the net worth increased 3,52%.
Total assets of the company decreased in 3,30% between 2006 and 2007.
In spite of the decrease in the amount of total assets, fixed assets
grew 0,96%.
Assets reduction contrasts with net worth growth of 0,65%. Therefore,
the company’s indebtedness has reduced in 7,66%.
Profit and Loss Account Analysis
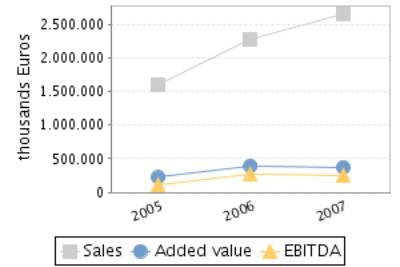
Profit and Loss Account Comments
The company’s sales figure grew 42,14% between 2005 and 2006.
The company’s EBIT grew 275,34% between 2005 and 2006.
This evolution implies an increase in the company’s operating
profitability.
The result of these variations is an increase of the company’s Economic
Profitability of 198,27% in the analysed period, being this profitability of
9,65% in the year 2006.
The company’s Net Result grew 96,21% between 2005 and 2006.
This evolution, compared to the EBIT’s performance, implies that the
financial and extraordinary activities have had a negative effect in the
company’s Financial Profitability.
The result of these variations is an increase of the company’s Economic
Profitability of 89,55% in the analysed period, being equal to 10,70% in the
year 2006.
The company’s sales figure grew 16,20% between 2006 and 2007.
The company’s EBIT decreased in 17,83% between 2006 and 2007.
This evolution implies a reduction in the company’s operating
profitability.
The result of these variations is a decrease of the company’s Economic
Profitability of 15,03% in the analysed period, being this profitability of
8,20% in the year 2007.
The company’s Net Result decreased in 6,85% between 2006 and 2007.
This evolution, compared to the EBIT’s performance, implies that the
financial and extraordinary activities have had a positive effect in the
company’s Financial Profitability.
The result of these variations is a reduction of the company’s
profitability of 7,45% in the analysed period, being equal to 9,90% in the year
2007.
ANNUAL FINANCIAL REPORT ADDITIONAL DATA
Source: annual financial report 2007
Results Distribution
Figures given in €
|
DISTRIBUTION
BASE |
DISTRIBUTION TO |
||
|
Profit and Loss |
130.722.000,00 |
Retained earnings |
0,00 |
|
Carry Over |
0,00 |
Voluntary Reserve |
41.277.000,00 |
|
Voluntary reserves |
0,00 |
Prior years losses |
0,00 |
|
Reserves |
0,00 |
Carry Over |
0,00 |
|
Other concepts |
0,00 |
Other funds |
0,00 |
|
Total of Amounts to be distributed |
130.722.000,00 |
Dividends |
89.445.000,00 |
|
|
|
Other Applications |
0,00 |
Auditing
Auditors’ opinion: FAVOURABLE
Auditor: KPMG AUDITORES S.L.
COMPARATIVE SECTOR ANALYSIS
Values table
Figures expressed in %
|
|
COMPANY (2007) |
SECTOR |
DIFFERENCE |
DIFFERENCE RELATIVE |
|
|
|
|
|
|
BALANCE SHEET
ANALYSIS: % on the total assets |
|
|
|
|
|
|
|
|
|
|
OWN FUNDS |
54,61 |
51,98 |
2,63 |
5,05 |
|
|
|
|
|
|
DEBT |
45,39 |
48,02 |
-2,63 |
-5,47 |
|
|
|
|
|
|
FIXED ASSETS |
48,95 |
49,30 |
-0,35 |
-0,72 |
|
|
|
|
|
|
|
|
|
|
|
|
|
|
|
|
|
|
COMPANY (2007) |
SECTOR |
DIFFERENCE |
DIFFERENCE RELATIVE |
|
|
|
|
|
|
PROFIT AND LOSS
ACCOUNT ANALYSIS: % on the total operating income |
|
|
|
|
|
|
|
|
|
|
SALES |
99,67 |
99,22 |
0,45 |
0,46 |
|
|
|
|
|
|
ADDED VALUE |
14,22 |
18,32 |
-4,11 |
-22,42 |
|
|
|
|
|
|
EBIT |
7,46 |
6,32 |
1,14 |
18,01 |
|
|
|
|
|
|
NET RESULT |
4,92 |
5,76 |
-0,84 |
-14,62 |
|
|
|
|
|
Sector Composition
Compared sector (NACE): 271
Number of companies: 43
Size (Sales Figure) :
Comments on the sectorial comparative
Compared to its sector the assets of the companies show an inferior
proportion of fixed assets. Specifically the difference with the sector average
is -0,35% , which means a relative difference of -0,72% .
In liabilities composition the company appeals on a wider scale to self
financing, being the proportion of net worth of 2,63% superior, which means a
relative difference of 5,05% . As a consequence, external financing sources are
less used by the company in 2,63% less than the sector, which means a
difference of 5,47% .
The proportion that the sales mean to the company’s total ordinary
income is 99,67%, 0,45% higher than in the sector, which means a relative
difference of 0,46% .
The company’s EBIT was positive and was 7,46% with regard to the total
ordinary income, 1,14% higher than in the sector, which means a relative
difference of 18,01% .
The company’s capacity to generate operating income is higher than the
one of the sector as its ratio EBIT/Sales is higher (ES Company versus ES
Sector).
The company’s net result was positive and equal to 4,92% with regard to
the total ordinary income, 0,84% less than the sector, which means a relative
difference of 14,62% .
The financial and extraordinary results and the tax impact have had a
negative impact on the Net result in the company with a worse behaviour than in
the sector; as a consequence, the company shows a worse Net Result/EBIT ratio
(REBEmpresa vs. REBSector).
ADDRESSES
Current Legal Seat Address:
STREET SANTIAGO DE COMPOSTELA, 100
28035 MADRID
Previous Seat Address:
STREET DOCTOR FLEMING, 51
28036
MADRID
|
STREET |
POSTAL CODE |
TOWN |
PROVINCE |
|
STREET LLETRA F DE LA ZONA FRANCA 20 SECTOR C |
08040 |
BARCELONA |
Barcelona |
|
STREET DEL FERRO 9 15 POL. IND. RIUCLAR |
43006 |
TARRAGONA |
Tarragona |
|
STREET LERMANDABIDEA S/N POL. IND. DE JUNDIZ |
01015 |
VITORIA-GASTEIZ |
Álava |
|
STREET MILANOS 4 POLIGONO LA ESTACION |
28320 |
PINTO |
Madrid |
|
PARQUE RAURELL,
32-34 PARC D’ACTIVITATS ECONOMIQUES EL CAMI REAL |
08850 |
GAVA |
Barcelona |
|
PGO. IND.
PIADELA CORTINAN, S/N |
15319 |
BETANZOS |
La Coruña |
6 branches registered
CORPORATE STRUCTURE
ADMINISTRATIVE LINKS
Main Board members, Directors and Auditor ![]()
|
POSITION |
SURNAMES AND
NAME |
APPOINTMENT DATE |
|
|
PRESIDENT |
NARANJO OLMEDO RAFAEL |
08/08/2008 |
|
|
CHIEF OFFICER |
LLADO FERNANDEZ URRUTIA JOSE |
20/07/2000 |
|
|
CHIEF OFFICER |
CORPORACION FINANCIERA ALBA SA |
31/05/2002 |
|
|
CHIEF OFFICER |
ANGLO AMERICAN |
31/05/2002 |
|
|
CHIEF OFFICER |
BOYD LESLIE |
31/07/2002 |
|
|
CHIEF OFFICER |
LEJEUNE CASTRILLO JOSE LUIS |
31/07/2002 |
|
|
CHIEF OFFICER |
KOMORI SUSUMU EN REPR DE METAL ONE |
10/06/2004 |
|
|
CHIEF OFFICER |
ODA FUMIO |
08/07/2005 |
|
|
CHIEF OFFICER |
PRADO PEREZ SEOANE DIEGO |
08/07/2005 |
|
|
AUDITOR |
APPOINTMENT DATE |
||
|
KPMG AUDITORES SL |
14/10/2008 |
||
Functional Managers
|
POSITION |
SURNAMES AND
NAME |
|
General Manager |
VELAZQUEZ HERREROS BERNARDO |
|
Financial Manager |
FERRANDIS TORRES MIGUEL |
|
Human Resources Manager |
PEREZ PENA JUAN |
|
Commercial Manager |
RIESTRA PITA JOSE |
|
Marketing Manager |
FERNANDEZ LUDENA SONSOLES |
|
IT Manager |
CONDE MATEO MIGUEL |
FINANCIAL LINKS
|
|
BUSINESS NAME |
CIF / COUNTRY |
% |
SOURCE |
DATA INF. |
|
|
ALBA PARTICIPACIONES S.A. |
A28363125 |
20,25 |
STOCK EXCH. |
14/12/2006 |
|
|
FEYNMAN CAPITAL S.L. |
B82406638 |
12,29 |
STOCK EXCH. |
04/01/2008 |
|
|
NISSHIN STEEL CO LTD |
JAPÓN |
11,09 |
STOCK EXCH. |
14/12/2006 |
|
|
CASA GRANDE DE
CARTAGENA S.L. |
B30605851 |
5,00 |
EXPANSIÓN |
14/12/2006 |
|
|
METAL ONE |
JAPÓN |
4,00 |
EXPANSIÓN |
07/09/2006 |
|
|
MARATHON ASSET
MANAGEMENT |
UNITED KINGDOM |
3,00 |
ELECONOMISTA |
28/05/2008 |
|
|
BUSINESS NAME |
CIF / COUNTRY |
% |
SOURCE |
DATA INF. |
|
|
INOXIDABLES DE EUSKADI SA |
A01055912 |
100,00 |
OWN SOURCES |
17/01/2008 |
|
|
ACERINOX ARGENTINA SA |
ARGENTINA |
100,00 |
TRADE REG. |
31/12/2007 |
|
|
ACERINOX PACIFIC LTD |
HONG KONG |
100,00 |
TRADE REG. |
31/12/2007 |
|
|
ACERINOX ITALIA SRL |
ITALY |
100,00 |
TRADE REG. |
31/12/2007 |
|
|
ACERINOX MALAYSIA SDN.BHD |
MALASIA |
100,00 |
TRADE REG. |
31/12/2007 |
|
|
ACERINOX SOUTH EAST ASIA PTE LTD |
SINGAPUR |
100,00 |
TRADE REG. |
31/12/2007 |
CREDIT INFORMATION
Constitution Date: 30/09/1970
Activity: Iron & steel industry
NACE Code: 2710
NACE Activity: Manufacture of
basic iron and steel and of ferro-alloys (ECSC)
Business: FABRICACION Y VENTA DE PRODUCTOS PLANOS DE
ACERO INOXIDABLE
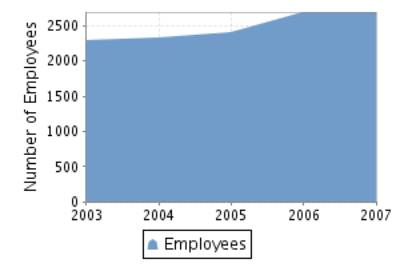
Employees 
Number of total employees: 2.696 (2007)
Number of fixed employees: 91,54%
Number of temporary employees: 8,46%
Employees evolution
COMMERCIAL OPERATIONS 
PURCHASES
Payments (estimated):
Imports from: .
SUPPLIERS
|
BUSINESS NAME |
INTERNATIONAL |
|
ACERINOX UK LTD |
YES |
|
ACERINOX BENELUX
SA NV |
YES |
|
ACEROL LTDA |
YES |
|
ROLDAN SA |
NO |
|
ACERINOX
AUSTRALASIA PTY LTD |
NO |
|
INOXCENTER SA |
NO |
|
INOXSERVI DINA
SA |
NO |
|
ACERINOX USA LTD |
YES |
|
ACEROL LTDA
(PORTUGAL) |
YES |
|
ACERINOX
MALAYSIA |
YES |
36 proveedores
CLIENTS
|
BUSINESS NAME |
INTERNATIONAL |
|
NORTH AMERICAN
STAINLESS LP |
YES |
|
D.A. ACERINOX
CHILE SA |
YES |
|
ACIMETAL SA |
NO |
|
ROLDAN SA |
NO |
|
COLUMBUS
STAINLESS (PTY) LTD |
YES |
|
ACCESORIOS
ITALIA RSL |
YES |
|
ACERINOX
AUSTRALASIA PTY LTD |
YES |
|
ACEROL LTDA
(PORTUGAL) |
YES |
|
INOXMETAL SA |
NO |
|
ACERINOX
SCANDINAVIA SA |
YES |
34 clientes
Banks 
|
ENTITY |
BRANCH |
ADDRESS |
TOWN OR CITY |
PROVINCE |
|
BANCO DE VASCONIA, S.A. |
4713 |
LUCHANA, 30 |
MADRID |
Madrid |
|
BANCO BILBAO VIZCAYA ARGENTARIA, S.A. |
|
|
|
|
|
BANCO
GUIPUZCOANO, S.A. |
|
|
|
|
|
BANCO SANTANDER, S.A. |
|
|
|
|
4 bank entities registered
BRANDS, SIGNS AND COMMERCIAL NAMES ![]()
Brand name: CEDINOX (Valid)
Type: JOINT Date: 29/12/2003
Brand name: GRUPOACERINOX (Valid)
Type: DENOMINATIVE Date: 04/06/2003
Brand name: ACERINOXGROUP (Valid)
Type: DENOMINATIVE Date: 04/06/2003
Brand name: ACXGROUP (Valid)
Type: DENOMINATIVE Date: 04/06/2003
Brand name: ACERINOX.COM (Valid)
Type: JOINT Date: 16/10/2000
LEGAL STRUCTURE
Constitution Data
Register Date: 30/09/1970
Current Legal Form: JOINT STOCK
COMPANY
Current Capital:
63.575.000,00 €
Legal Aspects
Obligation to fill in Financial
Statements: YES
Chamber census: YES (2006)
Listed on a Stock Exchange: YES
Type of quoting: ONLY EQUITY
SECURITIES
Stock Exchanges in which it is listed: MADRID, BARCELONA
B.O.R.M.E.(Official Companies Registry Gazette) ![]()
Registered Proceedings
|
PROCEEDINGS |
DATE |
NOTICE NUM. |
TRADE REG. |
|
Other statutory acts |
24/11/2008 |
537793 |
Madrid |
|
Other statutory acts |
18/11/2008 |
526750 |
Madrid |
|
Other statutory acts |
17/10/2008 |
479626 |
Madrid |
|
Appointments |
14/10/2008 |
473336 |
Madrid |
Other Proceedings published
|
PROCEEDINGS |
DATE |
NOTICE NUM. |
TRADE REG. |
|
Registration of accounts (2007) Consolidated |
04/09/2008 |
402756 |
Madrid |
Press articles

04/11/2008 CINCO DIAS (SUBSIDIARIES INFORMATION)
ACERINOX HA SIDO LA PRIMERA EMPRESA EN VENDER CAPITAL EN EL MERCADO
ESTADOUNIDENSE PAGADO EN DOLARES. BANK OF NEW YORK MELLON (BNYM) HA COLOCADO
ENTRE LOS INVERSORES DE ESTADOS UNIDOS UN TOTAL DE 2.700 TITULOS DE LA
SIDERURGICA A UN PRECIO MEDIO DE 6,35 DOLARES (4,97 EUROS). LA COMERCIALIZACION
SE HA REALIZADO A TRAVES DEL SISTEMA DE ADR (AMERICAN DEPOSITARY RECEIPTS) YA
QUE, POR REGULACION, UNA ENTIDAD DEPOSITARIA (EN ESTE CASO EL BANK OF NEW YORK)
PUEDE OFRECER PARTICIPACIONES EN EMPRESAS EXTRANJERAS SIN TENER EL CONOCIMIENTO
DE LA EMPRESA AFECTADA. LOS 2.700 TITULOS RECIBEN EL NOMBRE DE ADS (AMERICAN
DEPOSITARY SHARES).
04/11/2008 ELECONOMISTA (SUBSIDIARIES INFORMATION)
ALBA HA AUMENTADO SU PORCENTAJE EN ACERINOX DE UN 23,3% HASTA UN 23,8%,
SEGUN UN COMUNICADO REMITIDO A LA CNMV.
FINANCIAL INFORMATION
The information on the last account contained in this report is
extracted from the Mercantile Register file of the legal address of the Company
BALANCE SHEET
Assets
Figures given in thousands €
|
|
31/12/2005 (12) |
31/12/2006 (12) |
31/12/2007 (12) |
|
A) DUE FROM SHAREHOLDERS FOR UNCALLED CAPITAL |
|
|
|
|
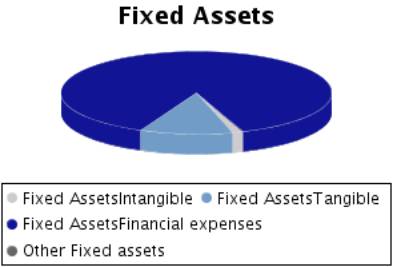
B) FIXED ASSETS |
1.158.592,00 |
1.172.002,00 |
1.183.197,00 |
|
I. Incorporation costs |
|
|
|
|
II. Intangible fixed assets |
14.883,00 |
18.916,00 |
14.907,00 |
|
R & D expenses |
3.707,00 |
2.303,00 |
4.635,00 |
|
Concessions, patents, licences , trademarks |
19.876,00 |
23.861,00 |
24.517,00 |
|
Goodwill |
|
|
|
|
Acquired rights from finance leases |
168,00 |
168,00 |
168,00 |
|
Software |
12.669,00 |
13.499,00 |
14.431,00 |
|
Leasing |
|
|
|
|
Cash advance |
|
|
2.297,00 |
|
Provisions |
2.333,00 |
5.954,00 |
-547,00 |
|
Depreciation |
-23.870,00 |
-26.869,00 |
-30.594,00 |
|
III. Tangible fixed assets |
115.907,00 |
114.450,00 |
131.258,00 |
|
Property, plant and equipment |
153.153,00 |
154.090,00 |
155.701,00 |
|
Machinery, equipment and other |
718.267,00 |
743.451,00 |
759.560,00 |
|
Other property plant and equipment |
4.547,00 |
4.776,00 |
5.069,00 |
|
Prepaid expenses on fixed assets |
5.132,00 |
2.169,00 |
26.979,00 |
|
Other assets |
38.617,00 |
40.798,00 |
40.348,00 |
|
Provisions |
|
|
|
|
Depreciation |
-803.809,00 |
-830.834,00 |
-856.399,00 |
|
IV. Financial fixed assets |
1.027.802,00 |
1.038.636,00 |
1.037.032,00 |
|
Shares in affiliated companies |
1.018.608,00 |
1.018.636,00 |
1.045.627,00 |
|
Receivables in affiliated companies |
|
|
|
|
Shares in associated companies |
912,00 |
912,00 |
912,00 |
|
Loans to associated companies |
|
|
|
|
Securities |
18.355,00 |
18.355,00 |
18.355,00 |
|
Other loans |
35,00 |
57,00 |
43,00 |
|
Long term deposits and guarantees |
454,00 |
718,00 |
767,00 |
|
Provisions |
-10.562,00 |
-42,00 |
-28.672,00 |
|
Taxes receivable |
|
|
|
|
V.Owners equity |
|
|
|
|
VI.Long term trade liabilities |
|
|
|
|
C) DEFERRED EXPENSES |
|
|
1.129,00 |
|
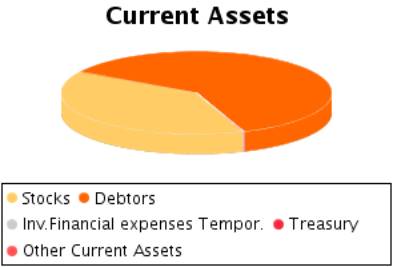
D) CURRENT ASSETS |
827.747,00 |
1.327.696,00 |
1.232.874,00 |
|
I. Shareholders by required outlays |
|
|
|
|
II. Stocks |
385.591,00 |
438.774,00 |
481.230,00 |
|
Goods available for sale |
|
|
|
|
Raw material inventory |
147.366,00 |
121.867,00 |
163.273,00 |
|
Work in Progress |
98.209,00 |
181.483,00 |
140.201,00 |
|
Finished goods |
144.708,00 |
133.737,00 |
198.979,00 |
|
Subproducts and recycled materials |
12.308,00 |
8.071,00 |
2.297,00 |
|
Cash advance |
155,00 |
62,00 |
207,00 |
|
Provisions |
-17.155,00 |
-6.446,00 |
-23.727,00 |
|
III. Debtors |
438.242,00 |
881.720,00 |
749.289,00 |
|
Clients |
64.778,00 |
112.754,00 |
122.385,00 |
|
Amounts owned by affiliated companies |
360.233,00 |
760.100,00 |
617.400,00 |
|
Amounts owned by associated companies |
904,00 |
291,00 |
9,00 |
|
Other debts |
1.155,00 |
6.548,00 |
934,00 |
|
Staff Expenses |
56,00 |
69,00 |
64,00 |
|
Government |
16.638,00 |
7.509,00 |
10.152,00 |
|
Provisions |
-5.522,00 |
-5.551,00 |
-1.655,00 |
|
IV. Temporary financial investment |
949,00 |
1.390,00 |
|
|
Shares in affiliated companies |
|
|
|
|
Receivables in affiliated companies |
|
|
|
|
Shares in associated companies |
|
|
|
|
Loans to associated companies |
|
|
|
|
Short term investment |
|
|
|
|
Other loans |
947,00 |
1.388,00 |
|
|
Short Term Deposit and guarantees |
2,00 |
2,00 |
|
|
Provisions |
|
|
|
|
V. Short-term own shares |
|
|
|
|
VI. Treasury |
2.149,00 |
5.465,00 |
1.820,00 |
|
VII. Periodification adjustments |
816,00 |
347,00 |
535,00 |
|
ASSETS (A + B + C + D) |
1.986.339,00 |
2.499.698,00 |
2.417.200,00 |
Assets composition
Liabilities
Figures given in thousands €
|
|
31/12/2005 (12) |
31/12/2006 (12) |
31/12/2007 (12) |
|
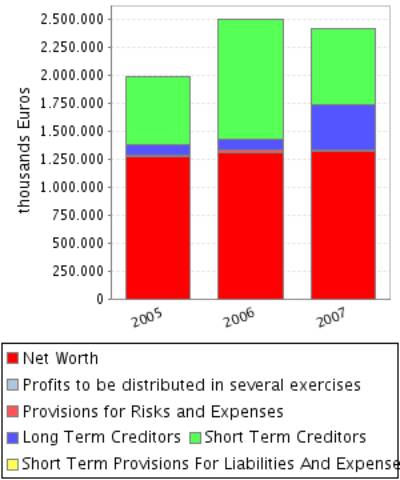
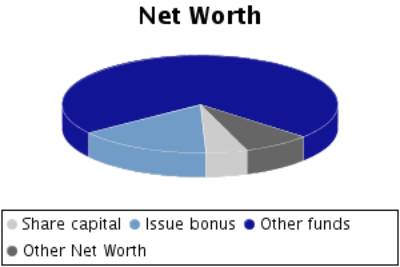
A) SHAREHOLDERS EQUITY |
1.266.661,00 |
1.310.983,00 |
1.319.552,00 |
|
I. Share capital |
64.875,00 |
64.875,00 |
64.875,00 |
|
II. Issue bonus |
253.089,00 |
232.329,00 |
206.379,00 |
|
III.Revaluation reserve |
21.834,00 |
21.834,00 |
5.243,00 |
|
IV.Reserves |
873.504,00 |
877.558,00 |
943.662,00 |
|
Retained earnings |
12.975,00 |
12.975,00 |
12.975,00 |
|
Sinking fund from owner equity |
|
|
5.458,00 |
|
Reserve for the parent company capital |
|
|
|
|
Statutory reserve |
|
|
|
|
Other funds |
860.529,00 |
864.583,00 |
925.229,00 |
|
Capital adjustments in Euros |
|
|
|
|
V.Results from previous years |
|
|
|
|
Carry Over |
|
|
|
|
Prior years losses |
|
|
|
|
Loans from partners for losses compensation |
|
|
|
|
VI.Profit and Losses |
71.524,00 |
140.337,00 |
130.722,00 |
|
VII.Dividend paid during the year |
-18.165,00 |
-25.950,00 |
-25.871,00 |
|
VIII.Own shares for capital reduction |
|
|
-5.458,00 |
|
B) DEFERRED INCOME |
276,00 |
508,00 |
408,00 |
|
Capital grants |
|
508,00 |
408,00 |
|
Positive change difference |
|
|
|
|
Other deferred income |
276,00 |
|
|
|
Fiscal deferred income |
|
|
|
|
C) PROVISIONS FOR LIABILITIES AND EXPENSES |
14.253,00 |
17.423,00 |
13.744,00 |
|
Provision for pensions plans |
|
|
|
|
Provision for taxes |
650,00 |
592,00 |
613,00 |
|
Other provisions |
13.603,00 |
16.831,00 |
13.131,00 |
|
Reversion fund |
|
|
|
|
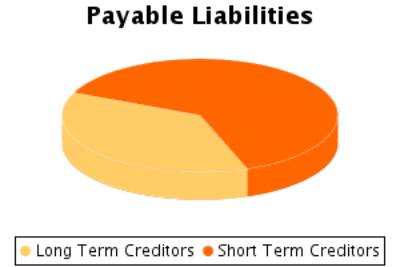
D) LONG TERM LIABILITIES |
102.727,00 |
103.146,00 |
403.387,00 |
|
I.Negotiable bonds and other negotiable values |
|
|
|
|
Non convertible securities |
|
|
|
|
Convertible securities |
|
|
|
|
Other convertible debentures |
|
|
|
|
II.Debt with bank entities |
101.329,00 |
101.737,00 |
401.978,00 |
|
Long term bank loans |
101.329,00 |
101.737,00 |
401.978,00 |
|
Leasing |
|
|
|
|
III.Debts with associated and affiliated
companies |
|
|
|
|
With affiliated companies |
|
|
|
|
Associated companies |
|
|
|
|
IV. Other creditors |
1.398,00 |
1.409,00 |
1.409,00 |
|
Bills payable |
|
|
|
|
Other debts |
|
|
|
|
Long term deposit and guaranties |
1.398,00 |
1.409,00 |
1.409,00 |
|
Taxes receivable |
|
|
|
|
V. Deferred debts on shares |
|
|
|
|
From affiliated companies |
|
|
|
|
From associated companies |
|
|
|
|
Other companies |
|
|
|
|
VI. Long term debt with creditor |
|
|
|
|
E) SHORT TERM LIABILITIES |
602.422,00 |
1.067.638,00 |
680.109,00 |
|
I.Negotiable bonds and other negotiable values |
|
|
|
|
Non convertible securities |
|
|
|
|
Convertible securities |
|
|
|
|
Other convertible debentures |
|
|
|
|
Interests from bonds |
|
|
|
|
II.Debt with bank entities |
383.975,00 |
635.060,00 |
316.088,00 |
|
Loans and other debts |
382.603,00 |
633.071,00 |
313.146,00 |
|
Debt interest |
1.372,00 |
1.989,00 |
2.942,00 |
|
Leasing |
|
|
|
|
III. Short term debts with associated and
affiliated companies |
1.933,00 |
5.664,00 |
16.286,00 |
|
With affiliated companies |
1.933,00 |
5.664,00 |
16.286,00 |
|
Associated companies |
|
|
|
|
IV. Commercial creditors |
146.591,00 |
282.883,00 |
254.239,00 |
|
Accounts payable |
7.943,00 |
5.714,00 |
6.442,00 |
|
Expenses |
106.097,00 |
228.037,00 |
195.370,00 |
|
Bills payable |
32.551,00 |
49.132,00 |
52.427,00 |
|
V. Other non-commercial debt |
52.951,00 |
125.463,00 |
74.762,00 |
|
Government |
8.884,00 |
61.089,00 |
15.257,00 |
|
Bills payable |
9.257,00 |
1.249,00 |
3.979,00 |
|
Other debts |
34.810,00 |
63.067,00 |
55.526,00 |
|
Accounts receivable |
|
|
|
|
Short term deposits and guarantees |
|
58,00 |
|
|
VI. Provisions for current assets |
|
|
|
|
VII. Periodification adjustments |
16.972,00 |
18.568,00 |
18.734,00 |
|
F) SHORT TERM PROVISIONS FOR LIABILITIES AND EXPENSES |
|
|
|
|
LIABILITIES (A + B + C + D + E + F) |
1.986.339,00 |
2.499.698,00 |
2.417.200,00 |
Liabilities
Composition
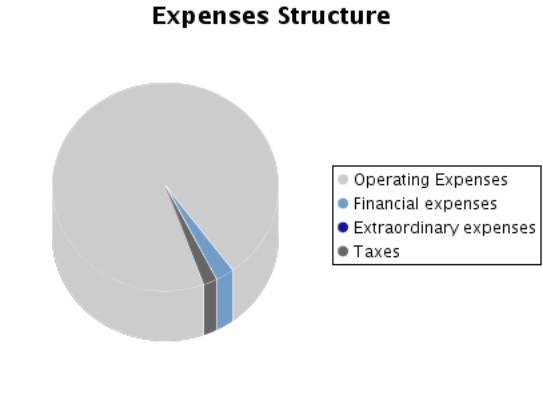
PROFIT AND LOSS ACCOUNT
Itams of the Profit and Loss Account
Figures given in thousands €
|
|
31/12/2005 (12) |
31/12/2006 (12) |
31/12/2007 (12) |
|
A) EXPENSES (A.1 a A.16) |
1.666.609,00 |
2.257.779,00 |
2.622.125,00 |
|
A.1.Reduction in stocks of finished goods and
work in progress |
|
|
|
|
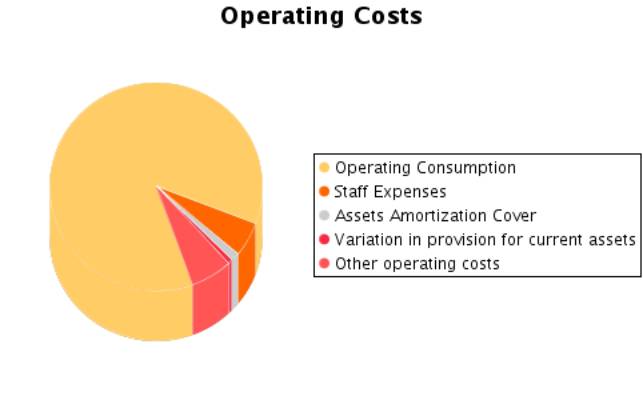
A.2.Supplies |
1.296.638,00 |
1.797.304,00 |
2.142.392,00 |
|
Material consumed |
1.098,00 |
10.182,00 |
269,00 |
|
Raw materials consumed |
1.295.540,00 |
1.787.122,00 |
2.142.123,00 |
|
Other expenses |
|
|
|
|
A.3. Labour cost |
112.146,00 |
131.261,00 |
129.379,00 |
|
Wages |
84.926,00 |
100.237,00 |
99.646,00 |
|
Social security expenses |
27.220,00 |
31.024,00 |
29.733,00 |
|
A.4. Assets depreciation |
29.152,00 |
32.402,00 |
33.043,00 |
|
A.5.Variance in the traffic provisions |
15.861,00 |
-10.657,00 |
17.101,00 |
|
Variance in provision for inventory |
15.823,00 |
-10.709,00 |
17.281,00 |
|
Variance in provision for bad debts |
38,00 |
52,00 |
-180,00 |
|
Variance in
provision for other current assets |
|
|
|
|
A.6. Other
operating costs |
153.967,00 |
176.767,00 |
154.856,00 |
|
External costs |
150.228,00 |
168.949,00 |
150.941,00 |
|
Taxes |
1.520,00 |
2.334,00 |
2.180,00 |
|
Other day to day
expenses |
2.219,00 |
5.484,00 |
1.735,00 |
|
Allowance to
reversion fund |
|
|
|
|
A.I.OPERATING
RESULT (B.1+B.2+B.3+B.4-A.1-A.2-A.3-A.4-A.5-A.6) |
64.249,00 |
241.155,00 |
198.149,00 |
|
A.7.Financial expenses and similar |
14.698,00 |
45.708,00 |
47.896,00 |
|
Debts with related companies |
71,00 |
64,00 |
1.515,00 |
|
Debts with associated companies |
|
|
|
|
Other companies debts By debts with third parties and similar expenses |
14.627,00 |
45.644,00 |
46.381,00 |
|
Losses from financial investments |
|
|
|
|
A.8. Variation in financial investment provision |
|
|
|
|
A.9.Negative exchange difference |
24.412,00 |
14.942,00 |
19.743,00 |
|
A.II.POSITIVE
FINANCIAL RESULTS (B.5+B.6+B.7+B.8-A.7-A.8-A.9) |
24.633,00 |
|
7.724,00 |
|
A.III.PROFIT
FROM ORDINARY ACTIVITIES (A.I+A.II-B.I-B.II) |
88.882,00 |
204.895,00 |
205.873,00 |
|
A.10. Variation
in provision in fixed assets |
10.309,00 |
-10.521,00 |
29.177,00 |
|
A.11. Losses in
fixed assets |
12,00 |
10,00 |
1,00 |
|
A.12. Losses
from own shares and bonds |
|
|
|
|
A.13.
Extraordinary charges |
|
|
|
|
A.14.Other
exercises’ expenses and losses |
|
|
|
|
A.IV.POSITIVE
EXTRAORDINARY RESULT (B.9+B.10+B.11+B.12+B.13-A.10-A.11-A.12-A.13-A.14) |
|
16.005,00 |
|
|
A.V.PROFIT
BEFORE TAXES (A.III+A.IV-B.III-B.IV) |
80.938,00 |
220.900,00 |
179.259,00 |
|
A.15.Corporate
Taxes |
6.663,00 |
80.539,00 |
45.081,00 |
|
A.16. Other
taxes |
2.751,00 |
24,00 |
3.456,00 |
|
A.VI.EXERCISE
RESULT (PROFIT) (A.V-A.14-A.15) |
71.524,00 |
140.337,00 |
130.722,00 |
|
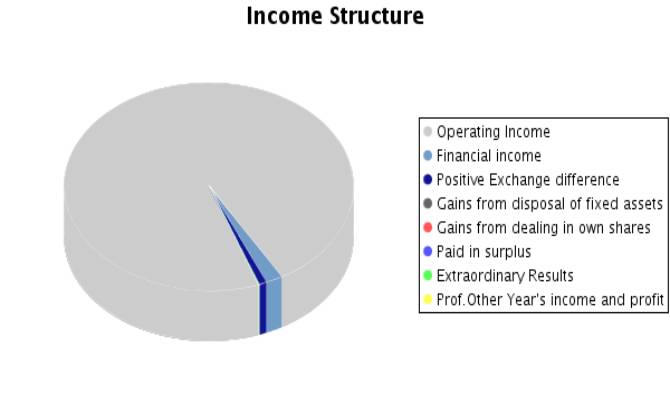
B) INCOMES (B.1 a B13) |
1.738.133,00 |
2.398.116,00 |
2.752.847,00 |
|
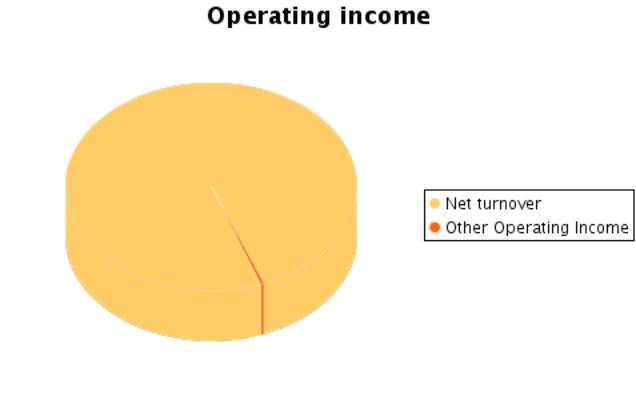
B.1. Turnover |
1.603.288,00 |
2.278.886,00 |
2.648.088,00 |
|
Sales |
1.614.121,00 |
2.288.849,00 |
2.662.017,00 |
|
Services provided |
988,00 |
1.303,00 |
1.462,00 |
|
Refunds and sale reminders |
-11.821,00 |
-11.266,00 |
-15.391,00 |
|
B.2.Increase in inventory of finished goods and
works in progress |
59.783,00 |
68.066,00 |
18.186,00 |
|
B.3.Expenses capitalized |
4.002,00 |
4.412,00 |
4.833,00 |
|
B.4. Other operating income |
4.940,00 |
16.868,00 |
3.813,00 |
|
Other incomes |
4.940,00 |
16.868,00 |
3.813,00 |
|
Grants |
|
|
|
|
Excess in provision for liabilities and charges |
|
|
|
|
B.I.OPERATING
LOSSES (A.1+A.2+A.3+A.4+A.5+A.6-B.1-B.2-B.3-B.4) |
|
|
|
|
B.5.Incomes from
share participations |
37.247,00 |
1.891,00 |
44.367,00 |
|
From affiliated
companies |
36.827,00 |
1.388,00 |
43.168,00 |
|
From associated
companies |
|
82,00 |
684,00 |
|
From other
companies |
420,00 |
421,00 |
515,00 |
|
B.6.Income from
other securities and credits to fixed assets |
|
|
|
|
From affiliated
companies |
|
|
|
|
From associated
companies |
|
|
|
|
Other companies |
|
|
|
|
B.7.Other
interests and similar |
2.968,00 |
3.241,00 |
6.794,00 |
|
From affiliated companies |
2.333,00 |
2.427,00 |
5.818,00 |
|
From associated companies |
|
|
|
|
Other Interests |
635,00 |
814,00 |
976,00 |
|
Profits from investments |
|
|
|
|
B.8. Positive change difference |
23.528,00 |
19.258,00 |
24.202,00 |
|
B.II. NEGATIVE FINANCIAL RESULTS
(A.7+A.8+A.9-B.5-B.6-B.7-B.8) |
|
36.260,00 |
|
|
B.III.LOSSES FROM ORDINARY ACTIVITIES
(B.I+B.II-A.I-A.II) |
|
|
|
|
B.9.B.9. Gains from disposal of fixed assets |
2,00 |
15,00 |
283,00 |
|
B.10.Gains from dealing in own shares |
156,00 |
|
|
|
B.11. Paid in surplus |
|
|
|
|
B.12. Extraordinary income |
2.219,00 |
5.479,00 |
2.281,00 |
|
B.13.Other year’s income and profits |
|
|
|
|
B.IV.NEGATIVE EXTRAORDINARY LOSSES
(A.10+A.11+A.12+A.13+A.14-B.9-B.10-B.11-B.12-B.13) |
7.944,00 |
|
26.614,00 |
|
B.V.LOSS BEFORE TAXES (B.III+B.IV-A.III-A.IV) |
|
|
|
|
B.VI.EXERCISE RESULTS (LOSS) (B.V+A.14+A.15) |
|
|
|
Composition of the
Profit and Loss Account
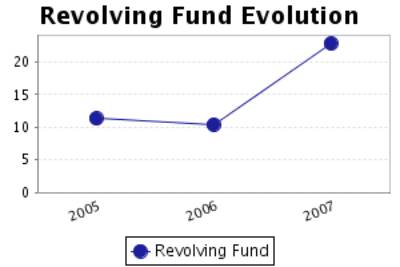
FINANCIAL BALANCE
Here the Main Capital Amounts of the company and the Revolving Fund
Evolution are analysed.
Financial Balance Table
Figures given in thousands €
|
|
31/12/2005 (12) |
% |
31/12/2006 (12) |
% |
31/12/2007 (12) |
% |
|
A) DUE FROM
SHAREHOLDERS FOR UNCALLED CAPITAL |
|
|
|
|
|
|
|
B) FIXED ASSETS |
1.158.592,00 |
58,33 |
1.172.002,00 |
46,89 |
1.183.197,00 |
48,95 |
|
C) DEFERRED
EXPENSES |
|
|
|
|
1.129,00 |
0,05 |
|
D) CURRENT
ASSETS |
827.747,00 |
41,67 |
1.327.696,00 |
53,11 |
1.232.874,00 |
51,00 |
|
ASSETS (A + B +
C + D) |
1.986.339,00 |
|
2.499.698,00 |
|
2.417.200,00 |
|
|
|
||||||
|
A) SHAREHOLDERS
EQUITY |
1.266.661,00 |
63,77 |
1.310.983,00 |
52,45 |
1.319.552,00 |
54,59 |
|
B) DEFERRED
INCOME |
276,00 |
0,01 |
508,00 |
0,02 |
408,00 |
0,02 |
|
C) PROVISIONS
FOR LIABILITIES AND EXPENSES |
14.253,00 |
0,72 |
17.423,00 |
0,70 |
13.744,00 |
0,57 |
|
D) LONG TERM
LIABILITIES |
102.727,00 |
5,17 |
103.146,00 |
4,13 |
403.387,00 |
16,69 |
|
E) SHORT TERM
LIABILITIES |
602.422,00 |
30,33 |
1.067.638,00 |
42,71 |
680.109,00 |
28,14 |
|
F) SHORT TERM
PROVISIONS FOR LIABILITIES AND EXPENSES |
|
|
|
|
|
|
|
LIABILITIES (A +
B + C + D + E + F) |
1.986.339,00 |
|
2.499.698,00 |
|
2.417.200,00 |
|
Financial Balance
Composition
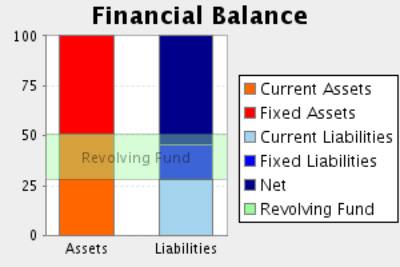
Comments on Financial Balance
In the 2005, the assets of the company were formed in 58,33% of Fixed Assets
and in 41,67% of Current Assets.This assets were financed in 63,78% with own
capitals, and in 5,89% with long term debt and in 30,33% with current
liabilities.
The result of this financial structure is a positive turnover fund of
225.325,00 Euros, which is equivalent to 11,34% proportion of the
company’s total assets.
In the 2006, the assets of the company were formed in 46,89% of Fixed
Assets and in 53,11% of Current Assets.This assets were financed in 52,47% with
own capitals, and in 4,82% with long term debt and in 42,71% with current
liabilities.
The result of this financial structure is a positive turnover fund of
260.058,00 Euros, which is equivalent to 10,40% proportion of the
company’s total assets.
This measure has increased with respect to the previous exercise in
15,41% having, however, diminished its proportion with respect to the total
assets of the company.
In the 2007, the assets of the company were formed in 49,00% of Fixed
Assets and in 51,00% of Current Assets.This assets were financed in 54,61% with
own capitals, and in 17,26% with long term debt and in 28,14% with current
liabilities.
The result of this financial structure is a positive turnover fund of
552.765,00 Euros, which is equivalent to 22,87% proportion of the
company’s total assets.
This measure has increased with respect to the previous exercise in
112,55% having also increased its proportion with respect to the total assets
of the company.
RATIOS
Main Ratios
|
|
31/12/2005 (12) |
31/12/2006 (12) |
31/12/2007 (12) |
|
STRUCTURAL RATIOS |
|
|
|
|
Management fund |
225.325,00 |
260.058,00 |
552.765,00 |
|
Management Fund Requirement |
606.202,00 |
888.263,00 |
867.033,00 |
|
Indebtedness (%) |
36,22 |
47,53 |
45,39 |
|
External Funds on Net Worth |
0,57 |
0,91 |
0,83 |
|
GENERAL ACTIVITY RATIO |
|
|
|
|
Turnover Increase (%) |
-7,02 |
42,14 |
16,20 |
|
Added value growth (%) |
-25,78 |
78,02 |
-4,18 |
|
Cash Flow |
126.846,00 |
151.561,00 |
210.043,00 |
|
Labour Productivity |
1,97 |
3,00 |
2,92 |
|
Assets turnover |
0,81 |
0,91 |
1,10 |
|
Breakdown Point |
1.336.281,51 |
1.328.595,97 |
1.668.186,57 |
|
Security Margin of the Breakdown Point (%) |
17,12 |
42,24 |
37,21 |
|
ACTIVITY RATIOS |
|
|
|
|
Average Payment Period |
43 |
59 |
43 |
|
Average Collection Period |
98 |
139 |
102 |
|
Inventory Turnover Period |
87 |
69 |
65 |
|
SOLVENCY RATIOS |
|
|
|
|
Payback Capacity |
0,18 |
0,13 |
0,19 |
|
Assets Guarantee |
2,76 |
2,10 |
2,20 |
|
Short Term Debts Proportion (%) |
83,74 |
89,85 |
61,98 |
|
Interest Coverage |
-0,64 |
1,40 |
1,77 |
|
LIQUIDITY RATIOS |
|
|
|
|
Current Ratio |
1,37 |
1,24 |
1,81 |
|
Immediate liquidity |
0,00 |
0,01 |
0,00 |
|
Treasury |
-380.877,00 |
-628.205,00 |
-314.268,00 |
|
Sales on Current Assets |
697 |
618 |
773 |
Results Analysis
Ratios
|
|
31/12/2005 (12) |
31/12/2006 (12) |
31/12/2007 (12) |
|
Economic profitability (%) |
3,24 |
9,65 |
8,20 |
|
Operating Profitability (%) |
4,01 |
10,58 |
7,48 |
|
Equity gearing |
2,17 |
1,62 |
1,90 |
|
Financial profitability (%) |
5,64 |
10,70 |
9,90 |
|
General Profitability (%) |
4,46 |
6,16 |
4,94 |
Comments on the
Results Analysis Ratios
The economic profitability in the year2006 achieved a 9,65% positive
level, due to a 10,58% economic margin and to an assets turnover of0,91%.
The economic profitability in the year has increased from 3,24% up to
9,65%. This growth is due to the economic margin increase, from 4,01% to the
current 10,58Y%, and to the assets turnover index, which in the last period has
achieved 0,91, compared to 0,81 del 2005.
Financial profitability on 2006 achieved a 10,70%.
The company’s financial structure has instigated its economic
profitability with an indebtedness level of 1,62.
The general profitability on 2006 achieved a 6,16%.
The economic profitability in the year2007 achieved a 8,20% positive
level, due to a 7,48% economic margin and to an assets turnover of1,10%.
The economic profitability in the year has reduced from 9,65% up to
8,20% of2007, even if it remains positive. Assets turnover increase whose index
has passed from 0,91 to 1,10, could not compensate operating profitability
reduction from10,58% to the current level of 7,48%.
Financial profitability on 2007 achieved a 9,90%.
The company’s financial structure has instigated its economic
profitability with an indebtedness level of 1,90.
The general profitability on 2007 achieved a 4,94%.
SECTORIAL ANÁLYSIS
Large Capital Amounts and Financial Balance
Figures given in %
|
|
COMPANY (2007) |
SECTOR |
DIFFERENCE |
DIFFERENCE RELATIVE |
|
|
|
|
|
|
ASSETS |
|
|
|
|
|
|
|
|
|
|
A) DUE FROM
SHAREHOLDERS FOR UNCALLED CAPITAL |
|
0,00 |
|
|
|
|
|
|
|
|
B) FIXED ASSETS |
48,95 |
49,30 |
-0,35 |
-0,71 |
|
|
|
|
|
|
C) DEFERRED
EXPENSES |
0,05 |
0,07 |
-0,02 |
-28,57 |
|
|
|
|
|
|
D) CURRENT
ASSETS |
51,00 |
50,63 |
0,37 |
0,73 |
|
|
|
|
|
|
ASSETS (A + B +
C + D) |
100 |
100 |
|
|
|
|
|
|
|
|
|
|
|
|
|
|
|
|
|
|
|
|
COMPANY (2007) |
SECTOR |
DIFFERENCE |
DIFFERENCE RELATIVE |
|
|
|
|
|
|
LIABILITIES |
|
|
|
|
|
|
|
|
|
|
A) SHAREHOLDERS
EQUITY |
54,59 |
51,88 |
2,71 |
5,22 |
|
|
|
|
|
|
B) DEFERRED INCOME |
0,02 |
0,10 |
-0,08 |
-79,80 |
|
|
|
|
|
|
C) PROVISIONS
FOR LIABILITIES AND EXPENSES |
0,57 |
2,06 |
-1,49 |
-72,36 |
|
|
|
|
|
|
D) LONG TERM
LIABILITIES |
16,69 |
8,14 |
8,55 |
104,91 |
|
|
|
|
|
|
E) SHORT TERM
LIABILITIES |
28,14 |
37,81 |
-9,67 |
-25,58 |
|
|
|
|
|
|
F) SHORT TERM
PROVISIONS FOR LIABILITIES AND EXPENSES |
|
0,00 |
|
|
|
|
|
|
|
|
LIABILITIES (A +
B + C + D + E + F) |
100 |
100 |
|
|
|
|
|
|
|
Sectorial Financial
Balance Comparison
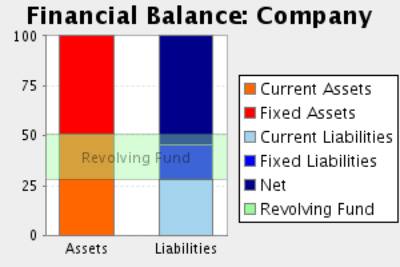
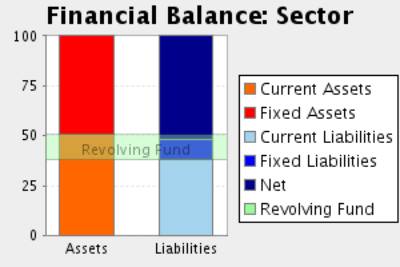
Comments to the Sectorial Analysis
In the 2007, the assets of the company were formed in 49,00% of fixed
assets and in 51,00Current Assets % In the sector, the proportion of fixed
assets was of 49,37%, 0,75% superior, and the proportion of current assets was
of 50,63%, 0,73% inferior.
The assets were financed in the company in 54,61% with own capitals , in
17,26% with fixed liabilities and in 28,14% with current liabilities In the
sector, the self financing represented 51,98%, 5,06% inferior. On the other
hand the long term debts represented in the sector an average of 10,21%
financing, with a relative difference of 69,10% in favour of the companyAnd,
short term liabilities represented in the sector an average of 37,81%
financing, with a relative difference of 25,58% favourable to the sector
The result of this company’s financial structure is a turnover fund that
represents 22,87% of the total assets; in the sector, this same proportion is
12,82%, therefore, we can say that the company’s turnover fund is 78,46% higher
than the one in of the sector.
Analytical Account of Results
Figures given in %
|
|
COMPANY (2007) |
SECTOR |
DIFFERENCE |
DIFFERENCE RELATIVE |
|
Turnover |
99,67 |
99,22 |
0,45 |
0,45 |
|
Other operating income |
0,33 |
0,78 |
-0,45 |
-57,58 |
|
Production Value |
100,00 |
100,00 |
0,00 |
0,00 |
|
Operating expenses |
79,96 |
65,02 |
14,94 |
22,99 |
|
Other operation expenses |
5,83 |
16,66 |
-10,83 |
-65,00 |
|
Added value |
14,22 |
18,32 |
-4,10 |
-22,40 |
|
Labour cost |
4,87 |
8,50 |
-3,62 |
-42,67 |
|
Gross Economic Result |
9,35 |
9,83 |
-0,48 |
-4,89 |
|
Assets depreciation |
1,24 |
3,63 |
-2,39 |
-65,80 |
|
Variation in provision for current assets and bad debt losses |
0,64 |
-0,12 |
0,76 |
-651,72 |
|
Net Economic Result |
7,46 |
6,32 |
1,14 |
18,04 |
|
Financial income |
2,84 |
1,02 |
1,82 |
179,25 |
|
Financial Charges |
2,55 |
1,00 |
1,55 |
155,51 |
|
Variation in financial investment provision |
|
0,03 |
|
|
|
Ordinary
Activities Result |
7,75 |
6,31 |
1,44 |
22,80 |
|
Extraordinary income |
0,10 |
4,08 |
-3,98 |
-97,55 |
|
Extraordinary charges |
0,00 |
1,35 |
-1,35 |
-100,00 |
|
Variation in provision in fixed assets |
1,10 |
0,94 |
0,16 |
16,53 |
|
Results before Taxes |
6,75 |
8,10 |
-1,35 |
-16,71 |
|
Corporate taxes |
1,83 |
2,34 |
-0,51 |
-21,83 |
|
Net Result |
4,92 |
5,76 |
-0,84 |
-14,63 |
|
Assets depreciation |
1,24 |
3,63 |
-2,39 |
-65,80 |
|
Change of Provisions |
1,74 |
0,86 |
0,88 |
103,03 |
|
Net Self-Financing |
7,91 |
10,25 |
-2,34 |
-22,80 |
Main Ratios
|
|
COMPANY (2007) |
PTILE25 |
PTILE50 |
PTILE75 |
|
STRUCTURAL RATIOS |
|
|
|
|
|
Management fund |
552.765,00 |
331,25 |
1.084,86 |
3.089,20 |
|
Management Fund Requirement |
867.033,00 |
-1.641,02 |
102,34 |
537,91 |
|
Indebtedness (%) |
45,39 |
46,23 |
64,35 |
71,97 |
|
External Funds on Net Worth |
0,83 |
0,86 |
1,80 |
2,57 |
|
|
|
|
|
|
|
GENERAL ACTIVITY
RATIO |
|
|
|
|
|
Turnover Increase (%) |
16,20 |
3,52 |
13,25 |
27,30 |
|
Added value growth (%) |
-4,18 |
1,64 |
7,23 |
31,28 |
|
Cash Flow |
210.043,00 |
302,22 |
680,79 |
1.910,70 |
|
Labour Productivity |
2,92 |
1,45 |
1,72 |
2,31 |
|
Assets turnover |
1,10 |
0,95 |
1,30 |
1,60 |
|
Breakdown Point |
1.668.186,57 |
3.301.365,31 |
4.558.817,16 |
54.305.225,78 |
|
Security Margin
of the Breakdown Point (%) |
37,21 |
11,40 |
17,26 |
27,61 |
|
ACTIVITY RATIOS |
|
|
|
|
|
Average Payment Period |
43 |
0 |
0 |
73 |
|
Average Collection Period |
102 |
72 |
101 |
124 |
|
Inventory Turnover Period |
65 |
25 |
45 |
79 |
|
SOLVENCY RATIOS |
|
|
|
|
|
Payback Capacity |
0,19 |
0,10 |
0,19 |
0,33 |
|
Assets Guarantee |
2,20 |
1,39 |
1,55 |
2,12 |
|
Short Term Debts Proportion (%) |
61,98 |
66,95 |
81,26 |
98,19 |
|
Interest Coverage |
1,77 |
4,29 |
13,62 |
24,31 |
|
LIQUIDITY RATIOS |
|
|
|
|
|
Current Ratio |
1,81 |
1,08 |
1,41 |
2,03 |
|
Immediate liquidity |
0,00 |
0,06 |
0,15 |
0,48 |
|
Treasury |
-314.268,00 |
-1.117,77 |
134,47 |
568,30 |
|
Sales on Current Assets |
773 |
553 |
700 |
900 |
Results Analysis
Ratios
|
|
COMPANY (2007) |
PTILE25 |
PTILE50 |
PTILE75 |
|
Economic profitability (%) |
8,20 |
4,07 |
8,40 |
12,11 |
|
Operating Profitability (%) |
7,48 |
3,47 |
6,00 |
11,04 |
|
Equity gearing |
1,90 |
1,60 |
2,11 |
3,12 |
|
Financial profitability (%) |
9,90 |
6,48 |
14,11 |
19,93 |
|
General Profitability (%) |
4,94 |
1,82 |
4,05 |
7,08 |
FOREIGN EXCHANGE
RATES
|
Currency |
Unit
|
Indian Rupees |
|
US Dollar |
1 |
Rs.48.71 |
|
UK Pound |
1 |
Rs.72.85 |
|
Euro |
1 |
Rs.64.70 |
RATING
EXPLANATIONS
|
RATING |
STATUS |
PROPOSED CREDIT LINE |
|
|
>86 |
Aaa |
Possesses an extremely sound financial base with the strongest
capability for timely payment of interest and principal sums |
Unlimited |
|
71-85 |
Aa |
Possesses adequate working capital. No caution needed for credit
transaction. It has above average (strong) capability for payment of interest
and principal sums |
Large |
|
56-70 |
A |
Financial & operational base are regarded healthy. General unfavourable
factors will not cause fatal effect. Satisfactory capability for payment of
interest and principal sums |
Fairly Large |
|
41-55 |
Ba |
Overall operation is considered normal. Capable to meet normal
commitments. |
Satisfactory |
|
26-40 |
B |
Unfavourable & favourable factors carry similar weight in credit
consideration. Capability to overcome financial difficulties seems
comparatively below average. |
Small |
|
11-25 |
Ca |
Adverse factors are apparent. Repayment of interest and principal sums
in default or expected to be in default upon maturity |
Limited with
full security |
|
<10 |
C |
Absolute credit risk exists. Caution needed to be exercised |
Credit not
recommended |
|
NR |
In view of the lack of information, we have no basis upon which to
recommend credit dealings |
No Rating |
|
This score serves as a reference to assess SC’s credit risk
and to set the amount of credit to be extended. It is calculated from a composite
of weighted scores obtained from each of the major sections of this report. The
assessed factors and their relative weights (as indicated through %) are as
follows:
Financial
condition (40%) Ownership
background (20%) Payment
record (10%)
Credit history
(10%) Market trend
(10%) Operational
size (10%)