![]()
MIRA
INFORM REPORT
|
Report Date : |
13.12.2008 |
IDENTIFICATION
DETAILS
|
Name : |
EL CORTE INGLES S.A. |
|
|
|
|
Registered Office : |
|
|
|
|
|
Country : |
Spain |
|
|
|
|
Financials (as on) : |
29.02.2008 |
|
|
|
|
Date of Incorporation : |
|
|
|
|
|
Legal Form : |
Joint Stock Company |
|
|
|
|
Line of Business : |
RATING &
COMMENTS
|
MIRA’s Rating : |
B |
|
RATING |
STATUS |
PROPOSED CREDIT LINE |
|
|
26-40 |
B |
Unfavourable & favourable factors carry similar weight in credit
consideration. Capability to overcome financial difficulties seems
comparatively below average. |
Small |
|
Maximum Credit Limit : |
6.000.000,00 € |
|
|
|
|
Status : |
Moderate |
|
|
|
|
Payment Behaviour : |
No Complaints |
|
|
|
|
Litigation : |
Exists |
FINANCIAL REPORT
EL CORTE INGLES S.A.
TAX NUMBER: A28017895
EXECUTIVE SUMMARY
Identification
Current Business Name: EL CORTE INGLES
S.A.
Commercial Name: GREEN COAST ; YERA
; EMIDIO TUCCI
Other names: YES
Current Address: STREET HERMOSILLA, 112, CP 28009 MADRID
Branches: 153
Telephone number: 914028112 Fax: 914017454
URL: www.elcorteingles.es
Corporate
e-mail: administracion@elcorteingles.es
Commercial Risk
Credit Appraisal:
6.000.000,00 €
RAI: YES
Legal Actions: YES
Financial Information
Latest Balance sheet sales (2008): 12.224.277.000,00 € (Own Sources)
Result: 473.121.000 €
Total Assets:
11.340.430.000 €
Social Capital: 486.864.000,00 €
Employees: 58.471
Commercial Information
Constitution Date: 28/06/1940
Business activity: Retail sale
in Megastores
NACE Code: 5212
International Operations: No business
relationships registered
Corporate Structure
President:
Participations: 43
Other Complementary Information
Latest proceeding published in BORME: 05/12/2008 Registration
of accounts
Latest press article: 11/12/2008 CINCO
DIAS (NEW PRODUCTS AND ACTIVITIES INFORMATION)
Bank Entities: Yes
COMMERCIAL RISK
Credit Appraisal
Maximum Credit
(from 0 a 6,000,000 €)
Favourable to 6.000.000,00 €
Rating Evolution

Financial Situation
Fiscal year2008
|
Treasury |
Very degraded |
|
Indebtedness |
Weak |
|
Profitability |
Average |
|
Balance |
Degraded |
Performance
|
Legal Actions |
None or Negligible |
|
Business
Trajectory |
Excellent |
NUMBER OF ENTRIES FOUND: 1
TOTAL AMOUNT: 328,97 €
Information from the Registro de Aceptaciones Impagados (RAI)- Disputed
Bills register.
It can only be used for information legitimate needs of the consulting
party, in accordance with its social or business activity, in order to grant a
credit or the monitoring or control of the already granted credits and can not
be transmitted or communicated to thirds, nor copied, duplicated, reproduced
nor implemented to any database , owned or external, or reused it in anyway,
direct or indirectly.
INCIDENTS

Summary
|
LEGAL
ACTIONS: 2 ( First: 09/12/2003, last: 18/03/2004 )Insolvency
Proceeding: |
0 |
|
Civil Court: |
0 |
|
Social Court/ Industrial Tribunal: |
2 |
|
CLAIM FILED
AGAINST THE ADMINISTRATION: 1 ( last: 22/02/2007 )With the
Social Security: |
1 |
|
With the Tax Authorities: |
0 |
|
With Other Official bodies: |
0 |
AFFECTED BY:
17 Company / Companies in Insolvency Proceedings.
Last Legal Actions
Figures expressed in €
SOCIAL COURT/INDUSTRIAL TRIBUNAL
2 incidence(s)
|
DATE |
INCIDENCE STATUS |
ACTOR |
AMOUNT |
|
18/03/2004 |
SOCIAL LEGAL ACTION |
PINEDA GALLEGO AGUEDA |
6.303,11 |
|
09/12/2003 |
SOCIAL LEGAL ACTION |
PEREZ DELGADO JESUSA |
|
Last claim filed against the administration
Figures expressed in €
WITH THE SOCIAL SECURITY
1 claim(s)
Notifications
|
DATE |
ORGANIZATION |
AMOUNT |
|
22/02/2007 |
CENTRAL TREASURY FOR SOCIAL SECURITY DIRECCION PROVINCIAL DE
TRABAJO Y SEGURIDAD SOCIAL |
602,00 |
FINANCIAL ELEMENTS AND SECTORIAL
COMPARATIVE
FINANCIAL ELEMENTS
Figures given in thousands €
|
|
2006 (12) |
2007 (12) |
2008 (12) |
% ASSETS |
|
|
|
|
|
|
BALANCE SHEET
ANALYSIS |
|
|
|
|
|
|
|
|
|
|
OWN FUNDS |
4.603.220,00 |
4.987.998,00 |
5.371.675,00 |
47,37 |
|
|
|
|
|
|
DEBT |
4.491.867,00 |
5.480.337,00 |
5.968.755,00 |
52,63 |
|
|
|
|
|
|
FIXED ASSETS |
6.562.980,00 |
7.611.510,00 |
8.853.004,00 |
78,07 |
|
|
|
|
|
|
TOTAL ASSETS |
9.095.087,00 |
10.468.335,00 |
11.340.430,00 |
|
|
|
|
|
|
|
|
|
|
|
|
|
|
|
|
|
|
|
2006 (12) |
2007 (12) |
2008 (12) |
% SALES |
|
|
|
|
|
|
PROFIT AND LOSS
ACCOUNT ANALYSIS |
|
|
|
|
|
|
|
|
|
|
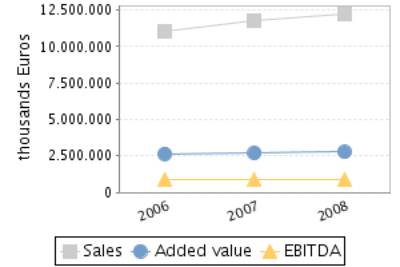
SALES |
11.069.569,00 |
11.767.168,00 |
12.224.277,00 |
|
|
|
|
|
|
|
ADDED VALUE |
2.653.312,00 |
2.700.268,00 |
2.763.123,00 |
22,60 |
|
|
|
|
|
|
EBITDA |
910.271,00 |
860.114,00 |
890.248,00 |
7,28 |
|
|
|
|
|
|
EBIT |
558.811,00 |
512.455,00 |
527.797,00 |
4,32 |
|
|
|
|
|
|
NET RESULT |
428.096,00 |
457.710,00 |
473.121,00 |
3,87 |
|
|
|
|
|
Balance Sheets Items
Analysis


Balance Sheet Comments
Total assets of the company grew 15,10% between 2006 and 2007.
This growth is a consequence of the fixed assets increase of 15,98%.
This growth has been mainly financed with a debt increase of 22,01%.
Nevertheless the net worth increased 8,36%.
Total assets of the company grew 8,33% between 2007 and 2008.
This growth is a consequence of the fixed assets increase of 16,31%.
This growth has been mainly financed with a debt increase of 8,91%.
Nevertheless the net worth increased 7,69%.
Profit and Loss Account Analysis

Profit and Loss Account Comments
The company’s sales figure grew 6,30% between 2006 and 2007.
The company’s EBIT decreased in 8,30% between 2006 and 2007.
This evolution implies a reduction in the company’s operating
profitability.
The result of these variations is a decrease of the company’s Economic
Profitability of 20,33% in the analysed period, being this profitability of
4,90% in the year 2007.
The company’s Net Result grew 6,92% between 2006 and 2007.
This evolution, compared to the EBIT’s performance, implies that the
financial and extraordinary activities have had a positive effect in the
company’s Financial Profitability.
The result of these variations is a reduction of the company’s
profitability of 1,33% in the analysed period, being equal to 9,18% in the year
2007.
The company’s sales figure grew 3,88% between 2007 and 2008.
The company’s EBIT grew 2,99% between 2007 and 2008.
This evolution implies a reduction in the company’s operating
profitability.
The result of these variations is a decrease of the company’s Economic
Profitability of 4,93% in the analysed period, being this profitability of
4,65% in the year 2008.
The company’s Net Result grew 3,37% between 2007 and 2008.
This evolution, compared to the EBIT’s performance, implies that the
financial and extraordinary activities have had a positive effect in the
company’s Financial Profitability.
The result of these variations is a reduction of the company’s
profitability of 4,02% in the analysed period, being equal to 8,81% in the year
2008.
ANNUAL FINANCIAL
REPORT ADDITIONAL DATA
Source: annual financial report 2008
Results Distribution
Figures given in €
|
DISTRIBUTION
BASE |
DISTRIBUTION TO |
||
|
Profit and Loss |
473.120.720,23 |
Retained earnings |
0,00 |
|
Carry Over |
0,00 |
Voluntary Reserve |
379.952.000,23 |
|
Voluntary reserves |
0,00 |
Prior years losses |
0,00 |
|
Reserves |
0,00 |
Carry Over |
0,00 |
|
Other concepts |
0,00 |
Other funds |
15.000.000,00 |
|
Total of Amounts to be distributed |
473.120.720,23 |
Dividends |
78.168.720,00 |
|
|
|
Other Applications |
0,00 |
AUDITING
Auditors’ opinion: FAVOURABLE
Auditor: DELOITTE S.L.
COMPARATIVE SECTOR ANALYSIS
Values table
Figures expressed in %
|
|
COMPANY (2008) |
SECTOR |
DIFFERENCE |
DIFFERENCE RELATIVE |
|
|
|
|
|
|
BALANCE SHEET
ANALYSIS: % on the total assets |
|
|
|
|
|
|
|
|
|
|
OWN FUNDS |
47,37 |
45,92 |
1,45 |
3,16 |
|
|
|
|
|
|
DEBT |
52,63 |
54,08 |
-1,45 |
-2,68 |
|
|
|
|
|
|
FIXED ASSETS |
78,07 |
67,56 |
10,51 |
15,56 |
|
|
|
|
|
|
|
|
|
|
|
|
|
|
|
|
|
|
COMPANY (2008) |
SECTOR |
DIFFERENCE |
DIFFERENCE RELATIVE |
|
|
|
|
|
|
PROFIT AND LOSS
ACCOUNT ANALYSIS: % on the total operating income |
|
|
|
|
|
|
|
|
|
|
SALES |
95,76 |
95,58 |
0,18 |
0,19 |
|
|
|
|
|
|
ADDED VALUE |
21,65 |
16,55 |
5,10 |
30,80 |
|
|
|
|
|
|
EBIT |
4,13 |
3,06 |
1,08 |
35,16 |
|
|
|
|
|
|
NET RESULT |
3,71 |
2,31 |
1,40 |
60,45 |
|
|
|
|
|
Sector Composition
Compared sector (NACE): 521
Number of companies: 115
Size (Sales Figure) : > 7.000.000,00
Euros
Comments on the sectorial comparative
Compared to its sector the assets of the companies show a greater
proportion of fixed assets. Specifically the difference with the sector average
is 10,51% , which means a relative difference of 15,56% .
In liabilities composition the company appeals on a wider scale to self
financing, being the proportion of net worth of 1,45% superior, which means a
relative difference of 3,16% . As a consequence, external financing sources are
less used by the company in 1,45% less than the sector, which means a
difference of 2,68% .
The proportion that the sales mean to the company’s total ordinary
income is 95,76%, 0,18% higher than in the sector, which means a relative
difference of 0,19% .
The company’s EBIT was positive and was 4,13% with regard to the total
ordinary income, 1,08% higher than in the sector, which means a relative
difference of 35,16% .
The company’s capacity to generate operating income is higher than the
one of the sector as its ratio EBIT/Sales is higher (ES Company versus ES
Sector).
The company’s net result was positive and equal to 3,71% with regard to
the total ordinary income, 1,40% higher than in the sector, which means a
relative difference of 60,45% .
The financial and extraordinary results and the tax impact have had a
less negative impact on the Net result in the company than in the sector; as a
consequence, the company shows a better Net Result/EBIT ratio (REBEmpresa vs.
REBSector).
ADDRESSES
Current Legal Seat Address:
STREET HERMOSILLA, 112
28009 MADRID
Previous Seat Address:
STREET PRECIADOS, 3
28013
MADRID
|
STREET |
POSTAL CODE |
TOWN |
PROVINCE |
|
AVENIDA JUAN CARLOS I S-N |
|
ALCALA DE HENARES |
Madrid |
|
CARRETERA EXTREMADURA S-N |
|
ALCORCON |
Madrid |
|
STREET VILLEGAS
Y MARMOLEJO S-N |
|
SEVILLA |
Sevilla |
|
POLIGONO INDUSTRIAL
CARRETERA AMARILLA POLIGONO POLIGONO INDUSTRIAL DE LA |
|
SEVILLA |
Sevilla |
|
AV. DE LOS
ANDES, 50 |
|
MADRID |
Madrid |
|
PL. DE
CALLAO, 2 |
|
MADRID |
Madrid |
|
CENTRO
COMERCIAL SEVILLA ESTE |
41202 |
SEVILLA |
Sevilla |
|
PERIOD DUQUE
DE LA VICTORIA 8 C.C. DUQUE DE LA VICTORIA |
41002 |
SEVILLA |
Sevilla |
|
STREET LUIS
MONTOTO 122 A 128. C.C. NERVION |
41005 |
SEVILLA |
Sevilla |
153 branches registered
CORPORATE STRUCTURE
ADMINISTRATIVE LINKS
Main Board members, Directors and Auditor ![]()
|
POSITION |
SURNAMES AND
NAME |
APPOINTMENT DATE |
|
|
PRESIDENT |
ALVAREZ ALVAREZ ISIDORO |
16/10/2008 |
|
|
VICEPRESIDENT |
CORPORACION CESLAR SL |
25/08/2002 |
|
|
MANAGING DIRECTOR |
GOMEZ PASTRANA MORALES MANUEL |
16/10/2008 |
|
|
MANAGING DIRECTOR |
HERMOSO ARMADA JUAN |
16/10/2008 |
|
|
MANAGING DIRECTOR |
INGONDEL SL |
16/10/2008 |
|
|
MANAGING DIRECTOR |
LASAGA MUNARRIZ FLORENCIO |
16/10/2008 |
|
|
MANAGING DIRECTOR |
MARTINEZ ECHAVARRIA ANSELMO CARLOS |
16/10/2008 |
|
|
MANAGING DIRECTOR |
MARTINEZ INIGUEZ MIGUEL |
16/10/2008 |
|
|
MANAGING DIRECTOR |
DE MINGO CONTRERAS JUAN MANUEL |
16/10/2008 |
|
|
AUDITOR |
APPOINTMENT DATE |
||
|
DELOITTE SL |
20/11/2008 |
||
Functional Managers
|
POSITION |
SURNAMES AND
NAME |
|
Financial Manager |
MARTINEZ ECHEVARRIA CARLOS |
|
Human Resources Manager |
ALCANIZ FOLCH JOSE MARIA |
|
Human Resources Manager |
ARRANZ TOMAS |
|
Purchases Manager |
GONZALEZ FERNANDEZ DAVID |
FINANCIAL LINKS
|
|
BUSINESS NAME |
CIF / COUNTRY |
% |
SOURCE |
DATA INF. |
|
|
ALVAREZ ALVAREZ ISIDORO |
|
15,00 |
ANNUAL REP. |
01/03/1994 |
|
|
INGONDEL S.L. |
B80702079 |
9,00 |
GACETA NEG |
13/05/2008 |
|
|
HERMANOS LUIS Y CELESTINO ARECES |
|
8,00 |
ANNUAL REP. |
01/03/1994 |
|
|
EMPLEADOS EL CORTE INGLES |
|
2,00 |
ANNUAL REP. |
01/03/1994 |
|
|
EL CORTE INGLES S.A. |
A28017895 |
1,62 |
TRADE REG. |
28/02/2007 |
|
|
ARECES FUENTES ROSARIO |
|
0,67 |
GACETA NEG |
09/02/2008 |
|
|
BUSINESS NAME |
CIF / COUNTRY |
% |
SOURCE |
DATA INF. |
|
|
SEGUROS EL CORTE
INGLES VIDA PENSIONES Y REASEGUROS SA |
A79346839 |
100,00 |
ANNUAL FINANCIAL REPORTS |
29/02/2008 |
|
|
INFORMATICA EL
CORTE INGLES SA |
A28855260 |
100,00 |
ANNUAL FINANCIAL REPORTS |
29/02/2008 |
|
|
THE HARRIS
COMPANY INC |
ESTADOS UNIDOS |
100,00 |
ANNUAL FINANCIAL REPORTS |
29/02/2008 |
|
|
CONSTRUCCION
PROMOCIONES E INSTALACIONES S.A. |
A28436483 |
100,00 |
OWN SOURCES |
30/04/2008 |
|
|
HIPERCOR SA |
A28642866 |
100,00 |
ANNUAL FINANCIAL REPORTS |
29/02/2008 |
|
|
TIENDAS DE CONVENIENCIA SA |
A78476389 |
100,00 |
OWN SOURCES |
06/05/2008 |
CREDIT INFORMATION
Constitution Date: 28/06/1940
Business activity 
Activity: Retail sale in Megastores
NACE Code: 5212
NACE Activity: Other retail sale in non-specialized stores
Business: VENTA AL DETALLE DE BIENES DE CONSUMO Y LA
PRESTACION DE SERVICIOS, PARA CUYA REALIZACION CUENTA CON UNA RED DE GRANDES
ALMACENES.
Employees 
Number of total employees:
58.471 (2008)
Number of fixed employees: 100,00%
Number of temporary employees: 0,00%
Employees evolution

SUPPLIERS
|
BUSINESS NAME |
INTERNATIONAL |
|
PARINVER SA |
NO |
|
ASON
INMOBILIARIA DE ARRIENDOS SL |
NO |
|
GESPEVESA SA |
NO |
|
INVESTRONICA SA |
NO |
|
TELECOR SA |
NO |
|
GESTION DE
PUNTOS DE VENTA GESPEVESA SA |
NO |
|
INFORMATICA EL
CORTE INGLES SA |
NO |
|
SUPERCOR SA |
NO |
|
CANAL CLUB DE
DISTRIBUCION DE OCIO Y CULTURA SA |
NO |
|
EDITORIAL CENTRO
DE ESTUDIOS RAMON ARECES SA |
NO |
23 proveedores
CLIENTS
|
BUSINESS NAME |
INTERNATIONAL |
|
GESTION DE
PUNTOS DE VENTA GESPEVESA SA |
NO |
|
EL CORTE
INGLES-GRANDES ARMAZENS SA |
NO |
|
HIPERCOR SA |
NO |
|
TELECOR SA |
NO |
|
PARINVER SA |
NO |
|
GESPEVESA SA |
NO |
|
SUPERCOR SA |
NO |
|
OPTICAS EL CORTE
INGLES SA |
NO |
|
EDITORIAL CENTRO
DE ESTUDIOS RAMON ARECES SA |
NO |
|
TIENDAS DE
CONVENIENCIA SA |
NO |
20 clientes
|
ENTITY |
BRANCH |
ADDRESS |
TOWN OR CITY |
PROVINCE |
|
FINANCIERA EL
CORTE INGLES E.F.C., S.A. |
|
|
|
|
|
BANCO BILBAO
VIZCAYA ARGENTARIA, S.A. |
|
|
|
|
|
BANCO SANTANDER,
S.A. |
|
|
|
|
|
M.P.C.A. RONDA,
CADIZ, ALMERIA, MALAGA Y ANTEQUERA |
|
|
|
|
4 bank entities registered
BRANDS, SIGNS AND COMMERCIAL NAMES ![]()
FORMER NAMES:
•
EL CORTE INGLES SL
Brand name: ECILINE MARKETING INTERACTIVO EL CORTE
INGLES (Valid)
Type: JOINT Date: 19/09/2008
Brand name: HOMINEM (Valid)
Type: JOINT Date: 27/09/2007
Brand name: CANAL TECNIA (Valid)
Type: DENOMINATIVE Date: 31/08/2007
Brand name: MIYO (Valid)
Type: DENOMINATIVE Date: 19/07/2007
Brand name: BOOMERANG (Valid)
Type: JOINT Date: 21/03/2007
LEGAL STRUCTURE
Constitution Data
Register Date: 28/06/1940
Current Legal Form: JOINT STOCK COMPANY
Current Capital:
486.864.000,00 €
Legal Aspects
Obligation to fill in Financial
Statements: YES
Chamber census: YES (2006)
Listed on a Stock Exchange: NO
B.O.R.M.E.(Official Companies Registry Gazette) ![]()
Registered Proceedings
|
PROCEEDINGS |
DATE |
NOTICE NUM. |
TRADE REG. |
|
Re-elections |
20/11/2008 |
532199 |
Madrid |
|
Capital increase |
20/10/2008 |
481792 |
Madrid |
|
Appointments |
17/10/2008 |
479708 |
Madrid |
Other Proceedings published
|
PROCEEDINGS |
DATE |
NOTICE NUM. |
TRADE REG. |
|
Registration of
accounts (2008) Consolidated |
05/12/2008 |
1179124 |
Madrid |
|
Registration of
accounts (2008) Individual |
11/11/2008 |
1074528 |
Madrid |
Press articles

11/12/2008 CINCO DIAS (NEW PRODUCTS AND ACTIVITIES
INFORMATION)
EL CORTE INGLES HA PUESTO EN MARCHA ECOMMERCE STUDIO, UN PROVEEDOR DE
CONSULTORIA DE TECNOLOGIA EN EL QUE HA INVERTIDO 3 MM. DE EUROS Y CUENTA CON UN
CENTENAR DE TRABAJADORES. AMPARADO BAJO SU DIVISION DE INFORMATICA, EL CENTRO
PREVE ALCANZAR EN EL CONJUNTO DEL AÑO UNA FACTURACION DE 4-5 MM. LAS
ESTIMACIONES PARA EL PROXIMO AÑO CONTEMPLAN UN INCREMENTO DEL VOLUMEN DE
NEGOCIO CERCANO AL 30%. ACTUALMENTE, EL 50% DE LOS INGRESOS DE ECOMMERCE STUDIO
PROCEDEN DE EL CORTE INGLES, PERO SU INTENCION ES REDUCIR ESTA DEPENDENCIA DE
LA MATRIZ A TRAVES DE LA INTERNACIONALIZACION. DE HECHO, LA DIVISION DE
COMERCIO ELECTRONICO YA CUENTA CON UNA UNIDAD EN INDIA Y OTRA EN MEXICO.
28/11/2008 ELECONOMISTA (BRANCHES INFORMATION)
EL CORTE INGLES HA DECIDIDO SUSTITUIR TODA LA RED DE SUPERCOR EXPRESS
ABIERTA EN LAS ESTACIONES DE REPSOL POR UNA DE SUS MARCAS CON MAYOR CRECIMIENTO
EN LOS ULTIMOS AÑOS. LAS TIENDAS EN LAS GASOLINERAS SE LLAMARAN A PARTIR DE
AHORA REPSOL OPENCOR. REPSOL Y EL CORTE INGLES FIRMARON UN ACUERDO PARA LA
EXPLOTACION COMERCIAL DE LAS GASOLINERAS BAJO UNA NUEVA SDAD. DENOMINADA GESPEVESA.
EL CAMBIO DE LA ENSEÑA AFECTARA A CERCA DE 40 ESTABLECIMIENTOS. TANTO EL CORTE
INGLES COMO REPSOL SE HAN BENEFICIADO DE ESTA ALIANZA. ESTA DIVISION DE NEGOCIO
HA AUMENTADO SUS INGRESOS DE FORMA EXPONENCIAL, PASANDO DE FACTURAR 679.000
EUROS EN 2006 A LOS 3 MM. DE EUROS DE CAJA DE 2007.
Complementary Information
La Junta General de fecha 12/01/00, acordo
la cesion global de
Activo y Pasivo de INVESGEN SA NIF:A78016342 a su socio unico EL CORTE
INGLES SA NIF:A28017895, segun anuncio publicado en Borme Seccion 2
del 25/01/00.
Segun BORME de fecha 20/3/00, esta sociedad es beneficiaria de la
cesion global de INVESGEN SA A78016342.
Segun BORME de fecha 28/11/00, esta sociedad es beneficiaria de la
cesion global de REINETA SA NIF: A08196255.
La Junta general de fecha 17/12/01, acordo la fusion por absorcion
de MARKS & SPENCER ESPANA SA NIF: A37002516, por parte de EL CORTE
INGLES SA NIF: A28017895, segun anuncio publicado en Borme 2 del 25/02
02.
FINANCIAL INFORMATION
BALANCE SHEET
Assets
Figures given in thousands €
|
|
28/02/2006 (12) |
28/02/2007 (12) |
29/02/2008 (12) |
|
A) DUE FROM SHAREHOLDERS FOR UNCALLED CAPITAL |
|
|
|
|
B) FIXED ASSETS |
6.562.980,00 |
7.611.510,00 |
8.853.004,00 |
|
I. Incorporation costs |
45.149,00 |
46.356,00 |
84.520,00 |
|
II. Intangible fixed assets |
435.681,00 |
418.264,00 |
408.785,00 |
|
R & D expenses |
|
|
|
|
Concessions,
patents, licences , trademarks |
92.436,00 |
96.922,00 |
97.300,00 |
|
Goodwill |
13.965,00 |
13.965,00 |
13.965,00 |
|
Acquired rights from finance leases |
6.841,00 |
6.841,00 |
6.841,00 |
|
Software |
425.123,00 |
451.143,00 |
416.324,00 |
|
Leasing |
94.931,00 |
94.929,00 |
93.350,00 |
|
Cash advance |
|
|
|
|
Provisions |
|
|
|
|
Depreciation |
-197.615,00 |
-245.536,00 |
-218.995,00 |
|
III. Tangible fixed assets |
4.406.894,00 |
4.897.915,00 |
5.580.570,00 |
|
Property, plant and equipment |
2.701.244,00 |
2.951.455,00 |
3.373.156,00 |
|
Machinery, equipment and other |
265.720,00 |
279.085,00 |
2.789.831,00 |
|
Other property plant and equipment |
2.740.726,00 |
3.037.584,00 |
901.684,00 |
|
Prepaid expenses on fixed assets |
79.020,00 |
197.463,00 |
291.410,00 |
|
Other assets |
331.227,00 |
359.476,00 |
393.064,00 |
|
Provisions |
|
|
|
|
Depreciation |
-1.711.043,00 |
-1.927.148,00 |
-2.168.575,00 |
|
IV. Financial fixed assets |
1.670.169,00 |
2.242.736,00 |
2.775.896,00 |
|
Shares in affiliated companies |
1.561.070,00 |
2.115.265,00 |
2.640.116,00 |
|
Receivables in affiliated companies |
37.050,00 |
45.675,00 |
|
|
Shares in associated companies |
14.034,00 |
14.034,00 |
21.534,00 |
|
Loans to associated companies |
1.100,00 |
3.300,00 |
2.600,00 |
|
Securities |
90.490,00 |
90.382,00 |
90.383,00 |
|
Other loans |
|
|
53.927,00 |
|
Long term deposits and guarantees |
6.090,00 |
7.799,00 |
7.399,00 |
|
Provisions |
-41.873,00 |
-35.308,00 |
-41.421,00 |
|
Taxes receivable |
2.208,00 |
1.589,00 |
1.358,00 |
|
V.Owners equity |
|
|
|
|
VI.Long term trade liabilities |
5.087,00 |
6.239,00 |
3.233,00 |
|
C) DEFERRED EXPENSES |
9.667,00 |
10.915,00 |
9.188,00 |
|
D) CURRENT ASSETS |
2.522.440,00 |
2.845.910,00 |
2.478.238,00 |
|
I. Shareholders by required outlays |
|
|
|
|
II. Stocks |
1.705.623,00 |
1.824.144,00 |
1.780.616,00 |
|
Goods available for sale |
1.729.469,00 |
1.834.921,00 |
1.791.285,00 |
|
Raw material inventory |
11.182,00 |
10.207,00 |
10.987,00 |
|
Work in Progress |
|
|
|
|
Finished goods |
|
|
|
|
Subproducts and recycled materials |
|
|
|
|
Cash advance |
|
|
|
|
Provisions |
-35.028,00 |
-20.984,00 |
-21.656,00 |
|
III. Debtors |
681.569,00 |
872.262,00 |
556.256,00 |
|
Clients |
273.935,00 |
267.169,00 |
272.633,00 |
|
Amounts owned by affiliated companies |
365.148,00 |
487.391,00 |
174.917,00 |
|
Amounts owned by associated companies |
|
6.627,00 |
|
|
Other debts |
89.175,00 |
123.599,00 |
152.274,00 |
|
Staff Expenses |
|
|
|
|
Government |
15.068,00 |
39.424,00 |
|
|
Provisions |
-61.757,00 |
-51.948,00 |
-43.568,00 |
|
IV. Temporary financial investment |
313,00 |
2.220,00 |
|
|
Shares in affiliated companies |
|
|
|
|
Receivables in affiliated companies |
|
|
|
|
Shares in associated companies |
|
|
|
|
Loans to associated companies |
|
|
|
|
Short term investment |
|
|
|
|
Other loans |
37,00 |
1.800,00 |
|
|
Short Term Deposit and guarantees |
276,00 |
420,00 |
|
|
Provisions |
|
|
|
|
V. Short-term own shares |
55.580,00 |
72.546,00 |
72.528,00 |
|
VI. Treasury |
58.723,00 |
55.663,00 |
48.784,00 |
|
VII. Periodification adjustments |
20.632,00 |
19.075,00 |
20.054,00 |
|
ASSETS (A + B + C + D) |
9.095.087,00 |
10.468.335,00 |
11.340.430,00 |
Assets composition


Liabilities
Figures given in thousands €
|
|
28/02/2006 (12) |
28/02/2007 (12) |
29/02/2008 (12) |
|
A) SHAREHOLDERS EQUITY |
4.603.220,00 |
4.987.998,00 |
5.371.675,00 |
|
I. Share capital |
446.292,00 |
459.816,00 |
473.340,00 |
|
II. Issue bonus |
|
|
|
|
III.Revaluation reserve |
180.330,00 |
166.806,00 |
153.282,00 |
|
IV.Reserves |
3.548.502,00 |
3.903.666,00 |
4.271.932,00 |
|
Retained earnings |
89.258,00 |
91.963,00 |
94.668,00 |
|
Sinking fund from owner equity |
55.580,00 |
72.546,00 |
72.528,00 |
|
Reserve for the parent company capital |
|
|
|
|
Statutory reserve |
|
|
|
|
Other funds |
3.403.664,00 |
3.739.157,00 |
4.104.736,00 |
|
Capital adjustments in Euros |
|
|
|
|
V.Results from previous years |
|
|
|
|
Carry Over |
|
|
|
|
Prior years losses |
|
|
|
|
Loans from partners for losses compensation |
|
|
|
|
VI.Profit and Losses |
428.096,00 |
457.710,00 |
473.121,00 |
|
VII.Dividend paid during the year |
|
|
|
|
VIII.Own shares for capital reduction |
|
|
|
|
B) DEFERRED INCOME |
|
|
|
|
Capital grants |
|
|
|
|
Positive change difference |
|
|
|
|
Other deferred income |
|
|
|
|
Fiscal deferred income |
|
|
|
|
C) PROVISIONS FOR LIABILITIES AND EXPENSES |
1.669,00 |
10.061,00 |
7.616,00 |
|
Provision for pensions plans |
|
|
|
|
Provision for taxes |
|
|
|
|
Other provisions |
1.669,00 |
10.061,00 |
7.616,00 |
|
Reversion fund |
|
|
|
|
D) LONG TERM LIABILITIES |
1.177.503,00 |
1.734.585,00 |
1.578.929,00 |
|
I.Negotiable
bonds and other negotiable values |
|
|
|
|
Non convertible securities |
|
|
|
|
Convertible securities |
|
|
|
|
Other convertible debentures |
|
|
|
|
II.Debt with bank entities |
138.877,00 |
733.322,00 |
565.211,00 |
|
Long term bank loans |
68.106,00 |
668.857,00 |
510.618,00 |
|
Leasing |
70.771,00 |
64.465,00 |
54.593,00 |
|
III.Debts with associated and affiliated
companies |
424,00 |
591,00 |
|
|
With affiliated companies |
424,00 |
591,00 |
|
|
Associated companies |
|
|
|
|
IV. Other creditors |
933.165,00 |
1.000.635,00 |
1.013.718,00 |
|
Bills payable |
|
|
|
|
Other debts |
892.450,00 |
966.298,00 |
981.451,00 |
|
Long term deposit and guaranties |
83,00 |
84,00 |
|
|
Taxes receivable |
40.632,00 |
34.253,00 |
32.267,00 |
|
V. Deferred debts on shares |
105.037,00 |
37,00 |
|
|
From affiliated companies |
104.999,00 |
|
|
|
From associated companies |
38,00 |
37,00 |
|
|
Other companies |
|
|
|
|
VI. Long term debt with creditor |
|
|
|
|
E) SHORT TERM LIABILITIES |
3.312.695,00 |
3.735.691,00 |
4.382.210,00 |
|
I.Negotiable bonds and other negotiable values |
|
|
|
|
Non convertible securities |
|
|
|
|
Convertible securities |
|
|
|
|
Other convertible debentures |
|
|
|
|
Interests from bonds |
|
|
|
|
II.Debt with bank entities |
207.099,00 |
145.729,00 |
338.784,00 |
|
Loans and other debts |
207.099,00 |
145.729,00 |
338.784,00 |
|
Debt interest |
|
|
|
|
Leasing |
|
|
|
|
III. Short term debts with associated and
affiliated companies |
469.087,00 |
841.773,00 |
1.000.842,00 |
|
With affiliated companies |
466.354,00 |
838.635,00 |
1.000.842,00 |
|
Associated companies |
2.733,00 |
3.138,00 |
|
|
IV. Commercial creditors |
1.864.593,00 |
1.981.471,00 |
2.050.446,00 |
|
Accounts payable |
|
|
|
|
Expenses |
697.594,00 |
743.810,00 |
836.883,00 |
|
Bills payable |
1.166.999,00 |
1.237.661,00 |
1.213.563,00 |
|
V. Other non-commercial debt |
767.617,00 |
763.530,00 |
988.919,00 |
|
Government |
93.535,00 |
61.900,00 |
74.863,00 |
|
Bills payable |
166.104,00 |
138.585,00 |
249.546,00 |
|
Other debts |
196.111,00 |
245.956,00 |
345.064,00 |
|
Accounts receivable |
311.867,00 |
317.089,00 |
319.446,00 |
|
Short term deposits and guarantees |
|
|
|
|
VI. Provisions for current assets |
2.233,00 |
2.182,00 |
2.453,00 |
|
VII. Periodification adjustments |
2.066,00 |
1.006,00 |
766,00 |
|
F) SHORT TERM PROVISIONS FOR LIABILITIES AND
EXPENSES |
|
|
|
|
LIABILITIES (A + B + C + D + E + F) |
9.095.087,00 |
10.468.335,00 |
11.340.430,00 |
Liabilities
Composition


PROFIT AND LOSS ACCOUNT
Itams of the Profit and Loss Account
Figures given in thousands €
|
|
28/02/2006 (12) |
28/02/2007 (12) |
29/02/2008 (12) |
|
A) EXPENSES (A.1 a A.16) |
11.279.708,00 |
11.960.217,00 |
12.496.004,00 |
|
A.1.Reduction in stocks of finished goods and
work in progress |
|
|
|
|
A.2.Supplies |
8.034.731,00 |
8.525.271,00 |
8.896.196,00 |
|
Material consumed |
7.966.430,00 |
8.351.688,00 |
8.719.217,00 |
|
Raw materials consumed |
68.301,00 |
72.775,00 |
73.905,00 |
|
Other expenses |
|
100.808,00 |
103.074,00 |
|
A.3. Labour cost |
1.743.041,00 |
1.840.154,00 |
1.872.875,00 |
|
Wages |
1.369.732,00 |
1.445.310,00 |
1.464.872,00 |
|
Social security expenses |
373.309,00 |
394.844,00 |
408.003,00 |
|
A.4. Assets depreciation |
319.499,00 |
332.295,00 |
339.810,00 |
|
A.5.Variance in the traffic provisions |
31.961,00 |
15.364,00 |
22.641,00 |
|
Variance in provision for inventory |
-1.482,00 |
-14.045,00 |
|
|
Variance in provision for bad debts |
2.593,00 |
-5.106,00 |
-3.082,00 |
|
Variance in provision for other current assets |
30.850,00 |
34.515,00 |
25.723,00 |
|
A.6. Other operating costs |
915.080,00 |
1.051.056,00 |
1.106.026,00 |
|
External costs |
879.394,00 |
887.698,00 |
939.724,00 |
|
Taxes |
35.686,00 |
39.741,00 |
43.208,00 |
|
Other day to day expenses |
|
123.617,00 |
123.094,00 |
|
Allowance to reversion fund |
|
|
|
|
A.I.OPERATING
RESULT (B.1+B.2+B.3+B.4-A.1-A.2-A.3-A.4-A.5-A.6) |
558.811,00 |
512.455,00 |
527.797,00 |
|
A.7.Financial expenses and similar |
72.204,00 |
93.955,00 |
139.271,00 |
|
Debts with related companies |
|
19.786,00 |
28.908,00 |
|
Debts with associated companies |
|
|
|
|
Other companies debts By debts with third parties and similar expenses |
72.204,00 |
74.169,00 |
110.363,00 |
|
Losses from financial investments |
|
|
|
|
A.8. Variation in financial investment provision |
5.654,00 |
-12.617,00 |
500,00 |
|
A.9.Negative
exchange difference |
|
|
|
|
A.II.POSITIVE
FINANCIAL RESULTS (B.5+B.6+B.7+B.8-A.7-A.8-A.9) |
|
23.603,00 |
20.597,00 |
|
A.III.PROFIT
FROM ORDINARY ACTIVITIES (A.I+A.II-B.I-B.II) |
552.040,00 |
536.058,00 |
548.394,00 |
|
A.10. Variation
in provision in fixed assets |
|
6.052,00 |
5.613,00 |
|
A.11. Losses in
fixed assets |
|
|
|
|
A.12. Losses
from own shares and bonds |
|
|
|
|
A.13.
Extraordinary charges |
10.046,00 |
11.460,00 |
14.155,00 |
|
A.14.Other
exercises’ expenses and losses |
|
|
|
|
A.IV.POSITIVE
EXTRAORDINARY RESULT (B.9+B.10+B.11+B.12+B.13-A.10-A.11-A.12-A.13-A.14) |
23.548,00 |
18.879,00 |
23.644,00 |
|
A.V.PROFIT
BEFORE TAXES (A.III+A.IV-B.III-B.IV) |
575.588,00 |
554.937,00 |
572.038,00 |
|
A.15.Corporate
Taxes |
147.492,00 |
97.227,00 |
98.917,00 |
|
A.16. Other
taxes |
|
|
|
|
A.VI.EXERCISE
RESULT (PROFIT) (A.V-A.14-A.15) |
428.096,00 |
457.710,00 |
473.121,00 |
|
B) INCOMES (B.1 a B13) |
11.707.804,00 |
12.417.927,00 |
12.969.125,00 |
|
B.1. Turnover |
11.069.569,00 |
11.767.168,00 |
12.224.277,00 |
|
Sales |
11.583.101,00 |
12.321.789,00 |
11.946.102,00 |
|
Services provided |
248.017,00 |
281.962,00 |
278.175,00 |
|
Refunds and sale reminders |
-761.549,00 |
-836.583,00 |
|
|
B.2.Increase in inventory of finished goods and
works in progress |
|
|
|
|
B.3.Expenses capitalized |
136.946,00 |
132.970,00 |
153.632,00 |
|
B.4. Other operating income |
396.608,00 |
376.457,00 |
387.436,00 |
|
Other incomes |
390.512,00 |
371.320,00 |
387.436,00 |
|
Grants |
5.954,00 |
4.855,00 |
|
|
Excess in provision for liabilities and charges |
142,00 |
282,00 |
|
|
B.I.OPERATING
LOSSES (A.1+A.2+A.3+A.4+A.5+A.6-B.1-B.2-B.3-B.4) |
|
|
|
|
B.5.Incomes from share participations |
65.823,00 |
102.872,00 |
156.844,00 |
|
From affiliated companies |
65.823,00 |
102.872,00 |
156.844,00 |
|
From associated companies |
|
|
|
|
From other companies |
|
|
|
|
B.6.Income from other securities and credits to
fixed assets |
31,00 |
340,00 |
939,00 |
|
From affiliated companies |
31,00 |
|
939,00 |
|
From associated companies |
|
|
|
|
Other companies |
|
340,00 |
|
|
B.7.Other interests and similar |
5.148,00 |
1.729,00 |
2.585,00 |
|
From affiliated companies |
|
112,00 |
27,00 |
|
From associated companies |
|
|
2.558,00 |
|
Other Interests |
5.148,00 |
1.617,00 |
|
|
Profits from investments |
|
|
|
|
B.8. Positive change difference |
85,00 |
|
|
|
B.II. NEGATIVE FINANCIAL RESULTS
(A.7+A.8+A.9-B.5-B.6-B.7-B.8) |
6.771,00 |
|
|
|
B.III.LOSSES FROM ORDINARY ACTIVITIES
(B.I+B.II-A.I-A.II) |
|
|
|
|
B.9.B.9. Gains from disposal of fixed assets |
7.438,00 |
13.724,00 |
34.290,00 |
|
B.10.Gains from dealing in own shares |
|
|
|
|
B.11. Paid in surplus |
|
|
|
|
B.12. Extraordinary income |
26.156,00 |
22.667,00 |
9.122,00 |
|
B.13.Other year’s income and profits |
|
|
|
|
B.IV.NEGATIVE EXTRAORDINARY LOSSES
(A.10+A.11+A.12+A.13+A.14-B.9-B.10-B.11-B.12-B.13) |
|
|
|
|
B.V.LOSS BEFORE TAXES (B.III+B.IV-A.III-A.IV) |
|
|
|
|
B.VI.EXERCISE RESULTS (LOSS) (B.V+A.14+A.15) |
|
|
|
Composition of the
Profit and Loss Account


FINANCIAL BALANCE
Here the Main Capital Amounts of the company and the Revolving Fund
Evolution are analysed.
Financial Balance Table
Figures given in thousands €
|
|
28/02/2006 (12) |
% |
28/02/2007 (12) |
% |
29/02/2008 (12) |
% |
|
A) DUE FROM
SHAREHOLDERS FOR UNCALLED CAPITAL |
|
|
|
|
|
|
|
B) FIXED ASSETS |
6.562.980,00 |
72,16 |
7.611.510,00 |
72,71 |
8.853.004,00 |
78,07 |
|
C) DEFERRED
EXPENSES |
9.667,00 |
0,11 |
10.915,00 |
0,10 |
9.188,00 |
0,08 |
|
D) CURRENT
ASSETS |
2.522.440,00 |
27,73 |
2.845.910,00 |
27,19 |
2.478.238,00 |
21,85 |
|
ASSETS (A + B +
C + D) |
9.095.087,00 |
|
10.468.335,00 |
|
11.340.430,00 |
|
|
|
||||||
|
A) SHAREHOLDERS
EQUITY |
4.603.220,00 |
50,61 |
4.987.998,00 |
47,65 |
5.371.675,00 |
47,37 |
|
B) DEFERRED
INCOME |
|
|
|
|
|
|
|
C) PROVISIONS
FOR LIABILITIES AND EXPENSES |
1.669,00 |
0,02 |
10.061,00 |
0,10 |
7.616,00 |
0,07 |
|
D) LONG TERM
LIABILITIES |
1.177.503,00 |
12,95 |
1.734.585,00 |
16,57 |
1.578.929,00 |
13,92 |
|
E) SHORT TERM
LIABILITIES |
3.312.695,00 |
36,42 |
3.735.691,00 |
35,69 |
4.382.210,00 |
38,64 |
|
F) SHORT TERM
PROVISIONS FOR LIABILITIES AND EXPENSES |
|
|
|
|
|
|
|
LIABILITIES (A +
B + C + D + E + F) |
9.095.087,00 |
|
10.468.335,00 |
|
11.340.430,00 |
|
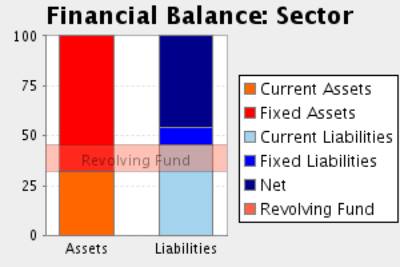
Financial Balance
Composition


Comments on Financial Balance
In the 2006, the assets of the company were formed in 72,27% of Fixed
Assets and in 27,73% of Current Assets.This assets were financed in 50,61% with
own capitals, and in 12,96% with long term debt and in 36,42% with current
liabilities.
The result of this financial structure is a negative turnover fund of
-790.255,00 thousands Euros, which is equivalent to -8,69% proportion of
the company’s total assets.
In the 2007, the assets of the company were formed in 72,81% of Fixed
Assets and in 27,19% of Current Assets.This assets were financed in 47,65% with
own capitals, and in 16,67% with long term debt and in 35,69% with current
liabilities.
The result of this financial structure is a negative turnover fund of
-889.781,00 thousands Euros, which is equivalent to -8,50% proportion of
the company’s total assets.
This measure has diminished with respect to the previous exercise in
12,59% having, however, increased its proportion with respect to the total
assets of the company.
In the 2008, the assets of the company were formed in 78,15% of Fixed
Assets and in 21,85% of Current Assets.This assets were financed in 47,37% with
own capitals, and in 13,99% with long term debt and in 38,64% with current
liabilities.
The result of this financial structure is a negative turnover fund of
-1.903.972,00 thousands Euros, which is equivalent to -16,79% proportion
of the company’s total assets.
This measure has diminished with respect to the previous exercise in
113,98% having also diminished its proportion with respect to the total assets
of the company.
RATIOS
Main Ratios
|
|
28/02/2006 (12) |
28/02/2007 (12) |
29/02/2008 (12) |
|
STRUCTURAL RATIOS |
|
|
|
|
Management fund |
-790.255,00 |
-889.781,00 |
-1.903.972,00 |
|
Management Fund Requirement |
-697.772,00 |
-874.481,00 |
-1.686.500,00 |
|
Indebtedness (%) |
49,39 |
52,35 |
52,63 |
|
External Funds on Net Worth |
0,98 |
1,10 |
1,11 |
|
GENERAL ACTIVITY RATIO |
|
|
|
|
Turnover Increase (%) |
8,55 |
6,30 |
|
|
Added value growth (%) |
8,59 |
1,77 |
|
|
Cash Flow |
785.210,00 |
798.804,00 |
841.685,00 |
|
Labour Productivity |
1,52 |
1,47 |
1,48 |
|
Assets turnover |
1,22 |
1,12 |
1,08 |
|
Breakdown Point |
9.786.071,29 |
10.599.533,12 |
11.024.003,22 |
|
Security Margin of the Breakdown Point (%) |
15,66 |
13,66 |
13,64 |
|
ACTIVITY RATIOS |
|
|
|
|
Average Payment Period |
84 |
84 |
83 |
|
Average Collection Period |
22 |
27 |
16 |
|
Inventory Turnover Period |
55 |
56 |
52 |
|
SOLVENCY RATIOS |
|
|
|
|
Payback Capacity |
0,18 |
0,15 |
0,14 |
|
Assets Guarantee |
2,01 |
1,90 |
1,88 |
|
Short Term Debts Proportion (%) |
73,75 |
68,16 |
73,42 |
|
Interest Coverage |
9,35 |
7,07 |
4,54 |
|
LIQUIDITY RATIOS |
|
|
|
|
Current Ratio |
0,76 |
0,76 |
0,57 |
|
Immediate liquidity |
0,02 |
0,02 |
0,01 |
|
Treasury |
-148.063,00 |
-87.846,00 |
-290.000,00 |
|
Sales on Current Assets |
1.580 |
1.489 |
1.776 |
Results Analysis
Ratios
|
|
28/02/2006 (12) |
28/02/2007 (12) |
29/02/2008 (12) |
|
Economic profitability (%) |
6,14 |
4,90 |
4,65 |
|
Operating Profitability (%) |
5,05 |
4,36 |
4,32 |
|
Equity gearing |
1,95 |
2,20 |
2,19 |
|
Financial profitability (%) |
9,30 |
9,18 |
8,81 |
|
General Profitability (%) |
3,87 |
3,89 |
3,87 |
Comments on the
Results Analysis Ratios
The economic profitability in the year2007 achieved a 4,90% positive
level, due to a 4,36% economic margin and to an assets turnover of1,12%.
The economic profitability in the year has reduced from 6,14% up to
4,90% of2007, even if it remains positive. This fall is due to the decrease in
operating profitability, that has passe from 5,05% to 4,36%, as assets turnover
whose index has passed from 1,22 to 1,12%.
Financial profitability on 2007 achieved a 9,18%.
The company’s financial structure has instigated its economic
profitability with an indebtedness level of 2,20.
The general profitability on 2007 achieved a 3,89%.
The economic profitability in the year2008 achieved a 4,65% positive
level, due to a 4,32% economic margin and to an assets turnover of1,08%.
The economic profitability in the year has reduced from 4,90% up to
4,65% of2008, even if it remains positive. This fall is due to the decrease in
operating profitability, that has passe from 4,36% to 4,32%, as assets turnover
whose index has passed from 1,12 to 1,08%.
Financial profitability on 2008 achieved a 8,81%.
The company’s financial structure has instigated its economic
profitability with an indebtedness level of 2,19.
The general profitability on 2008 achieved a 3,87%.
SECTORIAL ANÁLYSIS
Large Capital Amounts and Financial Balance
Figures given in %
|
|
COMPANY (2008) |
SECTOR |
DIFFERENCE |
DIFFERENCE RELATIVE |
|
|
|
|
|
|
ASSETS |
|
|
|
|
|
|
|
|
|
|
A) DUE FROM
SHAREHOLDERS FOR UNCALLED CAPITAL |
|
0,00 |
|
|
|
|
|
|
|
|
B) FIXED ASSETS |
78,07 |
67,56 |
10,51 |
15,57 |
|
|
|
|
|
|
C) DEFERRED
EXPENSES |
0,08 |
0,27 |
-0,19 |
-70,59 |
|
|
|
|
|
|
D) CURRENT
ASSETS |
21,85 |
32,17 |
-10,32 |
-32,09 |
|
|
|
|
|
|
ASSETS (A + B +
C + D) |
100 |
100 |
|
|
|
|
|
|
|
|
|
|
|
|
|
|
|
|
|
|
|
|
COMPANY (2008) |
SECTOR |
DIFFERENCE |
DIFFERENCE RELATIVE |
|
|
|
|
|
|
LIABILITIES |
|
|
|
|
|
|
|
|
|
|
A) SHAREHOLDERS
EQUITY |
47,37 |
45,85 |
1,52 |
3,31 |
|
|
|
|
|
|
B) DEFERRED
INCOME |
|
0,06 |
|
|
|
|
|
|
|
|
C) PROVISIONS
FOR LIABILITIES AND EXPENSES |
0,07 |
0,59 |
-0,52 |
-88,12 |
|
|
|
|
|
|
D) LONG TERM
LIABILITIES |
13,92 |
8,00 |
5,92 |
74,09 |
|
|
|
|
|
|
E) SHORT TERM
LIABILITIES |
38,64 |
45,50 |
-6,85 |
-15,07 |
|
|
|
|
|
|
F) SHORT TERM
PROVISIONS FOR LIABILITIES AND EXPENSES |
|
0,00 |
|
|
|
|
|
|
|
|
LIABILITIES (A + B + C + D + E + F) |
100 |
100 |
|
|
|
|
|
|
|
Sectorial Financial
Balance Comparison

Comments to the Sectorial Analysis
In the 2008, the assets of the company were formed in 78,15% of fixed
assets and in 21,85Current Assets % In the sector, the proportion of fixed
assets was of 67,83%, 15,22% inferior, and the proportion of current assets was
of 32,17%, 32,09% superior.
The assets were financed in the company in 47,37% with own capitals , in
13,99% with fixed liabilities and in 38,64% with current liabilities In the
sector, the self financing represented 45,92%, 3,16% inferior. On the other
hand the long term debts represented in the sector an average of 8,58%
financing, with a relative difference of 62,96% in favour of the companyAnd,
short term liabilities represented in the sector an average of 45,50% financing,
with a relative difference of 15,07% favourable to the sector
The result of this company’s financial structure is a turnover fund that
represents -16,79% of the total assets; in the sector, this same proportion is
-13,32%, therefore, we can say that the company’s turnover fund is 26,00%
smaller than the sector one.
Analytical Account of Results
Figures given in %
|
|
COMPANY (2008) |
SECTOR |
DIFFERENCE |
DIFFERENCE RELATIVE |
|
Turnover |
95,76 |
95,58 |
0,18 |
0,19 |
|
Other operating income |
4,24 |
4,42 |
-0,18 |
-4,14 |
|
Production Value |
100,00 |
100,00 |
0,00 |
0,00 |
|
Operating expenses |
69,69 |
73,64 |
-3,95 |
-5,36 |
|
Other operation expenses |
8,66 |
9,81 |
-1,15 |
-11,76 |
|
Added value |
21,65 |
16,55 |
5,10 |
30,82 |
|
Labour cost |
14,67 |
10,69 |
3,98 |
37,28 |
|
Gross Economic Result |
6,97 |
5,86 |
1,11 |
18,86 |
|
Assets depreciation |
2,66 |
2,78 |
-0,12 |
-4,35 |
|
Variation in provision for current assets and bad debt losses |
0,18 |
0,02 |
0,16 |
682,61 |
|
Net Economic Result |
4,13 |
3,06 |
1,07 |
35,01 |
|
Financial income |
1,26 |
0,47 |
0,79 |
168,09 |
|
Financial Charges |
1,09 |
0,47 |
0,62 |
132,41 |
|
Variation in financial investment provision |
0,00 |
0,04 |
-0,04 |
-100,00 |
|
Ordinary
Activities Result |
4,30 |
3,02 |
1,28 |
42,20 |
|
Extraordinary income |
0,34 |
0,78 |
-0,44 |
-56,63 |
|
Extraordinary charges |
0,11 |
0,28 |
-0,17 |
-61,27 |
|
Variation in provision in fixed assets |
0,04 |
0,16 |
-0,12 |
-74,68 |
|
Results before Taxes |
4,48 |
3,37 |
1,11 |
33,10 |
|
Corporate taxes |
0,77 |
1,06 |
-0,29 |
-27,08 |
|
Net Result |
3,71 |
2,31 |
1,40 |
60,61 |
|
Assets depreciation |
2,66 |
2,78 |
-0,12 |
-4,35 |
|
Change of Provisions |
0,23 |
0,22 |
0,01 |
5,99 |
|
Net Self-Financing |
6,59 |
5,31 |
1,28 |
24,18 |
Main Ratios
|
|
COMPANY (2008) |
PTILE25 |
PTILE50 |
PTILE75 |
|
STRUCTURAL RATIOS |
|
|
|
|
|
Management fund |
-1.903.972,00 |
-4.718,75 |
-135,92 |
1.215,37 |
|
Management Fund
Requirement |
-1.686.500,00 |
-10.540,72 |
-1.728,64 |
-423,34 |
|
Indebtedness (%) |
52,63 |
42,05 |
65,10 |
77,90 |
|
External Funds
on Net Worth |
1,11 |
0,73 |
1,87 |
3,52 |
|
GENERAL ACTIVITY
RATIO |
|
|
|
|
|
Cash Flow |
841.685,00 |
378,43 |
947,28 |
3.436,81 |
|
Labour Productivity |
1,48 |
1,20 |
1,34 |
1,64 |
|
Assets turnover |
1,08 |
1,66 |
2,45 |
3,41 |
|
Breakdown Point |
11.024.003,22 |
9.838.734,58 |
22.837.586,25 |
66.240.991,20 |
|
Security Margin
of the Breakdown Point (%) |
13,64 |
2,94 |
8,56 |
18,18 |
|
ACTIVITY RATIOS |
|
|
|
|
|
Average Payment Period |
83 |
17 |
55 |
89 |
|
Average Collection Period |
16 |
3 |
14 |
30 |
|
Inventory Turnover Period |
52 |
13 |
26 |
39 |
|
SOLVENCY RATIOS |
|
|
|
|
|
Payback Capacity |
0,14 |
0,08 |
0,13 |
0,27 |
|
Assets Guarantee |
1,88 |
1,26 |
1,52 |
2,38 |
|
Short Term Debts Proportion (%) |
73,42 |
76,72 |
92,36 |
99,96 |
|
Interest Coverage |
4,54 |
4,82 |
15,45 |
53,69 |
|
LIQUIDITY RATIOS |
|
|
|
|
|
Current Ratio |
0,57 |
0,63 |
0,91 |
1,55 |
|
Immediate liquidity |
0,01 |
0,06 |
0,17 |
0,50 |
|
Treasury |
-290.000,00 |
-103,03 |
490,87 |
3.294,40 |
|
Sales on Current Assets |
1.776 |
1.243 |
1.866 |
2.697 |
Results Analysis
Ratios
|
|
COMPANY (2008) |
PTILE25 |
PTILE50 |
PTILE75 |
|
Economic profitability (%) |
4,65 |
1,80 |
4,73 |
9,32 |
|
Operating Profitability (%) |
4,32 |
0,64 |
1,78 |
4,48 |
|
Equity gearing |
2,19 |
1,55 |
2,35 |
4,01 |
|
Financial profitability (%) |
8,81 |
4,48 |
11,05 |
19,42 |
|
General Profitability (%) |
3,87 |
0,44 |
1,30 |
3,60 |
FOREIGN EXCHANGE
RATES
|
Currency |
Unit
|
Indian Rupees |
|
US Dollar |
1 |
Rs.47.94 |
|
UK Pound |
1 |
Rs.72.07 |
|
Euro |
1 |
Rs.64.70 |
RATING
EXPLANATIONS
|
RATING |
STATUS |
PROPOSED CREDIT LINE |
|
|
>86 |
Aaa |
Possesses an extremely sound financial base with the strongest
capability for timely payment of interest and principal sums |
Unlimited |
|
71-85 |
Aa |
Possesses adequate working capital. No caution needed for credit
transaction. It has above average (strong) capability for payment of interest
and principal sums |
Large |
|
56-70 |
A |
Financial & operational base are regarded healthy. General
unfavourable factors will not cause fatal effect. Satisfactory capability for
payment of interest and principal sums |
Fairly Large |
|
41-55 |
Ba |
Overall operation is considered normal. Capable to meet normal
commitments. |
Satisfactory |
|
26-40 |
B |
Unfavourable & favourable factors carry similar weight in credit consideration.
Capability to overcome financial difficulties seems comparatively below
average. |
Small |
|
11-25 |
Ca |
Adverse factors are apparent. Repayment of interest and principal sums
in default or expected to be in default upon maturity |
Limited with
full security |
|
<10 |
C |
Absolute credit risk exists. Caution needed to be exercised |
Credit not
recommended |
|
NR |
In view of the lack of information, we have no basis upon which to
recommend credit dealings |
No Rating |
|
This score serves as a reference to assess SC’s credit risk
and to set the amount of credit to be extended. It is calculated from a
composite of weighted scores obtained from each of the major sections of this
report. The assessed factors and their relative weights (as indicated through
%) are as follows:
Financial
condition (40%) Ownership
background (20%) Payment
record (10%)
Credit history
(10%) Market trend
(10%) Operational
size (10%)