![]()
MIRA
INFORM REPORT
|
Report Date : |
13.12.2008 |
IDENTIFICATION
DETAILS
|
Name : |
EUROPEA DE CINTAS SL ”EUROCINSA” |
|
|
|
|
Registered Office : |
|
|
|
|
|
Country : |
Spain |
|
|
|
|
Financials (as on) : |
31.12.2007 |
|
|
|
|
Date of Incorporation : |
|
|
|
|
|
Legal Form : |
Limited Liability Company |
|
|
|
|
Line of Business : |
RATING &
COMMENTS
|
MIRA’s Rating : |
A |
|
RATING |
STATUS |
PROPOSED CREDIT LINE |
|
|
56-70 |
A |
Financial & operational base are regarded healthy. General
unfavourable factors will not cause fatal effect. Satisfactory capability for
payment of interest and principal sums |
Fairly Large |
|
Maximum Credit Limit : |
300.001,20 € |
|
|
|
|
Status : |
Good |
|
|
|
|
Payment Behaviour : |
Regular |
|
|
|
|
Litigation : |
Clear |
FINANCIAL
REPORT
EUROPEA DE CINTAS SL ”EUROCINSA”
TAX NUMBER: B48179907
EXECUTIVE SUMMARY
Identification
Current Business Name: EUROPEA DE CINTAS
SL
Commercial Name: EUROCINSA
Commercial Name: EUROCINSA
Other names: YES
Current Address: CAMINO SANGRONIZ, 32, CP 48150, SONDIKA VIZCAYA
Telephone number: 944711177 Fax: 944711134
URL: www.eurocinsa.es Corporate
e-mail: info@eurocinsa.es
Commercial Risk
Credit Appraisal: 300.001,20 €
RAI: NO
Legal Actions: NO
Financial
Information
Latest Balance sheet sales (2007): 5.955.287,90 € (MERCANTILE REGISTER)
Result: 59.988,3 €
Total Assets: 3.777.809,82 €
Social Capital: 12.020,24 €
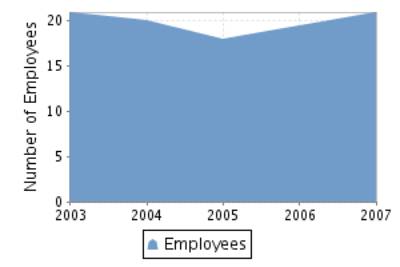
Employees: 21
Commercial Information
Constitution Date: 04/12/1985
Business activity: Wholesale of
other products
NACE Code: 5147
International Operations: Imports and
Exports
Corporate Structure
Sole Administrator:
Parent Company:
Other Complementary Information
Latest proceeding published in BORME: 04/09/2008 Registration
of accounts
Bank Entities: Yes
COMMERCIAL RISK
Credit Appraisal
Maximum Credit
(from 0 a 6,000,000 €)
Favourable to 300.001,20 €
Rating Evolution
Financial Situation
Fiscal year2007
|
Treasury |
Excellent |
|
Indebtedness |
Weak |
|
Profitability |
Average |
|
Balance |
Excellent |
Performance
|
Legal Actions |
None or Negligible |
|
Business
Trajectory |
Excellent |
COMPANY NOT REGISTERED IN THE R.A.I.
This company is not registered in the Disputed Bills register (R.A.I.)
INCIDENTS

Summary
LEGAL ACTIONS: No legal
incidences registered
CLAIM FILED AGAINST THE ADMINISTRATION: No administrative
claims registered
AFFECTED BY: No significant
element.
FINANCIAL ELEMENTS AND SECTORIAL
COMPARATIVE
FINANCIAL ELEMENTS
Figures given in €
|
|
2005 (12) |
2006 (12) |
2007 (12) |
% ASSETS |
|
|
|
|
|
|
BALANCE SHEET
ANALYSIS |
|
|
|
|
|
|
|
|
|
|
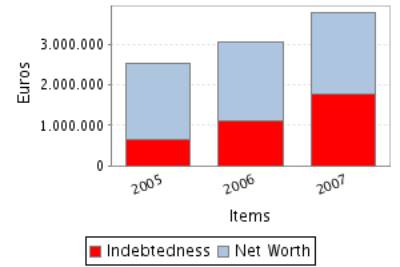
OWN FUNDS |
1.900.519,00 |
1.958.543,55 |
2.018.531,85 |
53,43 |
|
|
|
|
|
|
DEBT |
633.700,03 |
1.101.295,60 |
1.759.277,97 |
46,57 |
|
|
|
|
|
|
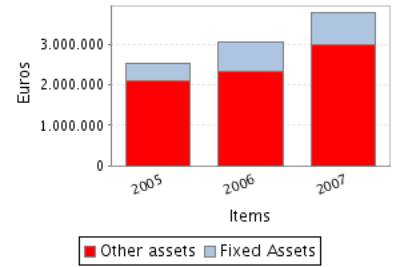
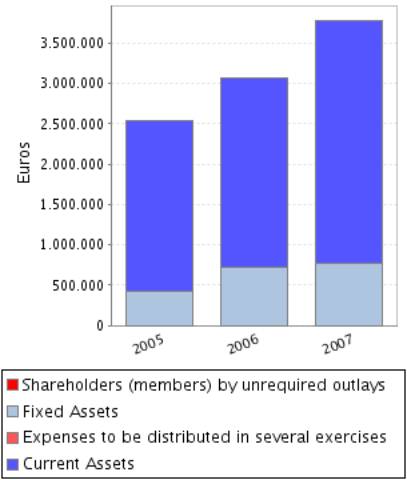
FIXED ASSETS |
419.902,31 |
727.452,07 |
772.260,83 |
20,44 |
|
|
|
|
|
|
TOTAL ASSETS |
2.534.219,03 |
3.059.839,15 |
3.777.809,82 |
|
|
|
|
|
|
|
|
|
|
|
|
|
|
|
|
|
|
|
2005 (12) |
2006 (12) |
2007 (12) |
% SALES |
|
|
|
|
|
|
PROFIT AND LOSS
ACCOUNT ANALYSIS |
|
|
|
|
|
|
|
|
|
|
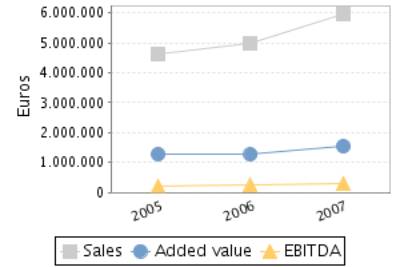
SALES |
4.607.540,78 |
4.985.559,53 |
5.955.287,90 |
|
|
|
|
|
|
|
ADDED VALUE |
1.280.708,89 |
1.273.230,13 |
1.544.425,83 |
25,93 |
|
|
|
|
|
|
EBITDA |
204.229,81 |
235.809,55 |
313.647,32 |
5,27 |
|
|
|
|
|
|
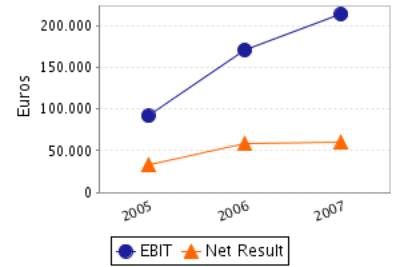
EBIT |
91.692,67 |
171.069,82 |
213.815,09 |
3,59 |
|
|
|
|
|
|
NET RESULT |
33.584,93 |
58.024,55 |
59.988,30 |
1,01 |
|
|
|
|
|
Balance Sheets Items
Analysis
Balance Sheet Comments
Total assets of the company grew 20,74% between 2005 and 2006.
This growth is a consequence of the fixed assets increase of 73,24%.
This growth has been mainly financed with a debt increase of 73,79%.
Nevertheless the net worth increased 3,05%.
Total assets of the company grew 23,46% between 2006 and 2007.
This growth has been inferior in the case of the fixed assets that
increased just in 6,16%.
This growth has been mainly financed with a debt increase of 59,75%.
Nevertheless the net worth increased 3,06%.
Profit and Loss Account Analysis
Profit and Loss Account Comments
The company’s sales figure grew 8,20% between 2005 and 2006.
The company’s EBIT grew 86,57% between 2005 and 2006.
This evolution implies an increase in the company’s operating profitability.
The result of these variations is an increase of the company’s Economic
Profitability of 54,52% in the analysed period, being this profitability of
5,59% in the year 2006.
The company’s Net Result grew 72,77% between 2005 and 2006.
This evolution, compared to the EBIT’s performance, implies that the
financial and extraordinary activities have had a negative effect in the
company’s Financial Profitability.
The result of these variations is an increase of the company’s Economic
Profitability of 67,65% in the analysed period, being equal to 2,96% in the
year 2006.
The company’s sales figure grew 19,45% between 2006 and 2007.
The company’s EBIT grew 24,99% between 2006 and 2007.
This evolution implies an increase in the company’s operating
profitability.
The result of these variations is an increase of the company’s Economic
Profitability of 1,23% in the analysed period, being this profitability of
5,66% in the year 2007.
The company’s Net Result grew 3,38% between 2006 and 2007.
This evolution, compared to the EBIT’s performance, implies that the
financial and extraordinary activities have had a negative effect in the
company’s Financial Profitability.
The result of these variations is an increase of the company’s Economic
Profitability of 0,31% in the analysed period, being equal to 2,97% in the year
2007.
ANNUAL FINANCIAL REPORT ADDITIONAL DATA
Source: annual financial report 2007
Results Distribution
Figures given in €
|
DISTRIBUTION
BASE |
DISTRIBUTION TO |
||
|
Profit and Loss |
59.988,30 |
Retained earnings |
0,00 |
|
Carry Over |
0,00 |
Voluntary Reserve |
0,00 |
|
Voluntary reserves |
0,00 |
Prior years losses |
0,00 |
|
Reserves |
10.011,70 |
Carry Over |
0,00 |
|
Other concepts |
0,00 |
Other funds |
0,00 |
|
Total of Amounts to be distributed |
70.000,00 |
Dividends |
70.000,00 |
|
|
|
Other Applications |
0,00 |
COMPARATIVE SECTOR
ANALYSIS
Values table
Figures expressed in %
|
|
COMPANY (2007) |
SECTOR |
DIFFERENCE |
DIFFERENCE RELATIVE |
|
|
|
|
|
|
BALANCE SHEET
ANALYSIS: % on the total assets |
|
|
|
|
|
|
|
|
|
|
OWN FUNDS |
53,43 |
40,48 |
12,95 |
31,98 |
|
|
|
|
|
|
DEBT |
46,57 |
59,52 |
-12,95 |
-21,75 |
|
|
|
|
|
|
FIXED ASSETS |
20,44 |
24,55 |
-4,11 |
-16,74 |
|
|
|
|
|
|
|
|
|
|
|
|
|
|
|
|
|
|
COMPANY (2007) |
SECTOR |
DIFFERENCE |
DIFFERENCE RELATIVE |
|
|
|
|
|
|
PROFIT AND LOSS
ACCOUNT ANALYSIS: % on the total operating income |
|
|
|
|
|
|
|
|
|
|
SALES |
100,00 |
98,70 |
1,30 |
1,31 |
|
|
|
|
|
|
ADDED VALUE |
25,93 |
17,96 |
7,97 |
44,36 |
|
|
|
|
|
|
EBIT |
3,59 |
5,02 |
-1,43 |
-28,51 |
|
|
|
|
|
|
NET RESULT |
1,01 |
3,06 |
-2,06 |
-67,12 |
|
|
|
|
|
Sector Composition
Compared sector (NACE): 514
Number of companies: 879
Size (Sales Figure) : 2.800.000,00 -
7.000.000,00 Euros
Comments on the sectorial comparative
Compared to its sector the assets of the companies show an inferior
proportion of fixed assets. Specifically the difference with the sector average
is -4,11% , which means a relative difference of -16,74% .
In liabilities composition the company appeals on a wider scale to self
financing, being the proportion of net worth of 12,95% superior, which means a
relative difference of 31,98% . As a consequence, external financing sources
are less used by the company in 12,95% less than the sector, which means a
difference of 21,75% .
The proportion that the sales mean to the company’s total ordinary
income is 100,00%, 1,30% higher than in the sector, which means a relative
difference of 1,31% .
The company’s EBIT was positive and was 3,59% with regard to the total
ordinary income, 1,43% less than the sector, which means a relative difference
of 28,51% .
The company’s capacity to generate operating income is equal to that of
the sector as its ratio EBIT/Sales is also equal.
The company’s net result was positive and equal to 1,01% with regard to
the total ordinary income, 2,06% less than the sector, which means a relative
difference of 67,12% .
The financial and extraordinary results and the tax impact have had a
negative impact on the Net result in the company with a worse behaviour than in
the sector; as a consequence, the company shows a worse Net Result/EBIT ratio
(REBEmpresa vs. REBSector).
ADDRESSES
Current Legal Seat Address:
CAMINO SANGRONIZ, 32
48150 SONDIKA VIZCAYA
Previous Seat Address:
STREET ANDRES ISASI, 27
48012
BILBAO VIZCAYA
Characteristics of the current address
Type of premises: store
Property: rented
Local Situation: secondary
CORPORATE STRUCTURE
ADMINISTRATIVE LINKS
Main Board members, Directors and Auditor ![]()
|
POSITION |
SURNAMES AND
NAME |
APPOINTMENT DATE |
|
SOLE ADMINISTRATOR |
GARCIA PELAEZ SERGIO |
10/08/1992 |
Functional Managers
|
POSITION |
SURNAMES AND
NAME |
|
General Manager |
GARCIA PELAEZ SERGIO |
|
Financial Manager |
GARCIA SERGIO |
|
Human Resources Manager |
URKIJO ROBERTO |
|
Commercial Manager |
GARCIA PELAEZ SERGIO |
FINANCIAL LINKS
|
|
BUSINESS NAME |
CIF / COUNTRY |
% |
SOURCE |
DATA INF. |
|
|
GARCIA PELAEZ SERGIO |
|
100,00 |
TRADE REG. |
31/12/2007 |
CREDIT INFORMATION
Constitution Date: 04/12/1985
Foundation Date: 04/12/1985
Founder / Origin: Europea de Cintas,
S.A., transformandose en S.L. en 1992
Business activity 
Activity: Wholesale of other products
NACE Code: 5147
NACE Activity: Wholesale of other
household goods
Activity description: DISTRIBUCION DE
CINTA, ETIQUETADO Y PAPEL DE REGALO
Employees 
Number of total employees: 21 (2007)
Number of fixed employees: 100,00%
Number of temporary employees: 0,00%
Employees evolution
COMMERCIAL OPERATIONS 
PURCHASES
Payments (estimated):
Import Percentage: 84%
Imports from: Francia, Italia y Inglaterra
SALES
Collection (estimated):
Export Percentage: 5%
Exports to: UNION EUROPEA
National Distribution: 95%
Banks 
|
ENTITY |
BRANCH |
ADDRESS |
TOWN OR CITY |
PROVINCE |
|
BANCO BILBAO VIZCAYA ARGENTARIA, S.A. |
|
|
|
|
1 bank entities registered
Brands, Signs and Commercial Names ![]()
ANAGRAM: EUROCINSA
FORMER NAMES:
•
EUROPEA DE CINTAS SA
Brand name: EUROCINSA EUROPEA DE CINTAS, S.R.L (Valid)
Type: JOINT Date: 04/06/1997
LEGAL STRUCTURE
Constitution Data
Register Date: 04/12/1985
Current Legal Form: LIMITED LIABILITY
COMPANY
Current Capital: 12.020,24 €
Legal Aspects
Obligation to fill in Financial
Statements: YES
Chamber census: YES (2006)
Listed on a Stock Exchange: NO
B.O.R.M.E.(Official Companies Registry Gazette) ![]()
Registered Proceedings
|
PROCEEDINGS |
DATE |
NOTICE NUM. |
TRADE REG. |
|
Appointments |
28/03/2006 |
165851 |
Vizcaya |
Other Proceedings published
|
PROCEEDINGS |
DATE |
NOTICE NUM. |
TRADE REG. |
|
Registration of
accounts (2007) Individual |
04/09/2008 |
412242 |
Vizcaya |
|
Registration of accounts (2006) Individual |
17/08/2007 |
286139 |
Vizcaya |
|
Registration of
accounts (2005) Individual |
16/08/2006 |
226388 |
Vizcaya |
|
Registration of
accounts (2004) Individual |
23/08/2005 |
244264 |
Vizcaya |
FINANCIAL INFORMATION
The information on the last account contained in this report is
extracted from the Mercantile Register file of the legal address of the Company
and dated 23/10/2008.
BALANCE SHEET
Assets
Figures given in €
|
|
31/12/2005 (12) |
31/12/2006 (12) |
31/12/2007 (12) |
|
A) DUE FROM SHAREHOLDERS FOR UNCALLED CAPITAL |
|
|
|
|
B) FIXED ASSETS |
419.902,31 |
727.452,07 |
772.260,83 |
|
I. Incorporation costs |
|
|
|
|
II. Intangible fixed assets |
11.185,30 |
16.320,21 |
19.910,30 |
|
III. Tangible fixed assets |
408.717,01 |
683.593,91 |
717.812,58 |
|
IV. Financial fixed assets |
|
27.537,95 |
34.537,95 |
|
V.Owners equity |
|
|
|
|
VI.Long term trade liabilities |
|
|
|
|
C) DEFERRED EXPENSES |
|
|
|
|
D) CURRENT ASSETS |
2.114.316,72 |
2.332.387,08 |
3.005.548,99 |
|
I. Shareholders by required outlays |
|
|
|
|
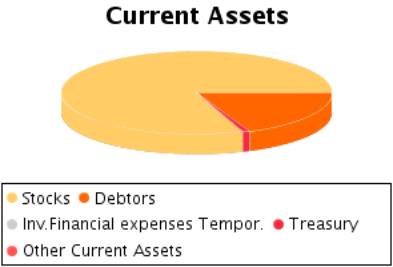
II. Stocks |
1.073.044,00 |
1.333.439,15 |
2.419.080,40 |
|
III. Debtors |
836.026,05 |
706.661,75 |
560.808,33 |
|
IV. Temporary financial investment |
|
|
|
|
V. Short-term own shares |
|
|
|
|
VI. Treasury |
205.246,67 |
292.286,18 |
25.660,26 |
|
VII. Periodification adjustments |
|
|
|
|
ASSETS (A + B + C + D) |
2.534.219,03 |
3.059.839,15 |
3.777.809,82 |
Assets composition
Liabilities
Figures given in €
|
|
31/12/2005 (12) |
31/12/2006 (12) |
31/12/2007 (12) |
|
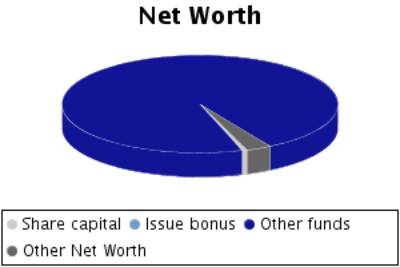
A) SHAREHOLDERS EQUITY |
1.900.519,00 |
1.958.543,55 |
2.018.531,85 |
|
I. Share capital |
12.020,24 |
12.020,24 |
12.020,24 |
|
II. Issue bonus |
|
|
|
|
III.Revaluation reserve |
|
|
|
|
IV.Reserves |
1.854.913,83 |
1.888.498,76 |
1.946.523,31 |
|
Capital adjustments in Euros |
|
|
|
|
Sundry reserves |
1.854.913,83 |
1.888.498,76 |
1.946.523,31 |
|
V.Results from previous years |
|
|
|
|
VI.Profit and Losses |
33.584,93 |
58.024,55 |
59.988,30 |
|
VII.Dividend paid during the year |
|
|
|
|
VIII.Own shares for capital reduction |
|
|
|
|
B) DEFERRED INCOME |
|
|
|
|
C) PROVISIONS FOR LIABILITIES AND EXPENSES |
|
|
|
|
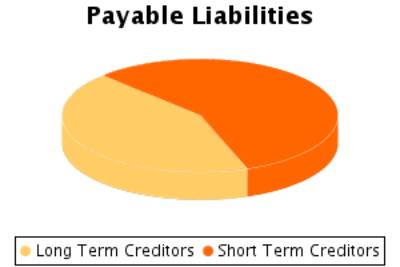
D) LONG TERM LIABILITIES |
92.910,41 |
400.608,78 |
759.036,77 |
|
E) SHORT TERM LIABILITIES |
540.789,62 |
700.686,82 |
1.000.241,20 |
|
F) SHORT TERM PROVISIONS FOR LIABILITIES AND
EXPENSES |
|
|
|
|
LIABILITIES (A + B + C + D + E + F) |
2.534.219,03 |
3.059.839,15 |
3.777.809,82 |
Liabilities
Composition
PROFIT AND LOSS ACCOUNT
Itams of the Profit and Loss Account
Figures given in €
|
|
31/12/2005 (12) |
31/12/2006 (12) |
31/12/2007 (12) |
|
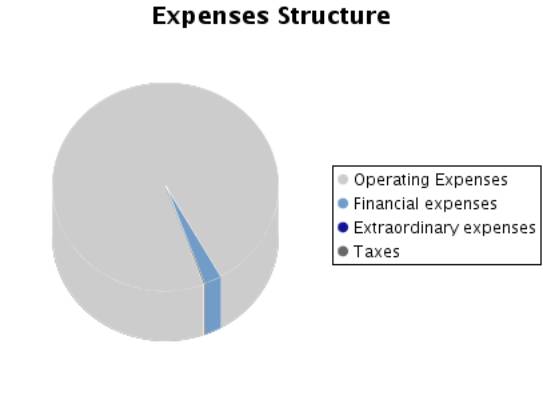
A) EXPENSES (A.1 a A.15) |
4.579.941,16 |
4.935.940,92 |
5.895.799,60 |
|
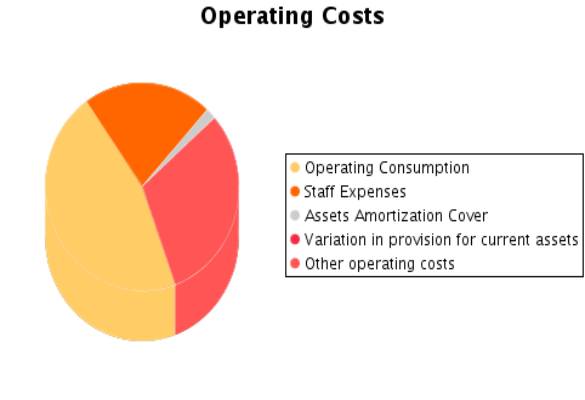
A.1.Operating costs |
2.063.349,42 |
2.123.292,99 |
2.633.291,62 |
|
A.2. Labour cost |
1.076.479,08 |
1.037.420,58 |
1.230.778,51 |
|
Wages |
859.164,70 |
820.789,28 |
986.861,48 |
|
Social security expenses |
217.314,38 |
216.631,30 |
243.917,03 |
|
A.3. Assets depreciation |
112.537,14 |
64.739,73 |
99.832,23 |
|
A.4. Variation in provision for current assets |
|
|
|
|
A.5. Other operating costs |
1.263.482,47 |
1.591.442,35 |
1.777.570,45 |
|
A.I. OPERATING RESULT (B.1-A.1-A.2-A.3-A.4-A.5) |
91.692,67 |
171.069,82 |
213.815,09 |
|
A.6.Financial expenses and similar |
52.502,84 |
74.838,59 |
145.204,14 |
|
Debts with related companies |
|
|
|
|
Debts with associated companies |
|
|
|
|
Other companies debts By debts with third parties and similar expenses |
52.502,84 |
74.838,59 |
145.204,14 |
|
Losses from financial investments |
|
|
|
|
A.7. Variation in financial investment provision |
|
|
|
|
A.8.Negative exchange difference |
|
|
|
|
A.II.POSITIVE
FINANCIAL RESULTS (B.2+B.3-A.6-A.7-A.8) |
|
|
|
|
A.III.PROFIT
FROM ORDINARY ACTIVITIES (A.I+A.II-B.I-B.II) |
39.189,83 |
96.231,23 |
68.610,95 |
|
A.9. Variation
in provision in fixed assets |
|
|
|
|
A.10. Losses in
fixed assets |
|
27.535,07 |
|
|
A.11. Losses
from own shares and bonds |
|
|
|
|
A.12.
Extraordinary charges |
|
|
|
|
A.13.Other
exercises’ expenses and losses |
|
|
|
|
A.IV.POSITIVE
EXTRAORDINARY RESULT (B.4+B.5+B.6+B.7+B.8-A.9-A.10-A.11-A.12-A.13) |
5.985,31 |
|
500,00 |
|
A.V.PROFIT
BEFORE TAXES (A.III+A.IV-B.III-B.IV) |
45.175,14 |
74.696,16 |
69.110,95 |
|
A.14.Corporate
Taxes |
6.636,54 |
11.761,04 |
9.122,65 |
|
A.15. Other
taxes |
4.953,67 |
4.910,57 |
|
|
A.VI.EXERCISE
RESULT (PROFIT) (A.V-A.14-A.15) |
33.584,93 |
58.024,55 |
59.988,30 |
|
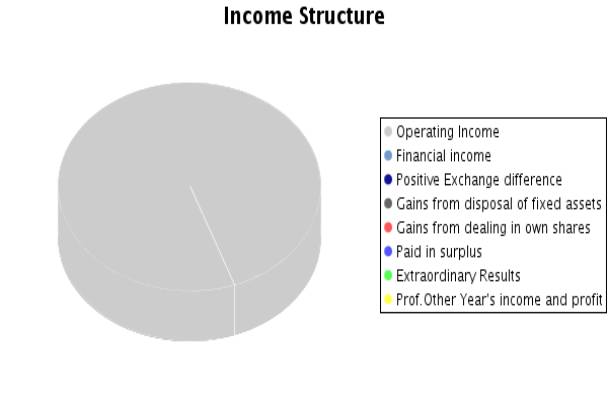
B) INCOMES (B.1 a B.8) |
4.613.526,09 |
4.993.965,47 |
5.955.787,90 |
|
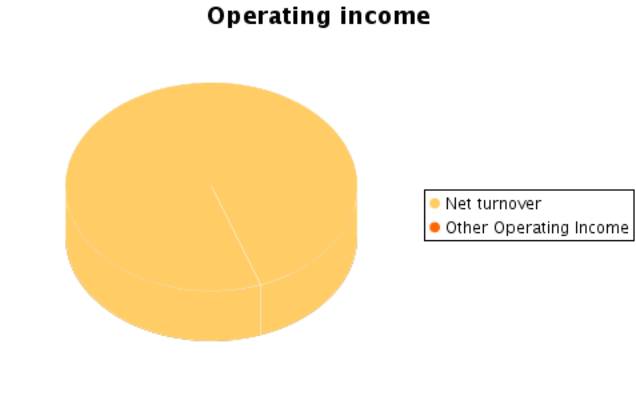
B.1.Operating income |
4.607.540,78 |
4.987.965,47 |
5.955.287,90 |
|
Turnover |
4.607.540,78 |
4.985.559,53 |
5.955.287,90 |
|
Other operating income |
|
2.405,94 |
|
|
B.I.OPERATING
LOSSES (A.1+A.2+A.3+A.4+A.5-B.1) |
|
|
|
|
B.2.Financial
Income |
|
|
|
|
From affiliated
companies |
|
|
|
|
From associated
companies |
|
|
|
|
Other |
|
|
|
|
Gains from
investments |
|
|
|
|
B.3. Positive
change difference |
|
|
|
|
B.II. NEGATIVE
FINANCIAL RESULTS (A.6+A.7+A.8-B.2-B.3) |
52.502,84 |
74.838,59 |
145.204,14 |
|
B.III.LOSSES
FROM ORDINARY ACTIVITIES (B.I+B.II-A.I-A.II) |
|
|
|
|
B.4.B.9. Gains from
disposal of fixed assets |
|
|
|
|
B.5.Gains from
dealing in own shares |
|
|
|
|
B.6. Paid in
surplus |
|
|
|
|
B.7.
Extraordinary income |
5.985,31 |
6.000,00 |
500,00 |
|
B.8.Other year’s
income and profits |
|
|
|
|
B.IV.NEGATIVE EXTRAORDINARY
LOSSES (A.9+A.10+A.11+A.12+A.13-B.4-B.5-B.6-B.7-B.8) |
|
21.535,07 |
|
|
B.V.LOSS BEFORE TAXES (B.III+B.IV-A.III-A.IV) |
|
|
|
|
B.VI.EXERCISE RESULTS (LOSS) (B.V+A.14+A.15) |
|
|
|
Composition of the
Profit and Loss Account
FINANCIAL BALANCE
Here the Main Capital Amounts of the company and the Revolving Fund
Evolution are analysed.
Financial Balance Table
Figures given in €
|
|
31/12/2005 (12) |
% |
31/12/2006 (12) |
% |
31/12/2007 (12) |
% |
|
A) DUE FROM
SHAREHOLDERS FOR UNCALLED CAPITAL |
|
|
|
|
|
|
|
B) FIXED ASSETS |
419.902,31 |
16,57 |
727.452,07 |
23,77 |
772.260,83 |
20,44 |
|
C) DEFERRED
EXPENSES |
|
|
|
|
|
|
|
D) CURRENT
ASSETS |
2.114.316,72 |
83,43 |
2.332.387,08 |
76,23 |
3.005.548,99 |
79,56 |
|
ASSETS (A + B +
C + D) |
2.534.219,03 |
|
3.059.839,15 |
|
3.777.809,82 |
|
|
|
||||||
|
A) SHAREHOLDERS
EQUITY |
1.900.519,00 |
74,99 |
1.958.543,55 |
64,01 |
2.018.531,85 |
53,43 |
|
B) DEFERRED INCOME |
|
|
|
|
|
|
|
C) PROVISIONS
FOR LIABILITIES AND EXPENSES |
|
|
|
|
|
|
|
D) LONG TERM
LIABILITIES |
92.910,41 |
3,67 |
400.608,78 |
13,09 |
759.036,77 |
20,09 |
|
E) SHORT TERM
LIABILITIES |
540.789,62 |
21,34 |
700.686,82 |
22,90 |
1.000.241,20 |
26,48 |
|
F) SHORT TERM
PROVISIONS FOR LIABILITIES AND EXPENSES |
|
|
|
|
|
|
|
LIABILITIES (A +
B + C + D + E + F) |
2.534.219,03 |
|
3.059.839,15 |
|
3.777.809,82 |
|
Financial Balance
Composition
Comments on Financial Balance
In the 2005, the assets of the company were formed in 16,57% of Fixed
Assets and in 83,43% of Current Assets.This assets were financed in 74,99% with
own capitals, and in 3,67% with long term debt and in 21,34% with current
liabilities.
The result of this financial structure is a positive turnover fund of
1.573.527,10 Euros, which is equivalent to 62,09% proportion of the
company’s total assets.
In the 2006, the assets of the company were formed in 23,77% of Fixed
Assets and in 76,23% of Current Assets.This assets were financed in 64,01% with
own capitals, and in 13,09% with long term debt and in 22,90% with current
liabilities.
The result of this financial structure is a positive turnover fund of
1.631.700,26 Euros, which is equivalent to 53,33% proportion of the
company’s total assets.
This measure has increased with respect to the previous exercise in
3,70% having, however, diminished its proportion with respect to the total
assets of the company.
In the 2007, the assets of the company were formed in 20,44% of Fixed
Assets and in 79,56% of Current Assets.This assets were financed in 53,43% with
own capitals, and in 20,09% with long term debt and in 26,48% with current
liabilities.
The result of this financial structure is a positive turnover fund of
2.005.307,79 Euros, which is equivalent to 53,08% proportion of the
company’s total assets.
This measure has increased with respect to the previous exercise in
22,90% having, however, diminished its proportion with respect to the total
assets of the company.
RATIOS
Main Ratios
|
|
31/12/2005 (12) |
31/12/2006 (12) |
31/12/2007 (12) |
|
STRUCTURAL RATIOS |
|
|
|
|
Management fund |
1.573.527,10 |
1.631.700,26 |
2.005.307,79 |
|
Indebtedness (%) |
25,01 |
35,99 |
46,57 |
|
External Funds on Net Worth |
0,33 |
0,56 |
0,87 |
|
GENERAL ACTIVITY RATIO |
|
|
|
|
Turnover Increase (%) |
-0,09 |
8,20 |
19,45 |
|
Added value growth (%) |
4,90 |
-0,58 |
21,30 |
|
Cash Flow |
146.122,07 |
122.764,28 |
159.820,53 |
|
Labour Productivity |
1,19 |
1,23 |
1,26 |
|
Assets turnover |
1,82 |
1,63 |
1,58 |
|
Breakdown Point |
4.441.484,99 |
4.690.098,83 |
5.571.985,12 |
|
Security Margin of the Breakdown Point (%) |
3,60 |
5,97 |
6,44 |
|
ACTIVITY RATIOS |
|
|
|
|
Average Collection Period |
65 |
51 |
34 |
|
Inventory Turnover Period |
84 |
96 |
146 |
|
SOLVENCY RATIOS |
|
|
|
|
Payback Capacity |
0,23 |
0,11 |
0,09 |
|
Assets Guarantee |
4,00 |
2,78 |
2,15 |
|
Short Term Debts Proportion (%) |
85,34 |
63,62 |
56,86 |
|
Interest Coverage |
2,67 |
1,56 |
1,10 |
|
LIQUIDITY RATIOS |
|
|
|
|
Current Ratio |
3,91 |
3,33 |
3,00 |
|
Immediate liquidity |
0,38 |
0,42 |
0,03 |
|
Sales on Current Assets |
785 |
770 |
713 |
Results Analysis
Ratios
|
|
31/12/2005 (12) |
31/12/2006 (12) |
31/12/2007 (12) |
|
Economic profitability (%) |
3,62 |
5,59 |
5,66 |
|
Operating Profitability (%) |
1,99 |
3,43 |
3,59 |
|
Equity gearing |
0,57 |
0,88 |
0,60 |
|
Financial profitability (%) |
1,77 |
2,96 |
2,97 |
|
General Profitability (%) |
0,73 |
1,16 |
1,01 |
Comments on the
Results Analysis Ratios
The economic profitability in the year2006 achieved a 5,59% positive
level, due to a 3,43% economic margin and to an assets turnover of1,63%.
The economic profitability in the year has increased from 3,62% up to 5,59%.
This growth is due to the economic margin increase, from 1,99% to the current
3,43% in spite of the assets turnover drop, which have decreased from 1,82 to
1,63%.
Financial profitability on 2006 achieved a 2,96%.
The company’s financial structure has limited its profitability with an
indebtedness level of 0,88.
The general profitability on 2006 achieved a 1,16%.
The economic profitability in the year2007 achieved a 5,66% positive
level, due to a 3,59% economic margin and to an assets turnover of1,58%.
The economic profitability in the year has increased from 5,59% up to
5,66%. This growth is due to the economic margin increase, from 3,43% to the
current 3,59% in spite of the assets turnover drop, which have decreased from
1,63 to 1,58%.
Financial profitability on 2007 achieved a 2,97%.
The company’s financial structure has limited its profitability with an
indebtedness level of 0,60.
The general profitability on 2007 achieved a 1,01%.
SECTORIAL ANÁLYSIS
Large Capital Amounts and Financial Balance
Figures given in %
|
|
COMPANY (2007) |
SECTOR |
DIFFERENCE |
DIFFERENCE RELATIVE |
|
|
|
|
|
|
ASSETS |
|
|
|
|
|
|
|
|
|
|
A) DUE FROM
SHAREHOLDERS FOR UNCALLED CAPITAL |
|
0,02 |
|
|
|
|
|
|
|
|
B) FIXED ASSETS |
20,44 |
24,55 |
-4,11 |
-16,75 |
|
|
|
|
|
|
C) DEFERRED
EXPENSES |
|
0,45 |
|
|
|
|
|
|
|
|
D) CURRENT ASSETS |
79,56 |
74,98 |
4,58 |
6,11 |
|
|
|
|
|
|
ASSETS (A + B + C + D) |
100 |
100 |
|
|
|
|
|
|
|
|
|
|
|
|
|
|
|
|
|
|
|
|
COMPANY (2007) |
SECTOR |
DIFFERENCE |
DIFFERENCE RELATIVE |
|
|
|
|
|
|
LIABILITIES |
|
|
|
|
|
|
|
|
|
|
A) SHAREHOLDERS
EQUITY |
53,43 |
40,40 |
13,03 |
32,25 |
|
|
|
|
|
|
B) DEFERRED
INCOME |
|
0,08 |
|
|
|
|
|
|
|
|
C) PROVISIONS
FOR LIABILITIES AND EXPENSES |
|
0,12 |
|
|
|
|
|
|
|
|
D) LONG TERM
LIABILITIES |
20,09 |
9,44 |
10,65 |
112,80 |
|
|
|
|
|
|
E) SHORT TERM
LIABILITIES |
26,48 |
49,93 |
-23,45 |
-46,96 |
|
|
|
|
|
|
F) SHORT TERM PROVISIONS
FOR LIABILITIES AND EXPENSES |
|
0,03 |
|
|
|
|
|
|
|
|
LIABILITIES (A + B + C + D + E + F) |
100 |
100 |
|
|
|
|
|
|
|
Sectorial Financial
Balance Comparison
Comments to the Sectorial Analysis
In the 2007, the assets of the company were formed in 20,44% of fixed
assets and in 79,56Current Assets % In the sector, the proportion of fixed
assets was of 25,02%, 18,31% superior, and the proportion of current assets was
of 74,98%, 6,11% inferior.
The assets were financed in the company in 53,43% with own capitals , in
20,09% with fixed liabilities and in 26,48% with current liabilities In the
sector, the self financing represented 40,48%, 31,98% inferior. On the other
hand the long term debts represented in the sector an average of 9,56%
financing, with a relative difference of 110,12% in favour of the companyAnd,
short term liabilities represented in the sector an average of 49,96%
financing, with a relative difference of 46,99% favourable to the sector
The result of this company’s financial structure is a turnover fund that
represents 53,08% of the total assets; in the sector, this same proportion is
25,02%, therefore, we can say that the company’s turnover fund is 112,12%
higher than the one in of the sector.
Analytical Account of Results
Figures given in %
|
|
COMPANY (2007) |
SECTOR |
DIFFERENCE |
DIFFERENCE RELATIVE |
|
Turnover |
100,00 |
98,70 |
1,30 |
1,31 |
|
Other operating income |
|
1,30 |
|
|
|
Production Value |
100,00 |
100,00 |
0,00 |
0,00 |
|
Operating expenses |
44,22 |
69,73 |
-25,51 |
-36,59 |
|
Other operation expenses |
29,85 |
12,30 |
17,55 |
142,66 |
|
Added value |
25,93 |
17,96 |
7,96 |
44,34 |
|
Labour cost |
20,67 |
11,40 |
9,27 |
81,32 |
|
Gross Economic Result |
5,27 |
6,56 |
-1,30 |
-19,73 |
|
Assets depreciation |
1,68 |
1,30 |
0,38 |
29,13 |
|
Variation in provision for current assets and bad debt losses |
|
0,24 |
|
|
|
Net Economic Result |
3,59 |
5,02 |
-1,43 |
-28,51 |
|
Financial income |
|
0,56 |
|
|
|
Financial Charges |
2,44 |
1,27 |
1,17 |
92,73 |
|
Variation in financial investment provision |
|
0,01 |
|
|
|
Ordinary
Activities Result |
1,15 |
4,31 |
-3,16 |
-73,33 |
|
Extraordinary income |
0,01 |
0,26 |
-0,25 |
-96,15 |
|
Extraordinary charges |
|
0,16 |
|
|
|
Variation in provision in fixed assets |
|
0,04 |
|
|
|
Results before Taxes |
1,16 |
4,36 |
-3,20 |
-73,41 |
|
Corporate taxes |
0,15 |
1,30 |
-1,15 |
-88,45 |
|
Net Result |
1,01 |
3,06 |
-2,05 |
-67,04 |
|
Assets depreciation |
1,68 |
1,30 |
0,38 |
29,13 |
|
Change of Provisions |
|
0,29 |
|
|
|
Net Self-Financing |
2,68 |
4,66 |
-1,98 |
-42,48 |
Main Ratios
|
|
COMPANY (2007) |
PTILE25 |
PTILE50 |
PTILE75 |
|
STRUCTURAL RATIOS |
|
|
|
|
|
Management fund |
2.005.307,79 |
170,68 |
468,90 |
975,75 |
|
Indebtedness (%) |
46,57 |
47,83 |
68,28 |
81,86 |
|
External Funds on Net Worth |
0,87 |
0,92 |
2,15 |
4,51 |
|
GENERAL ACTIVITY
RATIO |
|
|
|
|
|
Turnover Increase (%) |
19,45 |
-4,64 |
5,12 |
15,78 |
|
Added value growth (%) |
21,30 |
-5,17 |
5,89 |
17,74 |
|
Cash Flow |
159.820,53 |
66,52 |
126,94 |
239,56 |
|
Labour Productivity |
1,26 |
1,28 |
1,50 |
1,93 |
|
Assets turnover |
1,58 |
1,14 |
1,60 |
2,15 |
|
Breakdown Point |
5.571.985,12 |
2.562.435,21 |
3.126.728,81 |
4.055.330,50 |
|
Security Margin
of the Breakdown Point (%) |
6,44 |
6,94 |
13,31 |
23,20 |
|
ACTIVITY RATIOS |
|
|
|
|
|
Average Collection Period |
34 |
49 |
84 |
124 |
|
Inventory Turnover Period |
146 |
23 |
48 |
86 |
|
SOLVENCY RATIOS |
|
|
|
|
|
Payback Capacity |
0,09 |
0,04 |
0,09 |
0,18 |
|
Assets Guarantee |
2,15 |
1,22 |
1,46 |
2,08 |
|
Short Term Debts Proportion (%) |
56,86 |
78,66 |
94,95 |
100,00 |
|
Interest Coverage |
1,10 |
2,40 |
5,88 |
17,43 |
|
LIQUIDITY RATIOS |
|
|
|
|
|
Current Ratio |
3,00 |
1,12 |
1,36 |
1,98 |
|
Immediate liquidity |
0,03 |
0,05 |
0,16 |
0,46 |
|
Sales on Current Assets |
713 |
540 |
738 |
1.001 |
Results Analysis
Ratios
|
|
COMPANY (2007) |
PTILE25 |
PTILE50 |
PTILE75 |
|
Economic profitability (%) |
5,66 |
3,00 |
5,51 |
9,87 |
|
Operating Profitability (%) |
3,59 |
1,91 |
3,52 |
6,24 |
|
Equity gearing |
0,60 |
1,43 |
2,11 |
3,32 |
|
Financial profitability (%) |
2,97 |
5,00 |
10,06 |
18,21 |
|
General Profitability (%) |
1,01 |
0,77 |
1,75 |
3,82 |
FOREIGN EXCHANGE
RATES
|
Currency |
Unit
|
Indian Rupees |
|
US Dollar |
1 |
Rs.47.94 |
|
UK Pound |
1 |
Rs.72.07 |
|
Euro |
1 |
Rs.64.70 |
RATING
EXPLANATIONS
|
RATING |
STATUS |
PROPOSED CREDIT LINE |
|
|
>86 |
Aaa |
Possesses an extremely sound financial base with the strongest
capability for timely payment of interest and principal sums |
Unlimited |
|
71-85 |
Aa |
Possesses adequate working capital. No caution needed for credit transaction.
It has above average (strong) capability for payment of interest and
principal sums |
Large |
|
56-70 |
A |
Financial & operational base are regarded healthy. General unfavourable
factors will not cause fatal effect. Satisfactory capability for payment of
interest and principal sums |
Fairly Large |
|
41-55 |
Ba |
Overall operation is considered normal. Capable to meet normal
commitments. |
Satisfactory |
|
26-40 |
B |
Unfavourable & favourable factors carry similar weight in credit
consideration. Capability to overcome financial difficulties seems
comparatively below average. |
Small |
|
11-25 |
Ca |
Adverse factors are apparent. Repayment of interest and principal sums
in default or expected to be in default upon maturity |
Limited with
full security |
|
<10 |
C |
Absolute credit risk exists. Caution needed to be exercised |
Credit not
recommended |
|
NR |
In view of the lack of information, we have no basis upon which to
recommend credit dealings |
No Rating |
|
This score serves as a reference to assess SC’s credit risk
and to set the amount of credit to be extended. It is calculated from a composite
of weighted scores obtained from each of the major sections of this report. The
assessed factors and their relative weights (as indicated through %) are as
follows:
Financial
condition (40%) Ownership
background (20%) Payment
record (10%)
Credit history
(10%) Market trend
(10%) Operational
size (10%)