![]()
MIRA
INFORM REPORT
|
Report Date : |
22.12.2008 |
IDENTIFICATION
DETAILS
|
Name : |
LEALMA SA |
|
|
|
|
Registered Office : |
Street Decano Higueras Del Castillo, S/N
29620 Torremolinos Málaga |
|
|
|
|
Country : |
Spain |
|
|
|
|
Financials (as on) : |
31.12.2007 |
|
|
|
|
Date of Incorporation : |
|
|
|
|
|
Legal Form : |
Joint Stock Company |
|
|
|
|
Line of Business : |
RATING &
COMMENTS
|
MIRA’s Rating : |
Ba |
|
RATING |
STATUS |
PROPOSED CREDIT LINE |
|
|
41-55 |
Ba |
Overall operation is considered normal. Capable to meet normal commitments. |
Satisfactory |
|
Maximum Credit Limit : |
154.460,11 € |
|
|
|
|
Status : |
Satisfactory |
|
|
|
|
Payment Behaviour : |
No Complaints |
|
|
|
|
Litigation : |
Clear |
FINANCIAL REPORT
LEALMA SA
TAX NUMBER: A29066065
EXECUTIVE SUMMARY
Identification
Current Business Name: LEALMA SA
Other names: NO
Current Address: STREET DECANO HIGUERAS DEL
CASTILLO, S/N
Branches: 1
Telephone number: 917502727 Fax: 917502727
URL: www.lealma.com
Corporate e-mail: silvia@lealma.com
Commercial Risk
Credit Appraisal: 154.460,11 €
RAI: NO
Legal Actions: NO
Financial Information
Latest Balance sheet sales (2007): 6.984.253,51 € (MERCANTILE REGISTER)
Result: 180.618,22 €
Total Assets: 4.230.407,28 €
Social Capital: 150.253,03 €
Employees: 5
Commercial Information
Constitution Date: 12/02/1981
Business activity: Wholesale of clothing (outerwear)
NACE Code: 5142
International Operations: Imports and
Exports
Corporate Structure
Sole Administrator:
Parent Company:
Other Complementary Information
Latest proceeding published in BORME: 08/09/2008 Registration
of accounts
Latest press article: 07/02/2003 SUR (INFORMATION
ON LEGAL ANNOUNCE)
Bank Entities: Yes
COMMERCIAL RISK
Credit Appraisal
Maximum Credit
(from 0 a 6,000,000 €)
Favourable to 154.460,11 €
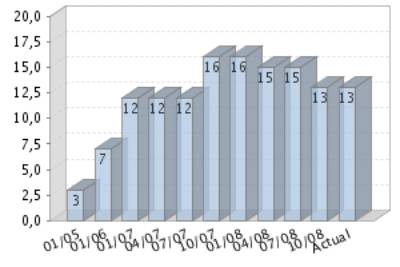
Rating Evolution
Financial Situation
Fiscal year2007
|
Treasury |
Good |
|
Indebtedness |
Average |
|
Profitability |
Average |
|
Balance |
Excellent |
Performance
|
Legal Actions |
None or Negligible |
|
Business
Trajectory |
Excellent |
COMPANY NOT REGISTERED IN THE R.A.I.
This company is not registered in the Disputed Bills register (R.A.I.)
INCIDENTS

Summary
LEGAL ACTIONS: No legal
incidences registered
CLAIM FILED AGAINST THE ADMINISTRATION: No administrative
claims registered
AFFECTED BY: No significant
element.
FINANCIAL ELEMENTS AND SECTORIAL
COMPARATIVE
FINANCIAL ELEMENTS
Figures given in €
|
|
2005 (12) |
2006 (12) |
2007 (12) |
% ASSETS |
|
|
|
|
|
|
BALANCE SHEET
ANALYSIS |
|
|
|
|
|
|
|
|
|
|
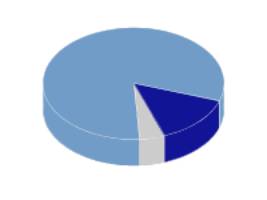
OWN FUNDS |
266.538,51 |
838.681,88 |
1.019.300,10 |
24,09 |
|
|
|
|
|
|
DEBT |
961.526,59 |
3.154.518,99 |
3.211.107,18 |
75,91 |
|
|
|
|
|
|
FIXED ASSETS |
605.771,19 |
986.527,26 |
657.877,28 |
15,55 |
|
|
|
|
|
|
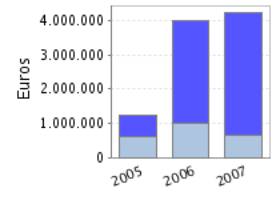
TOTAL ASSETS |
1.228.065,10 |
3.993.200,87 |
4.230.407,28 |
|
|
|
|
|
|
|
|
|
|
|
|
|
|
|
|
|
|
|
2005 (12) |
2006 (12) |
2007 (12) |
% SALES |
|
|
|
|
|
|
PROFIT AND LOSS
ACCOUNT ANALYSIS |
|
|
|
|
|
|
|
|
|
|
SALES |
3.278.162,09 |
9.672.028,34 |
6.984.253,51 |
|
|
|
|
|
|
|
ADDED VALUE |
421.083,18 |
939.001,48 |
381.964,61 |
5,47 |
|
|
|
|
|
|
EBITDA |
397.377,66 |
891.014,99 |
288.172,19 |
4,13 |
|
|
|
|
|
|
EBIT |
383.875,86 |
844.206,92 |
261.639,03 |
3,75 |
|
|
|
|
|
|
NET RESULT |
268.068,57 |
572.143,37 |
180.618,22 |
2,59 |
|
|
|
|
|
Balance Sheets Items Analysis
|
|
|
|
|
|
Balance Sheet Comments
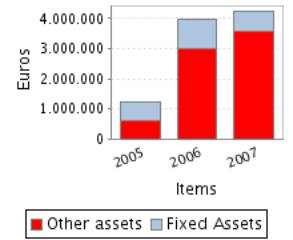
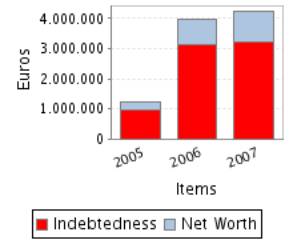
Total assets of the company grew 225,16% between 2005 and 2006.
This growth has been inferior in the case of the fixed assets that
increased just in 62,85%.
This growth has been mainly financed with a debt increase of 228,07%.
Nevertheless the net worth increased 214,66%.
Total assets of the company grew 5,94% between 2006 and 2007.
In spite of the assets’ growth, the fixed assets decreased 33,31%.
This growth has been financed, on a wider scale, with a Shareholders’ equity
increase of 21,54% and in a smaller proportion with an debt increase of 1,79%.
Profit and Loss Account Analysis
|
|
|
|
|
|
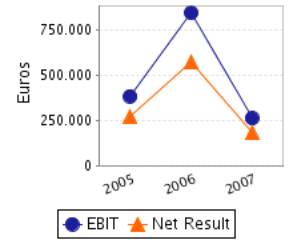
Profit and Loss Account Comments
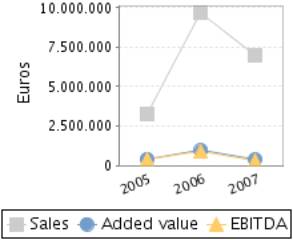
The company’s sales figure grew 195,04% between 2005 and 2006.
The company’s EBIT grew 119,92% between 2005 and 2006.
This evolution implies a reduction in the company’s operating
profitability.
The result of these variations is a decrease of the company’s Economic
Profitability of 32,37% in the analysed period, being this profitability of
21,14% in the year 2006.
The company’s Net Result grew 113,43% between 2005 and 2006.
This evolution, compared to the EBIT’s performance, implies that the
financial and extraordinary activities have had a negative effect in the company’s
Financial Profitability.
The result of these variations is a reduction of the company’s
profitability of 32,17% in the analysed period, being equal to 68,22% in the
year 2006.
The company’s sales figure decreased in 27,79% between 2006 and 2007.
The company’s EBIT decreased in 69,01% between 2006 and 2007.
This evolution implies a reduction in the company’s operating
profitability.
The result of these variations is a decrease of the company’s Economic
Profitability of 70,75% in the analysed period, being this profitability of
6,18% in the year 2007.
The company’s Net Result decreased in 68,43% between 2006 and 2007.
This evolution, compared to the EBIT’s performance, implies that the
financial and extraordinary activities have had a positive effect in the
company’s Financial Profitability.
The result of these variations is a reduction of the company’s
profitability of 74,03% in the analysed period, being equal to 17,72% in the
year 2007.
ANNUAL FINANCIAL REPORT ADDITIONAL DATA
Results Distribution
Source: annual financial report 2007
Figures given in €
|
DISTRIBUTION
BASE |
DISTRIBUTION TO |
||
|
Profit and Loss |
180.618,22 |
Retained earnings |
0,00 |
|
Carry Over |
0,00 |
Voluntary Reserve |
180.618,22 |
|
Voluntary reserves |
0,00 |
Prior years losses |
0,00 |
|
Reserves |
0,00 |
Carry Over |
0,00 |
|
Other concepts |
0,00 |
Other funds |
0,00 |
|
Total of Amounts to be distributed |
180.618,22 |
Dividends |
0,00 |
|
|
|
Other Applications |
0,00 |
AUDITING
Source: field account 2007
Auditors’ opinion: FAVOURABLE WITH RESERVATIONS
Auditor: AUDITORES Y PRACTICA CONCURSAL S.L.
Auditing exceptions:
LA SOCIEDAD CONTABILIZA LAS COMPRAS Y GASTOS EN LA
FECHA DE RECEPCION DE FACTURAS Y LOS PAGARES ENTREGADOS EN LA FECHA DE SU CARGO
EN CUENTA, LO QUE DA LUGAR A DIFERENCIAS DE CONCILIACION A 31 DE DICIEMBRE DE
2007 CON PROVEEDORES POR IMPORTE DE 321.546,53 EUROS. ASI MISMO PROCEDE
REALIZAR UN AJUSTE POR DUPLICIDAD DE FACTURA RECIBIDA DE 100.725,00 EUROS.
PROCEDE LA RECLASIFICACION DEL SALDO REFLEJADO COMO PARTIDA PENDIENTE DE
APLICACION POR IMPORTE DE 55.175,27 EUROS AL EPIGRAFE DE PROVEEDORES. LA
SOCIEDAD MANTIENE ABIERTOS A INSPECCION LOS EJERCICIOS NO PRESCRITOS CON EL
CONSIGUIENTE RIESGO FISCAL. NO ES POSIBLE PREDETERMINAR SI, COMO CONSECUENCIA
DE FUTURAS INSPECCIONES, CASO DE QUE SE PRODUZCAN, ESTAS DARAN LUGAR FINALMENTE
A PERDIDAS ADICIONALES PARA LA SOCIEDAD.
COMPARATIVE SECTOR ANALYSIS
Values table
Figures expressed in %
|
|
COMPANY (2007) |
SECTOR |
DIFFERENCE |
DIFFERENCE RELATIVE |
|
|
|
|
|
|
BALANCE SHEET
ANALYSIS: % on the total assets |
|
|
|
|
|
|
|
|
|
|
OWN FUNDS |
24,09 |
39,26 |
-15,17 |
-38,63 |
|
|
|
|
|
|
DEBT |
75,91 |
60,74 |
15,17 |
24,97 |
|
|
|
|
|
|
FIXED ASSETS |
15,55 |
21,78 |
-6,23 |
-28,62 |
|
|
|
|
|
|
|
|
|
|
|
|
|
|
|
|
|
|
COMPANY (2007) |
SECTOR |
DIFFERENCE |
DIFFERENCE RELATIVE |
|
|
|
|
|
|
PROFIT AND LOSS
ACCOUNT ANALYSIS: % on the total operating income |
|
|
|
|
|
|
|
|
|
|
SALES |
100,00 |
99,29 |
0,71 |
0,71 |
|
|
|
|
|
|
ADDED VALUE |
5,47 |
14,93 |
-9,46 |
-63,36 |
|
|
|
|
|
|
EBIT |
3,75 |
4,84 |
-1,09 |
-22,62 |
|
|
|
|
|
|
NET RESULT |
2,59 |
2,67 |
-0,08 |
-3,14 |
|
|
|
|
|
Sector Composition
Compared sector (NACE): 5142
Number of companies: 140
Size (Sales Figure) : 2.800.000,00 - 7.000.000,00 Euros
Comments on the sectorial comparative
Compared to its sector the assets of the companies show an inferior
proportion of fixed assets. Specifically the difference with the sector average
is -6,23% , which means a relative difference of -28,62% .
In liabilities composition the company appeals on a wider scale to self
financing, being the proportion of net worth of 15,17% inferior, which means a
relative difference of 38,63% 15,17% more than the sector, which means a
difference of 24,97% .
The proportion that the sales mean to the company’s total ordinary
income is 100,00%, 0,71% higher than in the sector, which means a relative
difference of 0,71% .
The company’s EBIT was positive and was 3,75% with regard to the total
ordinary income, 1,09% less than the sector, which means a relative difference
of 22,62% .
The company’s capacity to generate operating income is equal to that of
the sector as its ratio EBIT/Sales is also equal.
The company’s net result was positive and equal to 2,59% with regard to
the total ordinary income, 0,08% less than the sector, which means a relative difference
of 3,14% .
The financial and extraordinary results and the tax impact have had a
less negative impact on the Net result in the company than in the sector; as a
consequence, the company shows a better Net Result/EBIT ratio (REBEmpresa vs.
REBSector).
ADDRESSES
Current Legal Seat Address:
STREET DECANO HIGUERAS DEL CASTILLO, S/N
29620 TORREMOLINOS MÁLAGA
Previous Seat Address:
STREET ALEJANDRO CASONA (GUADALHORC), 43
29004 MALAGA
MÁLAGA
|
STREET |
POSTAL CODE |
TOWN |
PROVINCE |
|
STREET MARIA DE
PORTUGAL (PISO 1º), 40 |
28050 |
MADRID |
Madrid |
There are 1 branches registered
CORPORATE STRUCTURE
ADMINISTRATIVE LINKS
Main Board members, Directors and Auditor ![]()
|
POSITION |
SURNAMES AND
NAME |
APPOINTMENT DATE |
|
|
SOLE ADMINISTRATOR |
BENAIM MOISES LEVY |
03/05/2007 |
|
|
AUDITOR |
APPOINTMENT DATE |
||
|
AUDITORES Y PRACTICA CONCURSAL SL |
15/02/2008 |
||
There are 2 board members, directors and auditors registered.
Functional Managers
|
POSITION |
SURNAMES AND
NAME |
|
General Manager |
BENAIM LEVY MOISES |
|
Financial Manager |
BENAIM LEVY MOISES |
FINANCIAL LINKS
|
|
BUSINESS NAME |
CIF / COUNTRY |
% |
SOURCE |
DATA INF. |
|
|
LEVY BENAIM MOISES |
|
100,00 |
OWN SOURCES |
13/02/2008 |
There are 1 direct financial links through shareholders
registered
CREDIT INFORMATION
Constitution Date: 12/02/1981
Business activity 
Activity: Wholesale of clothing (outerwear)
NACE Code: 5142
NACE Activity: Wholesale of
clothing and footwear
Activity
description: distribucion de prendas y
complementos textiles.
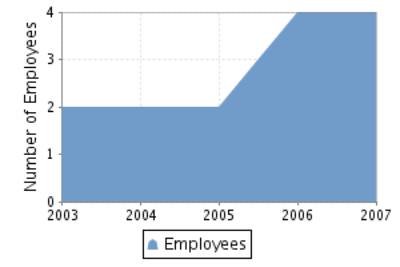
Employees 
Number of total employees: 5 (2008)
Number of fixed employees: 100,00%
Employees evolution
|
ENTITY |
BRANCH |
ADDRESS |
TOWN OR CITY |
PROVINCE |
|
BANCO BILBAO
VIZCAYA ARGENTARIA, S.A. |
|
|
TORREMOLINOS |
|
|
CAJA DE AHORROS Y PENSIONES DE BARCELONA |
|
|
|
|
There are 2 bank entities registered
LEGAL STRUCTURE
Constitution Data
Register Date: 12/02/1981
Current structure data 
Current Legal Form: JOINT STOCK
COMPANY
Current Capital: 150.253,03 €
Legal Aspects
Obligation to fill in Financial Statements: YES
Chamber census: YES (2006)
Listed on a Stock Exchange: NO
B.O.R.M.E.(Official Companies Registry Gazette) ![]()
Registered Proceedings
|
PROCEEDINGS |
DATE |
NOTICE NUM. |
TRADE REG. |
|
Appointments |
15/02/2008 |
84930 |
Málaga |
|
Appointments |
03/05/2007 |
244182 |
Málaga |
|
Declaration of individual ownership |
03/05/2007 |
244181 |
Málaga |
|
Resignations |
03/05/2007 |
244181 |
Málaga |
Other Proceedings published
|
PROCEEDINGS |
DATE |
NOTICE NUM. |
TRADE REG. |
|
Registration of
accounts (2007) Individual |
08/09/2008 |
432572 |
Málaga |
|
Registration of
accounts (2006) Individual |
06/09/2007 |
386498 |
Málaga |
Press articles

07/02/2003 SUR (INFORMATION ON LEGAL ANNOUNCE)
LA JUNTA GRAL. UNIVERSAL DE LEALMA, S.A., CELEBRADA EL DIA 4/2/03, ACORDO
POR UNANIMIDAD, CAMBIAR EL DOMICILIO SOCIAL DE CARRETERA AZUCARERA-INTELHORCE,
N.54, POLIGONO INDUSTRIAL GUADALHORCE, 29004, MALAGA, A C/ ALEJANDRO CASONA,
N.43, POLIGONO INDUSTRIAL GUADALHORCE, 29004 (MALAGA).
There are 1 press releases
FINANCIAL INFORMATION
The information on the last account contained in this report is
extracted from the Mercantile Register file of the legal address of the Company
BALANCE SHEET
Assets
Figures given in €
|
|
31/12/2005 (12) |
31/12/2006 (12) |
31/12/2007 (12) |
|
A) DUE FROM SHAREHOLDERS FOR UNCALLED CAPITAL |
|
|
|
|
B) FIXED ASSETS |
605.771,19 |
986.527,26 |
657.877,28 |
|
I. Incorporation costs |
|
|
|
|
II. Intangible fixed assets |
47.779,53 |
37.200,88 |
29.801,08 |
|
III. Tangible fixed assets |
557.991,66 |
553.714,56 |
534.581,20 |
|
IV. Financial fixed assets |
|
395.611,82 |
93.495,00 |
|
V.Owners equity |
|
|
|
|
VI.Long term trade liabilities |
|
|
|
|
C) DEFERRED EXPENSES |
2.042,26 |
1.682,01 |
435,59 |
|
D) CURRENT ASSETS |
620.251,65 |
3.004.991,60 |
3.572.094,41 |
|
I. Shareholders by required outlays |
|
|
|
|
II. Stocks |
|
|
65.000,00 |
|
III. Debtors |
198.896,80 |
2.509.833,56 |
3.000.230,92 |
|
IV. Temporary financial investment |
|
|
|
|
V. Short-term own shares |
|
|
|
|
VI. Treasury |
421.354,85 |
495.158,04 |
436.863,49 |
|
VII. Periodification adjustments |
|
|
70.000,00 |
|
ASSETS (A + B + C + D) |
1.228.065,10 |
3.993.200,87 |
4.230.407,28 |
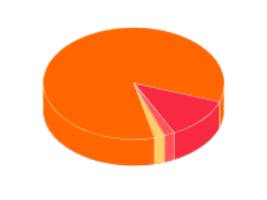
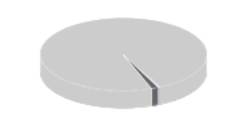
Assets composition
|
|
|
|
|
|
|
Fixed Assets
|
Current Assets
|
Liabilities
Figures given in €
|
|
31/12/2005 (12) |
31/12/2006 (12) |
31/12/2007 (12) |
|
A) SHAREHOLDERS EQUITY |
266.538,51 |
838.681,88 |
1.019.300,10 |
|
I. Share capital |
150.253,03 |
150.253,03 |
150.253,03 |
|
II. Issue bonus |
|
|
|
|
III.Revaluation reserve |
|
|
|
|
IV.Reserves |
72.392,74 |
116.285,48 |
688.428,85 |
|
Capital adjustments in Euros |
|
|
|
|
Sundry reserves |
72.392,74 |
116.285,48 |
688.428,85 |
|
V.Results from previous years |
-224.175,83 |
|
|
|
VI.Profit and Losses |
268.068,57 |
572.143,37 |
180.618,22 |
|
VII.Dividend paid during the year |
|
|
|
|
VIII.Own shares for capital reduction |
|
|
|
|
B) DEFERRED INCOME |
|
|
|
|
C) PROVISIONS FOR LIABILITIES AND EXPENSES |
|
|
|
|
D) LONG TERM LIABILITIES |
322.268,16 |
310.702,45 |
210.400,69 |
|
E) SHORT TERM LIABILITIES |
639.258,43 |
2.843.816,54 |
3.000.706,49 |
|
F) SHORT TERM PROVISIONS FOR LIABILITIES AND
EXPENSES |
|
|
|
|
LIABILITIES (A + B + C + D + E + F) |
1.228.065,10 |
3.993.200,87 |
4.230.407,28 |
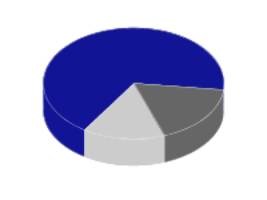
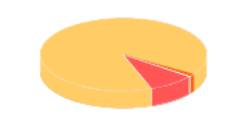
Liabilities Composition
|
|
|
|
|
|
|
Net Worth
|
Payable
Liabilities
|
PROFIT AND LOSS
ACCOUNT
Itams of the Profit and Loss Account
Figures given in €
|
|
31/12/2005 (12) |
31/12/2006 (12) |
31/12/2007 (12) |
|
A) EXPENSES (A.1 a A.15) |
3.024.570,60 |
9.114.505,15 |
6.828.536,55 |
|
A.1.Operating costs |
2.601.531,90 |
7.927.226,67 |
6.005.907,49 |
|
A.2. Labour cost |
23.705,52 |
47.986,49 |
93.792,42 |
|
Wages |
21.562,48 |
42.461,62 |
77.419,56 |
|
Social security expenses |
2.143,04 |
5.524,87 |
16.372,86 |
|
A.3. Assets depreciation |
13.501,80 |
46.808,07 |
26.533,16 |
|
A.4. Variation in provision for current assets |
|
|
|
|
A.5. Other operating costs |
269.442,26 |
805.800,19 |
596.381,41 |
|
A.I. OPERATING RESULT (B.1-A.1-A.2-A.3-A.4-A.5) |
383.875,86 |
844.206,92 |
261.639,03 |
|
A.6.Financial expenses and similar |
1.422,53 |
11.377,67 |
11.159,52 |
|
Debts with related companies |
613,16 |
10.111,43 |
10.365,95 |
|
Debts with associated companies |
|
|
|
|
Other companies debts By debts with third parties and similar expenses |
809,37 |
1.266,24 |
793,57 |
|
Losses from financial investments |
|
|
|
|
A.7. Variation in financial investment provision |
|
|
|
|
A.8.Negative exchange difference |
|
|
6.225,79 |
|
A.II.POSITIVE FINANCIAL RESULTS
(B.2+B.3-A.6-A.7-A.8) |
|
3.242,51 |
7.515,95 |
|
A.III.PROFIT
FROM ORDINARY ACTIVITIES (A.I+A.II-B.I-B.II) |
383.035,16 |
847.449,43 |
269.154,98 |
|
A.9. Variation in
provision in fixed assets |
|
|
|
|
A.10. Losses in
fixed assets |
|
|
|
|
A.11. Losses
from own shares and bonds |
|
|
|
|
A.12.
Extraordinary charges |
80,06 |
|
1.572,43 |
|
A.13.Other
exercises’ expenses and losses |
|
|
|
|
A.IV.POSITIVE EXTRAORDINARY
RESULT (B.4+B.5+B.6+B.7+B.8-A.9-A.10-A.11-A.12-A.13) |
|
|
|
|
A.V.PROFIT
BEFORE TAXES (A.III+A.IV-B.III-B.IV) |
382.955,10 |
847.449,43 |
267.582,55 |
|
A.14.Corporate
Taxes |
114.886,53 |
275.306,06 |
86.964,33 |
|
A.15. Other
taxes |
|
|
|
|
A.VI.EXERCISE
RESULT (PROFIT) (A.V-A.14-A.15) |
268.068,57 |
572.143,37 |
180.618,22 |
|
B) INCOMES (B.1 a B.8) |
3.292.639,17 |
9.686.648,52 |
7.009.154,77 |
|
B.1.Operating income |
3.292.057,34 |
9.672.028,34 |
6.984.253,51 |
|
Turnover |
3.278.162,09 |
9.672.028,34 |
6.984.253,51 |
|
Other operating income |
13.895,25 |
|
|
|
B.I.OPERATING
LOSSES (A.1+A.2+A.3+A.4+A.5-B.1) |
|
|
|
|
B.2.Financial Income |
581,83 |
12.272,21 |
24.901,26 |
|
From affiliated companies |
|
|
|
|
From associated companies |
|
|
|
|
Other |
581,83 |
12.272,21 |
24.901,26 |
|
Gains from investments |
|
|
|
|
B.3. Positive change difference |
|
2.347,97 |
|
|
B.II. NEGATIVE FINANCIAL RESULTS
(A.6+A.7+A.8-B.2-B.3) |
840,70 |
|
|
|
B.III.LOSSES FROM ORDINARY ACTIVITIES
(B.I+B.II-A.I-A.II) |
|
|
|
|
B.4.B.9. Gains from disposal of fixed assets |
|
|
|
|
B.5.Gains from dealing in own shares |
|
|
|
|
B.6. Paid in surplus |
|
|
|
|
B.7. Extraordinary income |
|
|
|
|
B.8.Other year’s income and profits |
|
|
|
|
B.IV.NEGATIVE EXTRAORDINARY LOSSES
(A.9+A.10+A.11+A.12+A.13-B.4-B.5-B.6-B.7-B.8) |
80,06 |
|
1.572,43 |
|
B.V.LOSS BEFORE TAXES (B.III+B.IV-A.III-A.IV) |
|
|
|
|
B.VI.EXERCISE RESULTS (LOSS) (B.V+A.14+A.15) |
|
|
|
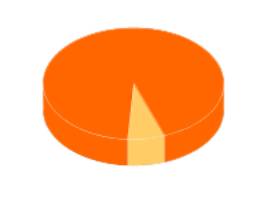
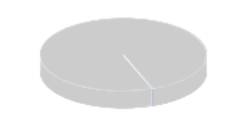
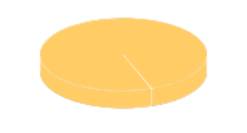
Composition of the Profit and Loss Account
|
|
|
|
Expenses
Structure
|
Operating Costs
|
|
Income Structure
|
Operating income
|
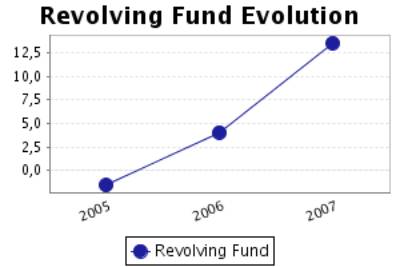
FINANCIAL BALANCE
Here the Main Capital Amounts of the company and the Revolving Fund
Evolution are analysed.
Financial Balance Table
Figures given in €
|
|
31/12/2005 (12) |
% |
31/12/2006 (12) |
% |
31/12/2007 (12) |
% |
|
A) DUE FROM SHAREHOLDERS
FOR UNCALLED CAPITAL |
|
|
|
|
|
|
|
B) FIXED ASSETS |
605.771,19 |
49,33 |
986.527,26 |
24,71 |
657.877,28 |
15,55 |
|
C) DEFERRED
EXPENSES |
2.042,26 |
0,17 |
1.682,01 |
0,04 |
435,59 |
0,01 |
|
D) CURRENT
ASSETS |
620.251,65 |
50,51 |
3.004.991,60 |
75,25 |
3.572.094,41 |
84,44 |
|
ASSETS (A + B +
C + D) |
1.228.065,10 |
|
3.993.200,87 |
|
4.230.407,28 |
|
|
|
||||||
|
A) SHAREHOLDERS
EQUITY |
266.538,51 |
21,70 |
838.681,88 |
21,00 |
1.019.300,10 |
24,09 |
|
B) DEFERRED
INCOME |
|
|
|
|
|
|
|
C) PROVISIONS
FOR LIABILITIES AND EXPENSES |
|
|
|
|
|
|
|
D) LONG TERM
LIABILITIES |
322.268,16 |
26,24 |
310.702,45 |
7,78 |
210.400,69 |
4,97 |
|
E) SHORT TERM
LIABILITIES |
639.258,43 |
52,05 |
2.843.816,54 |
71,22 |
3.000.706,49 |
70,93 |
|
F) SHORT TERM
PROVISIONS FOR LIABILITIES AND EXPENSES |
|
|
|
|
|
|
|
LIABILITIES (A + B + C + D + E + F) |
1.228.065,10 |
|
3.993.200,87 |
|
4.230.407,28 |
|
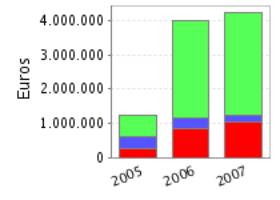
Financial Balance Composition
|
|
|
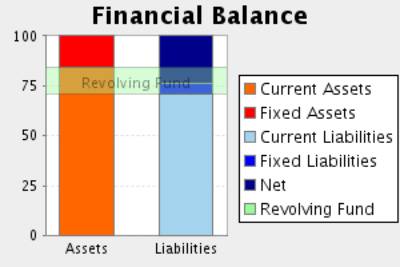
Comments on Financial Balance
In the 2005, the assets of the company were formed in 49,49% of Fixed
Assets and in 50,51% of Current Assets.This assets were financed in 21,70% with
own capitals, and in 26,24% with long term debt and in 52,05% with current
liabilities.
The result of this financial structure is a negative turnover fund of
-19.006,78 Euros, which is equivalent to -1,55% proportion of the company’s
total assets.
In the 2006, the assets of the company were formed in 24,75% of Fixed
Assets and in 75,25% of Current Assets.This assets were financed in 21,00% with
own capitals, and in 7,78% with long term debt and in 71,22% with current
liabilities.
The result of this financial structure is a positive turnover fund of
161.175,06 Euros, which is equivalent to 4,04% proportion of the
company’s total assets.
This measure has increased with respect to the previous exercise in
947,99% having also increased its proportion with respect to the total assets
of the company.
In the 2007, the assets of the company were formed in 15,56% of Fixed
Assets and in 84,44% of Current Assets.This assets were financed in 24,09% with
own capitals, and in 4,97% with long term debt and in 70,93% with current
liabilities.
The result of this financial structure is a positive turnover fund of
571.387,92 Euros, which is equivalent to 13,51% proportion of the
company’s total assets.
This measure has increased with respect to the previous exercise in 254,51%
having also increased its proportion with respect to the total assets of the
company.
RATIOS
Main Ratios
|
|
31/12/2005 (12) |
31/12/2006 (12) |
31/12/2007 (12) |
|
STRUCTURAL RATIOS |
|
|
|
|
Management fund |
-19.006,78 |
161.175,06 |
571.387,92 |
|
Management Fund Requirement |
|
|
148.648,21 |
|
Indebtedness (%) |
78,30 |
79,00 |
75,90 |
|
External Funds on Net Worth |
3,61 |
3,76 |
3,15 |
|
GENERAL ACTIVITY RATIO |
|
|
|
|
Turnover Increase (%) |
207,56 |
195,04 |
-27,79 |
|
Added value growth (%) |
245,85 |
123,00 |
-59,32 |
|
Cash Flow |
281.570,37 |
618.951,44 |
207.151,38 |
|
Labour Productivity |
17,76 |
19,57 |
4,07 |
|
Assets turnover |
2,67 |
2,42 |
1,65 |
|
Breakdown Point |
1.461.941,79 |
4.992.302,62 |
5.116.454,92 |
|
Security Margin of the Breakdown Point (%) |
55,59 |
48,38 |
26,74 |
|
ACTIVITY RATIOS |
|
|
|
|
Average Payment Period |
|
|
173 |
|
Average Collection Period |
22 |
93 |
155 |
|
Inventory Turnover Period |
|
|
3 |
|
SOLVENCY RATIOS |
|
|
|
|
Payback Capacity |
0,29 |
0,20 |
0,06 |
|
Assets Guarantee |
1,28 |
1,26 |
1,32 |
|
Short Term Debts Proportion (%) |
66,48 |
90,15 |
93,45 |
|
Interest Coverage |
197,53 |
53,12 |
16,33 |
|
LIQUIDITY RATIOS |
|
|
|
|
Current Ratio |
0,97 |
1,06 |
1,19 |
|
Immediate liquidity |
0,66 |
0,17 |
0,15 |
|
Treasury |
|
|
422.739,71 |
|
Sales on Current Assets |
1.903 |
1.159 |
704 |
Results Analysis Ratios
|
|
31/12/2005 (12) |
31/12/2006 (12) |
31/12/2007 (12) |
|
Economic profitability (%) |
31,26 |
21,14 |
6,18 |
|
Operating Profitability (%) |
11,71 |
8,73 |
3,75 |
|
Equity gearing |
4,60 |
4,78 |
4,27 |
|
Financial profitability (%) |
100,57 |
68,22 |
17,72 |
|
General Profitability (%) |
8,18 |
5,92 |
2,59 |
Comments on the Results Analysis Ratios
The economic profitability in the year2006 achieved a 21,14% positive
level, due to a 8,73% economic margin and to an assets turnover of2,42%.
The economic profitability in the year has reduced from 31,26% up to 21,14%
of2006, even if it remains positive. This fall is due to the decrease in
operating profitability, that has passe from 11,71% to 8,73%, as assets
turnover whose index has passed from 2,67 to 2,42%.
Financial profitability on 2006 achieved a 68,22%.
The company’s financial structure has instigated its economic
profitability with an indebtedness level of 4,78.
The general profitability on 2006 achieved a 5,92%.
The economic profitability in the year2007 achieved a 6,18% positive
level, due to a 3,75% economic margin and to an assets turnover of1,65%.
The economic profitability in the year has reduced from 21,14% up to
6,18% of2007, even if it remains positive. This fall is due to the decrease in
operating profitability, that has passe from 8,73% to 3,75%, as assets turnover
whose index has passed from 2,42 to 1,65%.
Financial profitability on 2007 achieved a 17,72%.
The company’s financial structure has instigated its economic
profitability with an indebtedness level of 4,27.
The general profitability on 2007 achieved a 2,59%.
SECTORIAL ANLYSIS
Large Capital Amounts and Financial Balance
Figures given in %
|
|
COMPANY (2007) |
SECTOR |
DIFFERENCE |
DIFFERENCE RELATIVE |
|
|
|
|
|
|
ASSETS |
|
|
|
|
|
|
|
|
|
|
A) DUE FROM SHAREHOLDERS
FOR UNCALLED CAPITAL |
|
0,00 |
|
|
|
|
|
|
|
|
B) FIXED ASSETS |
15,55 |
21,78 |
-6,23 |
-28,62 |
|
|
|
|
|
|
C) DEFERRED
EXPENSES |
0,01 |
0,15 |
-0,14 |
-93,51 |
|
|
|
|
|
|
D) CURRENT
ASSETS |
84,44 |
78,06 |
6,38 |
8,17 |
|
|
|
|
|
|
ASSETS (A + B + C + D) |
100 |
100 |
|
|
|
|
|
|
|
|
|
|
|
|
|
|
|
|
|
|
|
|
COMPANY (2007) |
SECTOR |
DIFFERENCE |
DIFFERENCE RELATIVE |
|
|
|
|
|
|
LIABILITIES |
|
|
|
|
|
|
|
|
|
|
A) SHAREHOLDERS EQUITY |
24,09 |
39,22 |
-15,13 |
-38,58 |
|
|
|
|
|
|
B) DEFERRED
INCOME |
|
0,04 |
|
|
|
|
|
|
|
|
C) PROVISIONS
FOR LIABILITIES AND EXPENSES |
|
0,00 |
|
|
|
|
|
|
|
|
D) LONG TERM
LIABILITIES |
4,97 |
7,56 |
-2,59 |
-34,24 |
|
|
|
|
|
|
E) SHORT TERM
LIABILITIES |
70,93 |
53,10 |
17,83 |
33,58 |
|
|
|
|
|
|
F) SHORT TERM
PROVISIONS FOR LIABILITIES AND EXPENSES |
|
0,08 |
|
|
|
|
|
|
|
|
LIABILITIES (A +
B + C + D + E + F) |
100 |
100 |
|
|
|
|
|
|
|
Sectorial Financial Balance Comparison
|
|
|
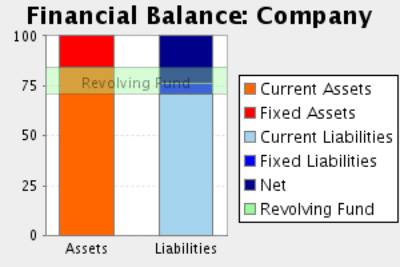
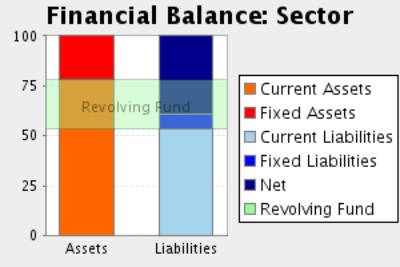
Comments to the Sectorial Analysis
In the 2007, the assets of the company were formed in 15,56% of fixed
assets and in 84,44Current Assets % In the sector, the proportion of fixed
assets was of 21,94%, 29,08% superior, and the proportion of current assets was
of 78,06%, 8,17% inferior.
The assets were financed in the company in 24,09% with own capitals , in
4,97% with fixed liabilities and in 70,93% with current liabilities In the
sector, the self financing represented 39,26%, 38,64% superior. On the other
hand the long term debts represented in the sector an average of 7,56%
financing, with a relative difference of 34,28% favourable to the sectorAnd,
short term liabilities represented in the sector an average of 53,18%
financing, with a relative difference of 33,39% in favour of the company
The result of this company’s financial structure is a turnover fund that
represents 13,51% of the total assets; in the sector, this same proportion is
24,88%, therefore, we can say that the company’s turnover fund is 45,71%
smaller than the sector one.
Analytical Account of Results
Figures given in %
|
|
COMPANY (2007) |
SECTOR |
DIFFERENCE |
DIFFERENCE RELATIVE |
|
Turnover |
100,00 |
99,29 |
0,71 |
0,71 |
|
Other operating income |
|
0,71 |
|
|
|
Production Value |
100,00 |
100,00 |
0,00 |
0,00 |
|
Operating expenses |
85,99 |
69,96 |
16,03 |
22,91 |
|
Other operation expenses |
8,54 |
15,11 |
-6,57 |
-43,50 |
|
Added value |
5,47 |
14,93 |
-9,46 |
-63,35 |
|
Labour cost |
1,34 |
8,78 |
-7,44 |
-84,74 |
|
Gross Economic Result |
4,13 |
6,14 |
-2,01 |
-32,77 |
|
Assets depreciation |
0,38 |
0,94 |
-0,56 |
-59,75 |
|
Variation in provision for current assets and bad debt losses |
|
0,36 |
|
|
|
Net Economic Result |
3,75 |
4,84 |
-1,09 |
-22,54 |
|
Financial income |
0,36 |
0,59 |
-0,23 |
-38,78 |
|
Financial Charges |
0,25 |
1,69 |
-1,44 |
-85,19 |
|
Variation in
financial investment provision |
|
0,03 |
|
|
|
Ordinary
Activities Result |
3,85 |
3,71 |
0,14 |
3,80 |
|
Extraordinary income |
|
0,22 |
|
|
|
Extraordinary charges |
0,02 |
0,18 |
-0,16 |
-88,76 |
|
Variation in provision in fixed assets |
|
0,01 |
|
|
|
Results before Taxes |
3,83 |
3,75 |
0,08 |
2,22 |
|
Corporate taxes |
1,25 |
1,08 |
0,17 |
16,06 |
|
Net Result |
2,59 |
2,67 |
-0,08 |
-3,00 |
|
Assets depreciation |
0,38 |
0,94 |
-0,56 |
-59,75 |
|
Change of Provisions |
|
0,40 |
|
|
|
Net Self-Financing |
2,97 |
4,01 |
-1,04 |
-25,95 |
Main Ratios
|
|
COMPANY (2007) |
PTILE25 |
PTILE50 |
PTILE75 |
|
STRUCTURAL RATIOS |
|
|
|
|
|
Management fund |
571.387,92 |
92,11 |
447,15 |
910,38 |
|
Management Fund
Requirement |
148.648,21 |
-240,20 |
127,65 |
474,27 |
|
Indebtedness (%) |
75,90 |
42,35 |
69,01 |
83,49 |
|
External Funds
on Net Worth |
3,15 |
0,74 |
2,23 |
5,06 |
|
GENERAL ACTIVITY
RATIO |
|
|
|
|
|
Turnover Increase (%) |
-27,79 |
-6,67 |
2,80 |
15,22 |
|
Added value growth (%) |
-59,32 |
-9,36 |
2,01 |
19,36 |
|
Cash Flow |
207.151,38 |
62,05 |
108,68 |
200,01 |
|
Labour Productivity |
4,07 |
1,38 |
1,63 |
2,32 |
|
Assets turnover |
1,65 |
1,29 |
1,80 |
2,41 |
|
Breakdown Point |
5.116.454,92 |
2.461.855,54 |
3.163.613,33 |
4.050.284,99 |
|
Security Margin of the Breakdown Point (%) |
26,74 |
6,46 |
13,22 |
22,30 |
|
ACTIVITY RATIOS |
|
|
|
|
|
Average Payment Period |
173 |
0 |
0 |
0 |
|
Average Collection Period |
155 |
34 |
67 |
108 |
|
Inventory Turnover Period |
3 |
19 |
47 |
87 |
|
SOLVENCY RATIOS |
|
|
|
|
|
Payback Capacity |
0,06 |
0,04 |
0,09 |
0,19 |
|
Assets Guarantee |
1,32 |
1,19 |
1,45 |
2,34 |
|
Short Term Debts Proportion (%) |
93,45 |
83,28 |
98,08 |
100,00 |
|
Interest Coverage |
16,33 |
1,80 |
4,10 |
9,24 |
|
LIQUIDITY RATIOS |
|
|
|
|
|
Current Ratio |
1,19 |
1,05 |
1,32 |
2,03 |
|
Immediate liquidity |
0,15 |
0,05 |
0,20 |
0,51 |
|
Treasury |
422.739,71 |
63,02 |
207,22 |
471,33 |
|
Sales on Current Assets |
704 |
574 |
807 |
1.103 |
Results Analysis Ratios
|
|
COMPANY (2007) |
PTILE25 |
PTILE50 |
PTILE75 |
|
Economic profitability (%) |
6,18 |
3,15 |
5,72 |
10,64 |
|
Operating Profitability (%) |
3,75 |
1,65 |
3,64 |
5,82 |
|
Equity gearing |
4,27 |
1,26 |
1,80 |
3,20 |
|
Financial profitability (%) |
17,72 |
5,28 |
9,92 |
17,16 |
|
General Profitability (%) |
2,59 |
0,71 |
1,61 |
3,10 |
NOTES
The address included in your enquiry belongs to a branch.
FOREIGN EXCHANGE
RATES
|
Currency |
Unit
|
Indian Rupees |
|
US Dollar |
1 |
Rs.47.08 |
|
UK Pound |
1 |
Rs.77.17 |
|
Euro |
1 |
Rs.66.98 |
RATING
EXPLANATIONS
|
RATING |
STATUS |
PROPOSED CREDIT LINE |
|
|
>86 |
Aaa |
Possesses an extremely sound financial base with the strongest
capability for timely payment of interest and principal sums |
Unlimited |
|
71-85 |
Aa |
Possesses adequate working capital. No caution needed for credit transaction.
It has above average (strong) capability for payment of interest and
principal sums |
Large |
|
56-70 |
A |
Financial & operational base are regarded healthy. General unfavourable
factors will not cause fatal effect. Satisfactory capability for payment of
interest and principal sums |
Fairly Large |
|
41-55 |
Ba |
Overall operation is considered normal. Capable to meet normal
commitments. |
Satisfactory |
|
26-40 |
B |
Unfavourable & favourable factors carry similar weight in credit
consideration. Capability to overcome financial difficulties seems
comparatively below average. |
Small |
|
11-25 |
Ca |
Adverse factors are apparent. Repayment of interest and principal sums
in default or expected to be in default upon maturity |
Limited with
full security |
|
<10 |
C |
Absolute credit risk exists. Caution needed to be exercised |
Credit not
recommended |
|
NR |
In view of the lack of information, we have no basis upon which to
recommend credit dealings |
No Rating |
|
This score serves as a reference to assess SC’s credit risk
and to set the amount of credit to be extended. It is calculated from a composite
of weighted scores obtained from each of the major sections of this report. The
assessed factors and their relative weights (as indicated through %) are as
follows:
Financial
condition (40%) Ownership
background (20%) Payment
record (10%)
Credit history
(10%) Market trend
(10%) Operational
size (10%)