![]()
MIRA
INFORM REPORT
|
Report Date : |
30.06.2008 |
IDENTIFICATION
DETAILS
|
Name : |
PLANOS SIDERURGICOS TRANSFORMADOS SL
”PLASITRANS” |
|
|
|
|
Registered Office : |
Calle Acero - Pg Aimayr, 11 28330 San Martin De La
Vega Madrid |
|
|
|
|
Country : |
Spain |
|
|
|
|
Financials (as on) : |
31.12.2006 |
|
|
|
|
Date of Incorporation : |
|
|
|
|
|
Legal Form : |
Sociedad Limitada |
|
|
|
|
Line of Business : |
RATING &
COMMENTS
|
MIRA’s Rating : |
Ba |
|
RATING |
STATUS |
PROPOSED CREDIT LINE |
|
|
41-55 |
Ba |
Overall operation is considered normal. Capable to meet normal
commitments. |
Satisfactory |
|
Maximum Credit Limit : |
694.998,38 € |
|
|
|
|
Status : |
Satisfactory |
|
|
|
|
Payment Behaviour : |
Regular |
|
|
|
|
Litigation : |
Clear |
FINANCIAL REPORT
PLANOS SIDERURGICOS TRANSFORMADOS SL ”PLASITRANS”
TAX NUMBER: B80133036
EXECUTIVE
SUMMARY
Identification
Current Business Name: PLANOS SIDERURGICOS TRANSFORMADOS SL
Commercial Name: PLASITRANS
Other names: NO
Current
Address: CALLE ACERO
- PG AIMAYR, 11, CP 28330, SAN MARTIN DE LA VEGA MADRID
Telephone number: 916917620 Fax: 916917630
URL: www.plasitrans.com
Corporate
e-mail: comercial@plasitrans.com
Commercial Risk
Credit Appraisal: 694.998,38 €
Legal Actions: NO
Financial Information
Latest Balance sheet sales (2006): 28.777.944,07 € (Registro Mercantil)
Result: 363.482,5 €
Total Assets:
20.903.169,98 €
Social Capital: 750.000,24 €
Employees: 35
Commercial Information
Constitution Date: 08/10/1991
Business activity: Wholesale of
iron & steel
NACE Code: 5152
International Operations: Importa y
exporta
Corporate Structure
Administrador único:
Participations: 1
Other Complementary Information
Latest proceeding published in BORME: 05/12/2007 Reelecciones
Bank Entities: Yes
Credit Appraisal
Maximum Credit (from 0 a 6,000,000 €):
694.998,38 €
Financial Situation
Fiscal year2006
|
Treasury |
Media |
|
Indebtedness |
Importante |
|
Profitability |
Media |
|
Balance |
Excelente |
Performance
|
Legal Actions |
Nulas o irrelevantes |
|
Business
Trajectory |
Excelente |
INCIDENTS

Summary
LEGAL ACTIONS: No legal incidences registered
CLAIM FILED AGAINST THE ADMINISTRATION: No administrative
claims registered
AFFECTED BY:
1 Company / Companies in Insolvency Proceedings.
FINANCIAL ELEMENTS AND SECTORIAL
COMPARATIVE
FINANCIAL ELEMENTS
Figures given in €
|
|
2004 (12) |
2005 (12) |
2006 (12) |
% ASSETS |
|
|
|
|
|
|
BALANCE SHEET
ANALYSIS |
|
|
|
|
|
|
|
|
|
|
OWN FUNDS |
2.468.848,45 |
2.693.873,34 |
3.053.195,81 |
14,61 |
|
|
|
|
|
|
DEBT |
9.180.669,41 |
15.968.787,69 |
17.849.974,17 |
85,39 |
|
|
|
|
|
|
FIXED ASSETS |
2.689.416,11 |
2.508.402,79 |
2.663.715,70 |
12,74 |
|
|
|
|
|
|
TOTAL ASSETS |
11.649.517,86 |
18.662.661,03 |
20.903.169,98 |
|
|
|
|
|
|
|
|
|
|
|
|
|
|
|
|
|
|
|
2004 (12) |
2005 (12) |
2006 (12) |
% SALES |
|
|
|
|
|
|
PROFIT AND LOSS
ACCOUNT ANALYSIS |
|
|
|
|
|
|
|
|
|
|
SALES |
15.762.890,64 |
23.984.510,16 |
28.777.944,07 |
|
|
|
|
|
|
|
ADDED VALUE |
2.091.063,42 |
1.450.774,20 |
2.541.177,12 |
8,83 |
|
|
|
|
|
|
EBITDA |
1.171.224,79 |
528.840,66 |
1.316.504,28 |
4,57 |
|
|
|
|
|
|
EBIT |
609.549,17 |
201.481,07 |
716.976,36 |
2,49 |
|
|
|
|
|
|
NET RESULT |
395.341,69 |
229.184,89 |
363.482,50 |
1,26 |
|
|
|
|
|
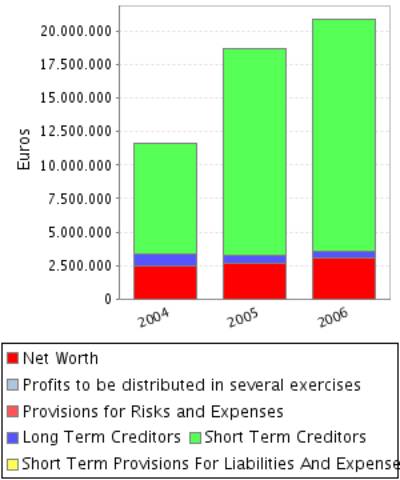
Balance Sheets Items Analysis
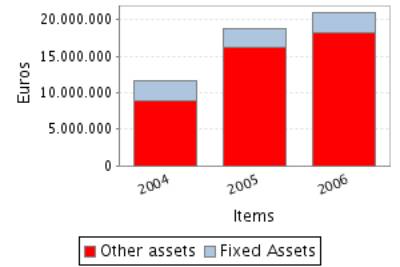
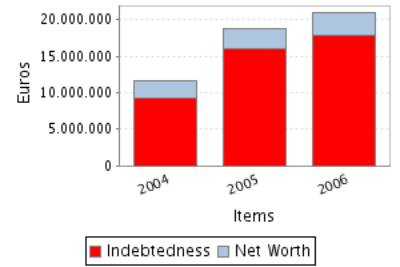
Balance Sheet
Comments
Total assets of the company grew 60,20% between 2004 and 2005.
In spite of the assets’ growth, the fixed assets decreased 6,73%.
This growth has been mainly financed with a debt increase of 73,94%.
Nevertheless the net worth increased 9,11%.
Total assets of the company grew 12,01% between 2005 and 2006.
This growth has been inferior in the case of the fixed assets that
increased just in 6,19%.
This growth has been financed, on a wider scale, with a Shareholders’
equity increase of 13,34% and in a smaller proportion with an debt increase of
11,78%.
Profit and Loss Account Analysis
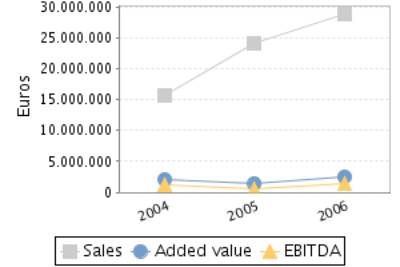
Profit and Loss
Account Comments
The company’s sales figure grew 52,16% between 2004 and 2005.
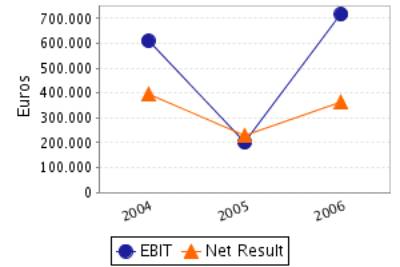
The company’s EBIT decreased in 66,95% between 2004 and 2005.
This evolution implies a reduction in the company’s operating
profitability.
The result of these variations is a decrease of the company’s Economic
Profitability of 79,37% in the analysed period, being this profitability of
1,08% in the year 2005.
The company’s Net Result decreased in 42,03% between 2004 and 2005.
This evolution, compared to the EBIT’s performance, implies that the
financial and extraordinary activities have had a positive effect in the
company’s Financial Profitability.
The result of these variations is a reduction of the company’s
profitability of 46,87% in the analysed period, being equal to 8,51% in the
year 2005.
The company’s sales figure grew 19,99% between 2005 and 2006.
The company’s EBIT grew 255,85% between 2005 and 2006.
This evolution implies an increase in the company’s operating
profitability.
The result of these variations is an increase of the company’s Economic
Profitability of 217,71% in the analysed period, being this profitability of
3,43% in the year 2006.
The company’s Net Result grew 58,60% between 2005 and 2006.
This evolution, compared to the EBIT’s performance, implies that the
financial and extraordinary activities have had a negative effect in the
company’s Financial Profitability.
The result of these variations is an increase of the company’s Economic
Profitability of 39,93% in the analysed period, being equal to 11,90% in the
year 2006.
ANNUAL FINANCIAL REPORT
ADDITIONAL DATA
Source: annual financial report 2006
Results Distribution
Figures given in €
|
DISTRIBUTION
BASE |
DISTRIBUTION TO |
||
|
Profit and Loss |
363.482,50 |
Retained earnings |
0,00 |
|
Carry Over |
0,00 |
Voluntary Reserve |
363.482,50 |
|
Voluntary reserves |
0,00 |
Prior years losses |
0,00 |
|
Reserves |
0,00 |
Carry Over |
0,00 |
|
Other concepts |
0,00 |
Other funds |
0,00 |
|
Total of Amounts to be distributed |
363.482,50 |
Dividends |
0,00 |
|
|
|
Other Applications |
0,00 |
Auditing
Auditors’ opinion: FAVORABLE
Auditor: AUDIT S.L.
COMPARATIVE SECTOR ANALYSIS
Values table
Figures expressed in %
|
|
COMPANY (2006) |
SECTOR |
DIFFERENCE |
DIFFERENCE RELATIVE |
|
|
|
|
|
|
BALANCE SHEET
ANALYSIS: % on the total assets |
|
|
|
|
|
|
|
|
|
|
OWN FUNDS |
14,61 |
38,63 |
-24,02 |
-62,19 |
|
|
|
|
|
|
DEBT |
85,39 |
61,37 |
24,02 |
39,14 |
|
|
|
|
|
|
FIXED ASSETS |
12,74 |
26,96 |
-14,22 |
-52,74 |
|
|
|
|
|
|
|
|
|
|
|
|
|
|
|
|
|
|
COMPANY (2006) |
SECTOR |
DIFFERENCE |
DIFFERENCE RELATIVE |
|
|
|
|
|
|
PROFIT AND LOSS
ACCOUNT ANALYSIS: % on the total operating income |
|
|
|
|
|
|
|
|
|
|
SALES |
99,79 |
99,13 |
0,67 |
0,67 |
|
|
|
|
|
|
ADDED VALUE |
8,81 |
14,14 |
-5,33 |
-37,69 |
|
|
|
|
|
|
EBIT |
2,49 |
5,00 |
-2,51 |
-50,26 |
|
|
|
|
|
|
NET RESULT |
1,26 |
3,28 |
-2,02 |
-61,55 |
|
|
|
|
|
Sector Composition
Compared sector (NACE): 515
Number of companies: 889
Size (Sales Figure) : 7.000.000,00 -
40.000.000,00 Euros
Comments on the
sectorial comparative
Compared to its sector the assets of the companies show an inferior
proportion of fixed assets. Specifically the difference with the sector average
is -14,22% , which means a relative difference of -52,74% .
In liabilities composition the company appeals on a wider scale to self
financing, being the proportion of net worth of 24,02% inferior, which means a
relative difference of 62,19% 24,02% more than the sector, which means a
difference of 39,14% .
The proportion that the sales mean to the company’s total ordinary
income is 99,79%, 0,67% higher than in the sector, which means a relative
difference of 0,67% .
The company’s EBIT was positive and was 2,49% with regard to the total
ordinary income, 2,51% less than the sector, which means a relative difference
of 50,26% .
The company’s capacity to generate operating income is equal to that of
the sector as its ratio EBIT/Sales is also equal.
The company’s net result was positive and equal to 1,26% with regard to
the total ordinary income, 2,02% less than the sector, which means a relative
difference of 61,55% .
The financial and extraordinary results and the tax impact have had a
negative impact on the Net result in the company with a worse behaviour than in
the sector; as a consequence, the company shows a worse Net Result/EBIT ratio
(REBEmpresa vs. REBSector).
ADDRESSES
Current Legal Seat Address:
CALLE ACERO - PG AIMAYR, 11
28330 SAN MARTIN DE LA VEGA MADRID
Previous Seat Address:
POLIGONO INDUSTRIAL VALDONAIRE CALLE HUELVA, 12
28970
HUMANES DE MADRID MADRID
Characteristics of
the current address
Type of premises: fábrica
Property: atribuido en
propiedad sin confirmación oficial
CORPORATE STRUCTURE
ADMINISTRATIVE LINKS
Main Board members,
Directors and Auditor ![]()
|
POSITION |
SURNAMES AND
NAME |
APPOINTMENT DATE |
|
|
ADMINISTRADOR ÚNICO |
HERNANDEZ IMAZ JOSE MIGUEL |
26/10/1999 |
|
|
AUDITOR |
APPOINTMENT DATE |
||
|
AUDIT SL |
05/12/2007 |
||
Functional Managers
|
POSITION |
SURNAMES AND
NAME |
|
Gerente |
HERNANDEZ IMAZ JOSE MIGUEL |
|
Director financiero |
DEL MONTE BENANCIO |
FINANCIAL LINKS
|
|
BUSINESS NAME |
CIF / COUNTRY |
% |
SOURCE |
DATA INF. |
|
|
HERNANDEZ IMAZ JOSE MIGUEL |
ESPAÑA |
Indet. |
F.PROPIAS |
21/04/2008 |
|
|
HERNANDEZ AGUIRRE MIGUEL |
ESPAÑA |
Indet. |
F.PROPIAS |
21/04/2008 |
|
|
BUSINESS NAME |
CIF / COUNTRY |
% |
SOURCE |
DATA INF. |
|
|
PLANCOIL S.A. |
ESPAÑA |
Indet. |
F.PROPIAS |
02/04/2008 |
CREDIT INFORMATION
Constitution Date: 08/10/1991
Business activity 
Activity: Wholesale of iron & steel
NACE Code: 5152
NACE Activity: Wholesale of metals and metal ores
Business: COMERCIO Y TRANSFORMACION DE HIERROS, MATERIALES
FERRICOS Y SUS DERIVADOS.
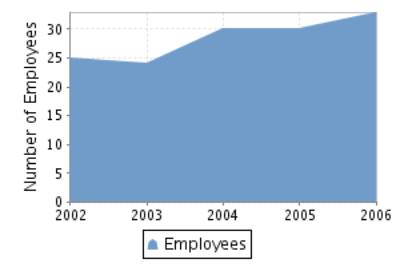
Employees 
Number of total employees: 35 (2008)
Number of fixed employees: 100,00%
Number of temporary employees: 0,00%
Employees evolution
COMMERCIAL OPERATIONS 
|
ENTITY |
BRANCH |
ADDRESS |
TOWN OR CITY |
PROVINCE |
|
BANCO BILBAO VIZCAYA ARGENTARIA, S.A. |
4036 |
ANTONIO LOPEZ, 59 |
280790001 |
Madrid |
|
BANCO SANTANDER, S.A. |
5190 |
CL ANTONIO HERNANDEZ 4 APDO. 00000 |
280920001 |
Madrid |
|
BANCO DE SABADELL, S.A. |
|
|
FUENLABRADA |
|
|
CAJA DE AHORROS Y M.P. DE ZARAGOZA, ARAGON Y RIOJA |
|
|
FUENLABRADA |
|
|
BANCO ESPAÑOL DE CREDITO, S.A. |
|
|
PARLA |
|
8 bank entities registered
Brands, Signs and
Commercial Names ![]()
ANAGRAM: PLASITRANS
LEGAL STRUCTURE
Constitution Data
Register Date: 08/10/1991
Register town: Madrid
Announcement number: 247157
Legal form: SOCIEDAD LIMITADA
Social Capital: 3.005,06 €
Current Legal Form: SOCIEDAD LIMITADA
Current Capital: 750.000,24 €
Legal Aspects
Obligation to fill in Financial
Statements: YES
Chamber census: YES (2006)
Listed on a Stock Exchange: NO
B.O.R.M.E.(Official Companies
Registry Gazette) 
Registered Proceedings
|
PROCEEDINGS |
DATE |
NOTICE NUM. |
TRADE REG. |
|
Reelecciones |
05/12/2007 |
607034 |
Madrid |
|
Reelecciones |
03/11/2006 |
526647 |
Madrid |
Other Proceedings published
|
PROCEEDINGS |
DATE |
NOTICE NUM. |
TRADE REG. |
|
Depósito de cuentas (2006) Individual |
16/10/2007 |
841053 |
Madrid |
|
Depósito de cuentas (2005) Individual |
13/11/2006 |
866179 |
Madrid |
|
Depósito de cuentas (2004) Individual |
14/11/2005 |
918596 |
Madrid |
FINANCIAL INFORMATION
The information on the last account contained in this report is
extracted from the Mercantile Register file of the legal address of the Company
and dated 15/11/2007.
BALANCE SHEET
Assets
Figures given in €
|
|
31/12/2004 (12) |
31/12/2005 (12) |
31/12/2006 (12) |
|
A) ACCIONISTAS (SOCIOS) POR DESEMBOLSOS NO
EXIGIDOS |
|
|
|
|
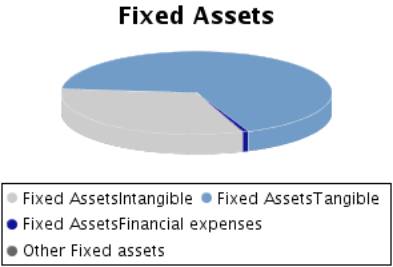
B) INMOVILIZADO |
2.689.416,11 |
2.508.402,79 |
2.663.715,70 |
|
I. Gastos de establecimiento |
|
|
|
|
II. Inmovilizaciones inmateriales |
955.114,95 |
804.184,27 |
857.373,20 |
|
Gastos de investigación y desarrollo |
|
|
|
|
Concesiones, patentes, licencias, marcas y similares |
|
|
|
|
Fondo de comercio |
|
|
|
|
Derechos de traspaso |
|
|
|
|
Aplicaciones informáticas |
23.078,47 |
23.078,47 |
23.948,47 |
|
Derechos s/bienes en régimen de arrendamiento financiero |
1.228.877,80 |
1.102.132,78 |
1.222.812,45 |
|
Anticipos |
|
|
|
|
Provisiones |
|
|
|
|
Amortizaciones |
-296.841,32 |
-321.026,98 |
-389.387,72 |
|
III. Inmovilizaciones materiales |
1.717.085,92 |
1.685.215,92 |
1.788.670,36 |
|
Terrenos y construcciones |
1.218.118,26 |
898.813,62 |
898.813,62 |
|
Instalaciones técnicas y maquinaria |
1.383.060,16 |
1.659.675,10 |
1.959.213,34 |
|
Otras instalaciones, utillaje y mobiliario |
182.316,60 |
149.672,66 |
149.672,66 |
|
Anticipos e inmovilizaciones materiales en curso |
|
|
|
|
Otro inmovilizado |
111.200,70 |
120.202,30 |
195.160,21 |
|
Provisiones |
|
|
|
|
Amortizaciones |
-1.177.609,80 |
-1.143.147,76 |
-1.414.189,47 |
|
IV. Inmovilizaciones financieras |
17.215,24 |
19.002,60 |
17.672,14 |
|
Participaciones en empresas del grupo |
|
|
|
|
Créditos a empresas del grupo |
|
|
|
|
Participaciones en empresas asociadas |
|
|
|
|
Créditos a empresas asociadas |
|
|
|
|
Cartera de valores a largo plazo |
8.962,40 |
10.749,76 |
10.702,77 |
|
Otros créditos |
|
|
|
|
Depósitos y fianzas constituidos a largo plazo |
8.252,84 |
8.252,84 |
6.969,37 |
|
Provisiones |
|
|
|
|
Administraciones Públicas a largo plazo |
|
|
|
|
V. Acciones propias |
|
|
|
|
VI. Deudores por operaciones de tráfico a largo
plazo |
|
|
|
|
C) GASTOS A DISTRIBUIR EN VARIOS EJERCICIOS |
30.851,02 |
19.937,06 |
20.408,78 |
|
D) ACTIVO CIRCULANTE |
8.929.250,73 |
16.134.321,18 |
18.219.045,50 |
|
I. Accionistas por desembolsos exigidos |
|
|
|
|
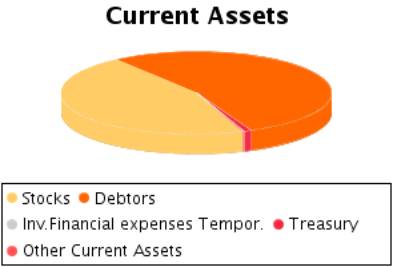
II. Existencias |
3.968.484,09 |
5.084.603,23 |
8.288.868,19 |
|
Comerciales |
3.968.484,09 |
5.084.603,23 |
7.481.334,55 |
|
Materias primas
y otros aprovisionamientos |
|
|
|
|
Productos en
curso y semiterminados |
|
|
|
|
Productos
terminados |
|
|
|
|
Subproductos
residuos y materiales recuperados |
|
|
|
|
Anticipos |
|
|
807.533,64 |
|
Provisiones |
|
|
|
|
III. Deudores |
4.902.838,35 |
11.016.860,14 |
9.726.509,77 |
|
Clientes por
ventas y prestaciones de servicios |
5.236.532,64 |
11.379.663,57 |
9.671.417,67 |
|
Empresas del
grupo, deudores |
|
|
|
|
Empresas
asociadas, deudores |
|
|
96.162,00 |
|
Deudores varios |
32.412,68 |
32.010,33 |
65.993,48 |
|
Personal |
6.715,24 |
4.557,50 |
|
|
Administraciones Públicas |
|
|
552.415,45 |
|
Provisiones |
-372.822,21 |
-399.371,26 |
-659.478,83 |
|
IV. Inversiones financieras temporales |
232,14 |
1.296,89 |
|
|
Participaciones en empresas del grupo |
|
|
|
|
Créditos a empresas del grupo |
|
|
|
|
Participaciones en empresas asociadas |
|
|
|
|
Créditos a empresas asociadas |
232,14 |
|
|
|
Cartera de valores a corto plazo |
|
|
|
|
Otros créditos |
|
|
|
|
Depósitos y fianzas constituidos a corto plazo |
|
1.296,89 |
|
|
Provisiones |
|
|
|
|
V. Acciones propias a corto plazo |
47.454,02 |
|
|
|
VI. Tesorería |
10.242,13 |
24.769,74 |
156.119,09 |
|
VII. Ajustes por periodificación |
|
6.791,18 |
47.548,45 |
|
TOTAL ACTIVO (A + B + C + D) |
11.649.517,86 |
18.662.661,03 |
20.903.169,98 |
Assets composition
Liabilities
Figures given in €
|
|
31/12/2004 (12) |
31/12/2005 (12) |
31/12/2006 (12) |
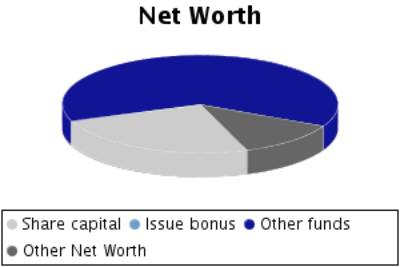
|
A) FONDOS PROPIOS |
2.423.631,73 |
2.652.816,62 |
3.016.299,09 |
|
I. Capital suscrito |
750.000,24 |
750.000,24 |
750.000,24 |
|
II. Prima de emisión |
|
|
|
|
III. Reserva de revalorización |
|
|
|
|
IV. Reservas |
1.278.289,80 |
1.673.631,49 |
1.902.816,35 |
|
Reserva legal |
150.000,05 |
150.000,05 |
150.000,05 |
|
Reservas para
acciones propias |
|
|
|
|
Reservas para
acciones de la sociedad dominante |
|
|
|
|
Reservas
estatutarias |
|
|
|
|
Otras reservas |
1.128.289,75 |
1.523.631,44 |
1.752.816,30 |
|
Diferencias por
ajuste del capital a euros |
|
|
|
|
V. Resultados de
ejercicios anteriores |
|
|
|
|
Remanente |
|
|
|
|
Resultados
negativos de ejercicios anteriores |
|
|
|
|
Aportaciones de
socios para compensación de pérdidas |
|
|
|
|
VI. Pérdidas y
Ganancias (beneficio o pérdida) |
395.341,69 |
229.184,89 |
363.482,50 |
|
VII. Dividendo a
cuenta entregado en el ejercicio |
|
|
|
|
VIII. Acciones
propias para reducción de capital |
|
|
|
|
B) INGRESOS A
DISTRIBUIR EN VARIOS EJERCICIOS |
45.216,72 |
41.056,72 |
36.896,72 |
|
Subvenciones de
capital |
45.216,72 |
41.056,72 |
36.896,72 |
|
Diferencias
positivas de cambio |
|
|
|
|
Otros ingresos a
distribuir en varios ejercicios |
|
|
|
|
Ingresos
fiscales a distribuir en varios ejercicios |
|
|
|
|
C) PROVISIONES
PARA RIESGOS Y GASTOS |
|
|
|
|
Provisiones para
pensiones y obligaciones similares |
|
|
|
|
Provisiones para
impuestos |
|
|
|
|
Otras provisiones |
|
|
|
|
Fondo de reversión |
|
|
|
|
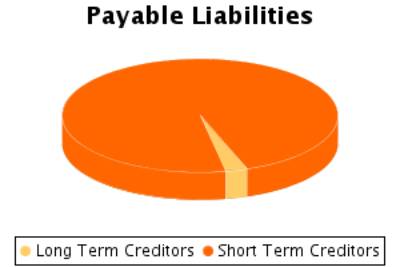
D) ACREEDORES A LARGO PLAZO |
894.340,06 |
597.191,97 |
461.708,71 |
|
I. Emisiones de obligaciones y otros valores
negociables |
|
|
|
|
Obligaciones no convertibles |
|
|
|
|
Obligaciones convertibles |
|
|
|
|
Otras deudas representadas en valores negociables |
|
|
|
|
II. Deudas con entidades de crédito |
619.604,82 |
597.191,97 |
235.344,87 |
|
Deudas a largo plazo con entidades de crédito |
232.259,82 |
373.643,90 |
98.665,28 |
|
Acreedores por arrendamiento financiero a largo plazo |
387.345,00 |
223.548,07 |
136.679,59 |
|
III. Deudas con empresas del grupo y asociadas |
|
|
|
|
Deudas con empresas del grupo |
|
|
|
|
Deudas con
empresas asociadas |
|
|
|
|
IV. Otros
acreedores |
274.735,24 |
|
226.363,84 |
|
Deudas
representadas por efectos a pagar |
|
|
|
|
Otras deudas |
274.735,24 |
|
|
|
Fianzas y
depósitos recibidos a largo plazo |
|
|
|
|
Administraciones
Públicas a largo plazo |
|
|
226.363,84 |
|
V. Desembolsos
pendientes sobre acciones no exigidos |
|
|
|
|
De empresas del
grupo |
|
|
|
|
De empresas
asociadas |
|
|
|
|
De otras
empresas |
|
|
|
|
VI. Acreedores
por operaciones de tráfico a largo plazo |
|
|
|
|
E) ACREEDORES A
CORTO PLAZO |
8.286.329,35 |
15.371.595,72 |
17.388.265,46 |
|
I. Emisiones de
obligaciones y otros valores negociables |
|
|
|
|
Obligaciones no
convertibles |
|
|
|
|
Obligaciones
convertibles |
|
|
|
|
Otras deudas
representadas en valores negociables |
|
|
|
|
Intereses de
obligaciones y otros valores |
|
|
|
|
II. Deudas con
entidades de crédito |
4.063.101,90 |
8.390.101,55 |
9.843.639,10 |
|
Préstamos y
otras deudas |
3.834.986,90 |
8.179.267,55 |
9.583.596,18 |
|
Deudas por intereses |
|
|
|
|
Acreedores por
arrendamiento financiero a corto plazo |
228.115,00 |
210.834,00 |
260.042,92 |
|
III. Deudas con
empresas del grupo y asociadas a corto plazo |
|
|
|
|
Deudas con
empresas del grupo |
|
|
|
|
Deudas con
empresas asociadas |
|
|
|
|
IV. Acreedores
comerciales |
4.006.381,47 |
6.349.435,21 |
7.360.543,66 |
|
Anticipos
recibidos por pedidos |
|
2.089,40 |
2.089,40 |
|
Deudas por
compras o prestaciones de servicios |
4.006.381,47 |
6.308.351,29 |
7.155.613,26 |
|
Deudas
representadas por efectos a pagar |
|
38.994,52 |
202.841,00 |
|
V. Otras deudas
no comerciales |
216.845,98 |
632.058,96 |
173.580,64 |
|
Administraciones Públicas |
185.560,15 |
619.778,56 |
142.654,18 |
|
Deudas
representadas por efectos a pagar |
|
|
|
|
Otras deudas |
31.285,83 |
10.589,40 |
8.925,54 |
|
Remuneraciones
pendientes de pago |
|
1.691,00 |
22.000,92 |
|
Fianzas y
depósitos recibidos a corto plazo |
|
|
|
|
VI. Provisiones
para operaciones de tráfico |
|
|
|
|
VII. Ajustes por
periodificación |
|
|
10.502,06 |
|
F) PROVISIONES
PARA RIESGOS Y GASTOS A CORTO PLAZO |
|
|
|
|
TOTAL PASIVO (A + B + C + D + E + F) |
11.649.517,86 |
18.662.661,03 |
20.903.169,98 |
Liabilities
Composition
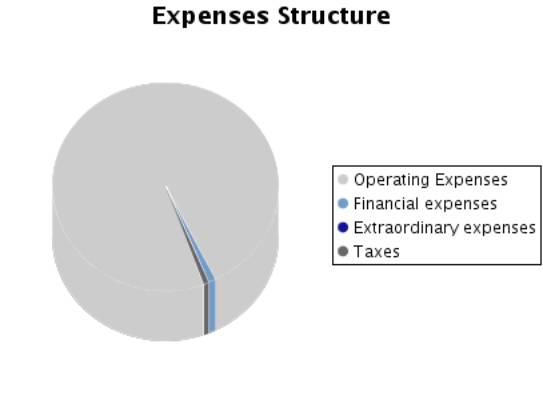
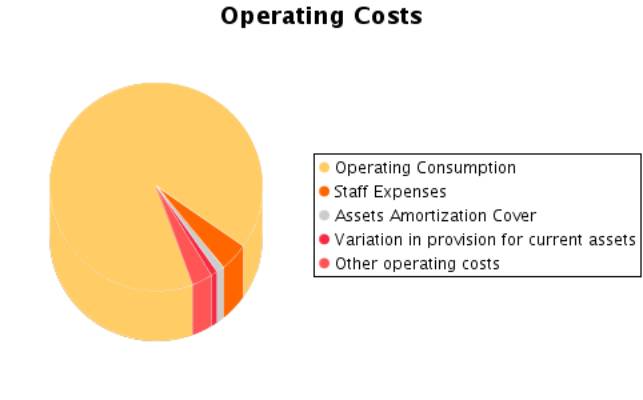
PROFIT AND LOSS ACCOUNT
Itams of the Profit
and Loss Account
Figures given in €
|
|
31/12/2004 (12) |
31/12/2005 (12) |
31/12/2006 (12) |
|
A) GASTOS (A.1 a A.16) |
15.577.611,40 |
24.143.962,52 |
28.619.543,24 |
|
A.1. Reducción de existencias de productos
terminados y en curso de fabricación |
|
|
|
|
A.2. Aprovisionamientos |
13.075.008,66 |
21.815.179,08 |
25.399.169,92 |
|
Consumo de mercaderías |
12.788.406,05 |
21.229.938,96 |
24.678.268,54 |
|
Consumo de materias primas y otras materias consumibles |
|
|
|
|
Otros gastos externos |
286.602,61 |
585.240,12 |
720.901,38 |
|
A.3. Gastos de personal |
919.838,63 |
921.933,54 |
1.224.672,84 |
|
Sueldos, salarios y asimilados |
766.332,99 |
750.044,75 |
988.684,15 |
|
Cargas sociales |
153.505,64 |
171.888,79 |
235.988,69 |
|
A.4. Dotaciones para amortizaciones de
inmovilizado |
305.584,03 |
300.810,54 |
339.383,16 |
|
A.5. Variación de las provisiones de tráfico |
256.091,59 |
26.549,05 |
260.144,76 |
|
Variación de provisiones de existencias |
|
|
|
|
Variación de
provisiones y pérdidas de créditos incobrables |
256.091,59 |
26.549,05 |
260.144,76 |
|
Variación de
otras provisiones de tráfico |
|
|
|
|
A.6. Otros
gastos de explotación |
659.329,07 |
790.496,21 |
896.766,17 |
|
Servicios
exteriores |
646.144,16 |
781.353,31 |
889.509,89 |
|
Tributos |
13.184,91 |
9.142,90 |
7.256,28 |
|
Otros gastos de
gestión corriente |
|
|
|
|
Dotación al
fondo de reversión |
|
|
|
|
A.I. BENEFICIOS
DE EXPLOTACION (B.1+B.2+B.3+B.4-A.1-A.2-A.3-A.4-A.5-A.6) |
609.549,17 |
201.481,07 |
716.976,36 |
|
A.7. Gastos
financieros y gastos asimilados |
139.094,27 |
216.411,48 |
277.545,66 |
|
Por deudas con
empresas del grupo |
|
|
|
|
Por deudas con
empresas asociadas |
|
|
|
|
Por otras deudas
Por deudas con terceros y gastos asimilados |
139.094,27 |
216.411,48 |
277.545,66 |
|
Pérdidas de
inversiones financieras |
|
|
|
|
A.8. Variación
de las provisiones de inversiones financieras |
|
|
|
|
A.9. Diferencias
negativas de cambio |
|
|
|
|
A.II. RESULTADOS
FINANCIEROS POSITIVOS (B.5+B.6+B.7+B.8-A.7-A.8-A.9) |
|
|
|
|
A.III.
BENEFICIOS DE LAS ACTIVIDADES ORDINARIAS (A.I+A.II-B.I-B.II) |
600.208,77 |
128.414,31 |
575.126,65 |
|
A.10. Variación
de las provisiones de inmovilizado inmaterial, material y cartera de control |
|
|
|
|
A.11. Pérdidas procedentes del inmovilizado
inmaterial, material y cartera de control |
9.365,28 |
|
|
|
A.12. Pérdidas por operaciones con acciones y
obligaciones propias |
|
|
|
|
A.13. Gastos extraordinarios |
423,57 |
177,26 |
763,16 |
|
A.14. Gastos y
pérdidas de otros ejercicios |
|
|
25.376,22 |
|
A.IV. RESULTADOS
EXTRAORDINARIOS POSITIVOS (B.9+B.10+B.11+B.12+B.13-A.10-A.11-A.12-A.13-A.14) |
8.009,22 |
173.175,94 |
|
|
A.V. BENEFICIOS
ANTES DE IMPUESTOS (A.II+A.IV-B.III-B.IV.) |
608.217,99 |
301.590,25 |
559.203,85 |
|
A.15. Impuesto
sobre Sociedades |
212.876,30 |
72.405,36 |
195.721,35 |
|
A.16. Otros impuestos |
|
|
|
|
A.VI. RESULTADO DEL EJERCICIO (BENEFICIOS)
(A.V-A.15-A.16) |
395.341,69 |
229.184,89 |
363.482,50 |
|
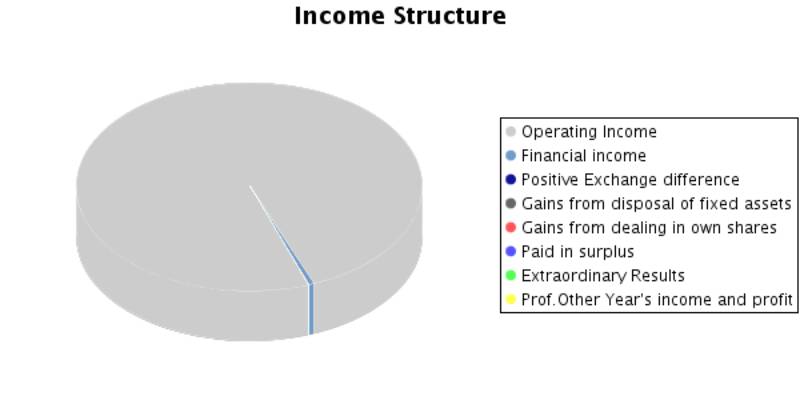
B) INGRESOS (B.1 a B.13) |
15.972.953,09 |
24.373.147,41 |
28.983.025,74 |
|
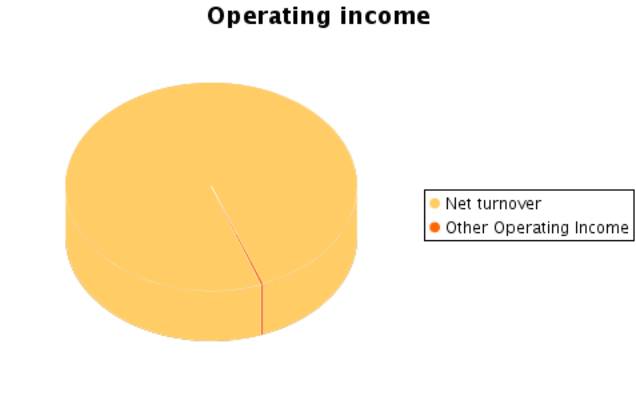
B.1. Importe neto de la cifra de negocios |
15.762.890,64 |
23.984.510,16 |
28.777.944,07 |
|
Ventas |
15.762.890,64 |
23.984.510,16 |
28.777.944,07 |
|
Prestaciones de servicios |
|
|
|
|
Devoluciones y “rappels” sobre ventas |
|
|
|
|
B.2. Aumento de
existencias de productos terminados y en curso de fabricación |
|
|
|
|
B.3. Trabajos
efectuados por la empresa para el inmovilizado |
|
|
|
|
B.4. Otros
ingresos de explotación |
62.510,51 |
71.939,33 |
59.169,14 |
|
Ingresos
accesorios y otros de gestión corriente |
62.510,51 |
71.939,33 |
59.169,14 |
|
Subvenciones |
|
|
|
|
Exceso de
provisiones de riesgos y gastos |
|
|
|
|
B.I. PÉRDIDAS DE
EXPLOTACIÓN (A.1+A.2+A.3+A.4+A.5+A.6-B.1-B.2-B.3-B.4) |
|
|
|
|
B.5. Ingresos de
participaciones en capital |
|
453,67 |
746,95 |
|
En empresas del
grupo |
|
|
|
|
En empresas
asociadas |
|
453,67 |
746,95 |
|
En empresas
fuera del grupo |
|
|
|
|
B.6. Ingresos de
otros valores negociables y de créditos del activo inmovilizado |
|
|
|
|
De empresas del
grupo |
|
|
|
|
De empresas
asociadas |
|
|
|
|
De empresas
fuera del grupo |
|
|
|
|
B.7. Otros
intereses e ingresos asimilados |
129.753,87 |
142.890,85 |
134.949,00 |
|
De empresas del
grupo |
|
|
|
|
De empresas
asociadas |
|
|
|
|
Otros intereses |
129.753,87 |
142.890,85 |
134.949,00 |
|
Beneficios en
inversiones financieras |
|
|
|
|
B.8. Diferencias
positivas de cambio |
|
0,20 |
|
|
B.II. RESULTADOS
FINANCIEROS NEGATIVOS (A.7+A.8+A.9-B.5-B.6-B.7-B.8) |
9.340,40 |
73.066,76 |
141.849,71 |
|
B.III. PÉRDIDAS
DE LAS ACTIVIDADES ORDINARIAS (B.I+B.II-A.I-A.II) |
|
|
|
|
B.9. Beneficios
en enajenación de inmovilizado inmaterial, material y cartera de control |
6.951,50 |
160.527,53 |
|
|
B.10. Beneficios
por operaciones con acciones y obligaciones propias |
|
|
|
|
B.11.
Subvenciones de capital transferidas al resultado del ejercicio |
4.160,00 |
4.160,00 |
4.160,00 |
|
B.12. Ingresos
extraordinarios |
6.686,57 |
8.665,67 |
5.493,48 |
|
B.13. Ingresos y
beneficios de otros ejercicios |
|
|
563,10 |
|
B.IV. RESULTADOS
EXTRAORDINARIOS NEGATIVOS (A.10+A.11+A.12+A.13+A.14-B.9-B.10-B.11-B.12-B.13) |
|
|
15.922,80 |
|
B.V. PÉRDIDAS ANTES DE IMPUESTOS
(B.III+B.IV-A.III-A.IV) |
|
|
|
|
B.VI. RESULTADO DEL EJERCICIO (PERDIDAS)
(B.V+A.15+A.16) |
|
|
|
Composition of the
Profit and Loss Account
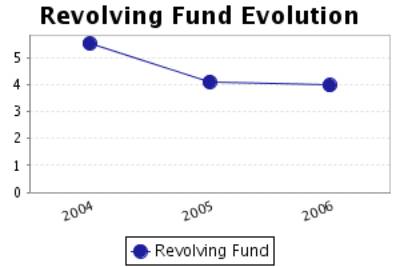
FINANCIAL BALANCE
Here the Main Capital Amounts of the company and the Revolving Fund
Evolution are analysed.
Financial Balance
Table
Figures given in €
|
|
31/12/2004 (12) |
% |
31/12/2005 (12) |
% |
31/12/2006 (12) |
% |
|
A) ACCIONISTAS (SOCIOS) POR DESEMBOLSOS NO EXIGIDOS |
|
|
|
|
|
|
|
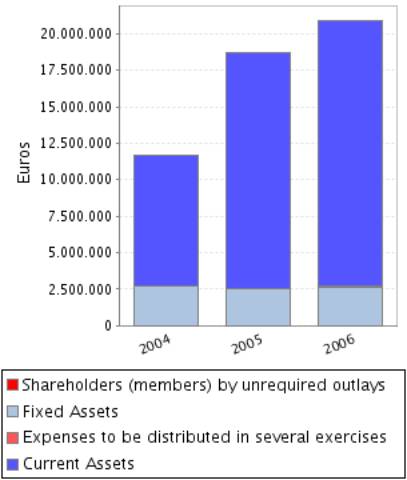
B) INMOVILIZADO |
2.689.416,11 |
23,09 |
2.508.402,79 |
13,44 |
2.663.715,70 |
12,74 |
|
C) GASTOS A DISTRIBUIR EN VARIOS EJERCICIOS |
30.851,02 |
0,26 |
19.937,06 |
0,11 |
20.408,78 |
0,10 |
|
D) ACTIVO CIRCULANTE |
8.929.250,73 |
76,65 |
16.134.321,18 |
86,45 |
18.219.045,50 |
87,16 |
|
TOTAL ACTIVO (A + B + C + D) |
11.649.517,86 |
|
18.662.661,03 |
|
20.903.169,98 |
|
|
|
||||||
|
A) FONDOS PROPIOS |
2.423.631,73 |
20,80 |
2.652.816,62 |
14,21 |
3.016.299,09 |
14,43 |
|
B) INGRESOS A DISTRIBUIR EN VARIOS EJERCICIOS |
45.216,72 |
0,39 |
41.056,72 |
0,22 |
36.896,72 |
0,18 |
|
C) PROVISIONES PARA RIESGOS Y GASTOS |
|
|
|
|
|
|
|
D) ACREEDORES A LARGO PLAZO |
894.340,06 |
7,68 |
597.191,97 |
3,20 |
461.708,71 |
2,21 |
|
E) ACREEDORES A CORTO PLAZO |
8.286.329,35 |
71,13 |
15.371.595,72 |
82,37 |
17.388.265,46 |
83,18 |
|
F) PROVISIONES PARA RIESGOS Y GASTOS A CORTO PLAZO |
|
|
|
|
|
|
|
TOTAL PASIVO (A + B + C + D + E + F) |
11.649.517,86 |
|
18.662.661,03 |
|
20.903.169,98 |
|
Financial Balance
Composition
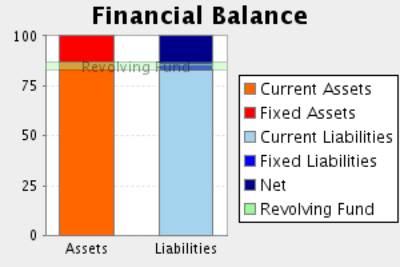
Comments on Financial
Balance
In the 2004, the assets of the company were formed in 23,35% of Fixed
Assets and in 76,65% of Current Assets.This assets were financed in 21,19% with
own capitals, and in 7,68% with long term debt and in 71,13% with current
liabilities.
The result of this financial structure is a positive turnover fund of
642.921,38 Euros, which is equivalent to 5,52% proportion of the
company’s total assets.
In the 2005, the assets of the company were formed in 13,55% of Fixed
Assets and in 86,45% of Current Assets.This assets were financed in 14,43% with
own capitals, and in 3,20% with long term debt and in 82,37% with current
liabilities.
The result of this financial structure is a positive turnover fund of
762.725,46 Euros, which is equivalent to 4,09% proportion of the
company’s total assets.
This measure has increased with respect to the previous exercise in
18,63% having, however, diminished its proportion with respect to the total
assets of the company.
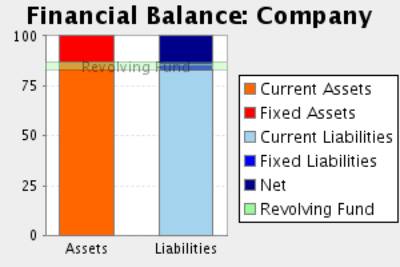
In the 2006, the assets of the company were formed in 12,84% of Fixed
Assets and in 87,16% of Current Assets.This assets were financed in 14,61% with
own capitals, and in 2,21% with long term debt and in 83,18% with current
liabilities.
The result of this financial structure is a positive turnover fund of
830.780,04 Euros, which is equivalent to 3,97% proportion of the
company’s total assets.
This measure has increased with respect to the previous exercise in
8,92% having, however, diminished its proportion with respect to the total
assets of the company.
RATIOS
Main Ratios
|
|
31/12/2004 (12) |
31/12/2005 (12) |
31/12/2006 (12) |
|
STRUCTURAL RATIOS |
|
|
|
|
Fondo maniobra |
642.921,38 |
762.725,46 |
830.780,04 |
|
Necesidad fondo maniobra |
4.648.094,99 |
9.126.760,38 |
10.518.300,05 |
|
Endeudamiento (%) |
78,81 |
85,56 |
85,39 |
|
Fondos ajenos sobre fondos propios |
3,72 |
5,93 |
5,85 |
|
GENERAL ACTIVITY RATIO |
|
|
|
|
Crecimiento de la cifra de negocio (%) |
37,86 |
52,16 |
19,99 |
|
Crecimiento valor añadido (%) |
62,64 |
-30,62 |
75,16 |
|
Cash flow |
957.017,31 |
556.544,48 |
963.010,42 |
|
Productividad de la mano de obra |
2,27 |
1,57 |
2,08 |
|
Rotación de activos |
1,35 |
1,28 |
1,38 |
|
Punto muerto |
12.318.134,40 |
21.893.872,78 |
22.823.189,56 |
|
Margen de seguridad del punto muerto (%) |
22,16 |
8,99 |
20,86 |
|
ACTIVITY RATIOS |
|
|
|
|
Periodo medio de pago |
110 |
105 |
104 |
|
Periodo medio de cobro |
112 |
165 |
122 |
|
Periodo de rotación de inventario |
91 |
76 |
104 |
|
SOLVENCY RATIOS |
|
|
|
|
Capacidad devolución |
0,10 |
0,04 |
0,05 |
|
Garantía de activo |
1,27 |
1,17 |
1,17 |
|
Proporción de deudas a corto plazo (%) |
90,26 |
96,26 |
97,41 |
|
Cobertura de intereses |
5,82 |
1,11 |
2,94 |
|
LIQUIDITY RATIOS |
|
|
|
|
Ratio corriente |
1,08 |
1,05 |
1,05 |
|
Liquidez inmediata |
0,00 |
0,00 |
0,01 |
|
Tesorería |
-4.052.627,63 |
-8.364.034,92 |
-9.687.520,01 |
|
Ventas sobre activo circulante |
636 |
535 |
569 |
Results Analysis
Ratios
|
|
31/12/2004 (12) |
31/12/2005 (12) |
31/12/2006 (12) |
|
Rentabilidad económica (%) |
5,23 |
1,08 |
3,43 |
|
Rentabilidad de explotación (%) |
3,87 |
0,84 |
2,49 |
|
Apalancamiento financiero |
4,65 |
4,42 |
5,49 |
|
Rentabilidad financiera (%) |
16,01 |
8,51 |
11,90 |
|
Rentabilidad general (%) |
2,51 |
0,96 |
1,26 |
Comments on the
Results Analysis Ratios
The economic profitability in the year2005 achieved a 1,08% positive
level, due to a 0,84% economic margin and to an assets turnover of1,28%.
The economic profitability in the year has reduced from 5,23% up to
1,08% of2005, even if it remains positive. This fall is due to the decrease in
operating profitability, that has passe from 3,87% to 0,84%, as assets turnover
whose index has passed from 1,35 to 1,28%.
Financial profitability on 2005 achieved a 8,51%.
The company’s financial structure has instigated its economic
profitability with an indebtedness level of 4,42.
The general profitability on 2005 achieved a 0,96%.
The economic profitability in the year2006 achieved a 3,43% positive
level, due to a 2,49% economic margin and to an assets turnover of1,38%.
The economic profitability in the year has increased from 1,08% up to
3,43%. This growth is due to the economic margin increase, from 0,84% to the
current 2,49Y%, and to the assets turnover index, which in the last period has
achieved 1,38, compared to 1,28 del 2005.
Financial profitability on 2006 achieved a 11,90%.
The company’s financial structure has instigated its economic
profitability with an indebtedness level of 5,49.
The general profitability on 2006 achieved a 1,26%.
SECTORIAL ANÁLYSIS
Large Capital Amounts
and Financial Balance
Figures given in %
|
|
COMPANY (2006) |
SECTOR |
DIFFERENCE |
DIFFERENCE RELATIVE |
|
|
|
|
|
|
ASSETS |
|
|
|
|
|
|
|
|
|
|
A) ACCIONISTAS (SOCIOS) POR DESEMBOLSOS NO EXIGIDOS |
|
0,02 |
|
|
|
|
|
|
|
|
B) INMOVILIZADO |
12,74 |
26,96 |
-14,22 |
-52,75 |
|
|
|
|
|
|
C) GASTOS A DISTRIBUIR EN VARIOS EJERCICIOS |
0,10 |
0,34 |
-0,24 |
-70,41 |
|
|
|
|
|
|
D) ACTIVO CIRCULANTE |
87,16 |
72,68 |
14,48 |
19,93 |
|
|
|
|
|
|
TOTAL ACTIVO (A + B + C + D) |
100 |
100 |
|
|
|
|
|
|
|
|
|
|
|
|
|
|
|
|
|
|
|
|
COMPANY (2006) |
SECTOR |
DIFFERENCE |
DIFFERENCE RELATIVE |
|
|
|
|
|
|
LIABILITIES |
|
|
|
|
|
|
|
|
|
|
A) FONDOS PROPIOS |
14,43 |
38,43 |
-24,00 |
-62,45 |
|
|
|
|
|
|
B) INGRESOS A DISTRIBUIR EN VARIOS EJERCICIOS |
0,18 |
0,20 |
-0,02 |
-7,69 |
|
|
|
|
|
|
C) PROVISIONES PARA RIESGOS Y GASTOS |
|
0,62 |
|
|
|
|
|
|
|
|
D) ACREEDORES A LARGO PLAZO |
2,21 |
8,08 |
-5,88 |
-72,67 |
|
|
|
|
|
|
E) ACREEDORES A CORTO PLAZO |
83,18 |
52,66 |
30,52 |
57,94 |
|
|
|
|
|
|
F) PROVISIONES PARA RIESGOS Y GASTOS A CORTO PLAZO |
|
0,01 |
|
|
|
|
|
|
|
|
TOTAL PASIVO (A + B + C + D + E + F) |
100 |
100 |
|
|
|
|
|
|
|
Financial Balance
Composition
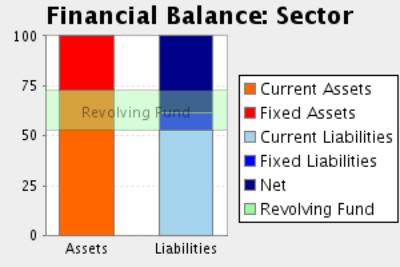
Comments to the
Sectorial Analysis
In the 2006, the assets of the company were formed in 12,84% of fixed
assets and in 87,16Current Assets % In the sector, the proportion of fixed
assets was of 27,32%, 53,00% superior, and the proportion of current assets was
of 72,68%, 19,93% inferior.
The assets were financed in the company in 14,61% with own capitals , in
2,21% with fixed liabilities and in 83,18% with current liabilities In the
sector, the self financing represented 38,63%, 62,18% superior. On the other
hand the long term debts represented in the sector an average of 8,70% financing,
with a relative difference of 74,60% favourable to the sectorAnd, short term
liabilities represented in the sector an average of 52,67% financing, with a
relative difference of 57,92% in favour of the company
The result of this company’s financial structure is a turnover fund that
represents 3,97% of the total assets; in the sector, this same proportion is
20,01%, therefore, we can say that the company’s turnover fund is 80,16%
smaller than the sector one.
Analytical Account of Results
Figures given in %
|
|
COMPANY (2006) |
SECTOR |
DIFFERENCE |
DIFFERENCE RELATIVE |
|
Importe neto de
la cifra de negocios |
99,79 |
99,13 |
0,66 |
0,67 |
|
Otros ingresos
de explotación |
0,21 |
0,87 |
-0,66 |
-75,95 |
|
Valor de la
Producción |
100,00 |
100,00 |
0,00 |
0,00 |
|
Consumos
explotación |
88,08 |
77,71 |
10,37 |
13,35 |
|
Otros gastos
explotación |
3,11 |
8,15 |
-5,04 |
-61,84 |
|
Valor Añadido |
8,81 |
14,14 |
-5,33 |
-37,70 |
|
Gastos de
Personal |
4,25 |
7,54 |
-3,29 |
-43,63 |
|
Resultado
Económico Bruto |
4,57 |
6,60 |
-2,03 |
-30,79 |
|
Dotaciones para
amortizaciones de inmovilizado |
1,18 |
1,28 |
-0,10 |
-7,81 |
|
Variación de las
provisiones de tráfico y pérdidas de crédito incobrables |
0,90 |
0,32 |
0,58 |
177,78 |
|
Resultado
Económico Neto |
2,49 |
5,00 |
-2,51 |
-50,19 |
|
Ingresos
financieros |
0,47 |
0,64 |
-0,17 |
-26,45 |
|
Gastos
financieros |
0,96 |
0,84 |
0,12 |
14,97 |
|
Variación de las
provisiones de inv. financieras |
|
0,02 |
|
|
|
Resultado
Actividades Ordinarias |
1,99 |
4,78 |
-2,79 |
-58,40 |
|
Ingresos
extraordinarios |
0,04 |
0,52 |
-0,48 |
-92,34 |
|
Gastos
extraordinarios |
0,09 |
0,46 |
-0,37 |
-80,60 |
|
Variación de las
provisiones de inmovilizado inmaterial, material y cartera de control |
|
0,06 |
|
|
|
Resultado Antes
Impuestos |
1,94 |
4,79 |
-2,85 |
-59,47 |
|
Impuesto sobre
sociedades |
0,68 |
1,51 |
-0,83 |
-54,91 |
|
Resultado Neto |
1,26 |
3,28 |
-2,02 |
-61,56 |
|
Dotaciones para
amortizaciones de inmovilizado |
1,18 |
1,28 |
-0,10 |
-7,81 |
|
Variación de provisiones |
0,90 |
0,40 |
0,50 |
126,13 |
|
Autofinanciación Neta |
3,34 |
4,96 |
-1,62 |
-32,61 |
Main Ratios
|
|
COMPANY (2006) |
PTILE25 |
PTILE50 |
PTILE75 |
|
STRUCTURAL RATIOS |
|
|
|
|
|
Fondo maniobra |
830.780,04 |
363,57 |
1.221,65 |
2.688,68 |
|
Necesidad fondo maniobra |
10.518.300,05 |
-1.914,86 |
-207,60 |
920,11 |
|
Endeudamiento (%) |
85,39 |
48,79 |
66,67 |
80,16 |
|
Fondos ajenos sobre fondos propios |
5,85 |
0,95 |
2,00 |
4,04 |
|
GENERAL ACTIVITY RATIO |
|
|
|
|
|
Crecimiento de la cifra de negocio (%) |
19,99 |
0,31 |
8,47 |
18,06 |
|
Crecimiento valor añadido (%) |
75,16 |
-7,30 |
5,63 |
18,74 |
|
Cash flow |
963.010,42 |
252,22 |
522,64 |
936,04 |
|
Productividad de la mano de obra |
2,08 |
1,48 |
1,81 |
2,42 |
|
Rotación de activos |
1,38 |
1,25 |
1,64 |
2,22 |
|
Punto muerto |
22.823.189,56 |
6.944.229,48 |
9.388.034,71 |
14.205.462,50 |
|
Margen de seguridad del punto muerto (%) |
20,86 |
11,18 |
19,70 |
31,33 |
|
ACTIVITY RATIOS |
|
|
|
|
|
Periodo medio de pago |
104 |
29 |
69 |
111 |
|
Periodo medio de cobro |
122 |
70 |
103 |
130 |
|
Periodo de rotación de inventario |
104 |
19 |
40 |
68 |
|
SOLVENCY RATIOS |
|
|
|
|
|
Capacidad devolución |
0,05 |
0,06 |
0,11 |
0,22 |
|
Garantía de activo |
1,17 |
1,24 |
1,50 |
2,04 |
|
Proporción de deudas a corto plazo (%) |
97,41 |
82,70 |
94,68 |
99,57 |
|
Cobertura de intereses |
2,94 |
1,98 |
4,83 |
12,09 |
|
LIQUIDITY RATIOS |
|
|
|
|
|
Ratio corriente |
1,05 |
1,08 |
1,30 |
1,74 |
|
Liquidez inmediata |
0,01 |
0,03 |
0,09 |
0,26 |
|
Tesorería |
-9.687.520,01 |
-1.886,00 |
-293,73 |
376,02 |
|
Ventas sobre activo circulante |
569 |
614 |
761 |
1.015 |
Results Analysis
Ratios
|
|
COMPANY (2006) |
PTILE25 |
PTILE50 |
PTILE75 |
|
Rentabilidad económica (%) |
3,43 |
3,48 |
6,39 |
10,50 |
|
Rentabilidad de explotación (%) |
2,49 |
1,91 |
3,64 |
6,60 |
|
Apalancamiento financiero |
5,49 |
1,68 |
2,46 |
4,00 |
|
Rentabilidad financiera (%) |
11,90 |
7,41 |
12,53 |
20,60 |
|
Rentabilidad general (%) |
1,26 |
1,03 |
2,31 |
4,57 |
NOTES
ABOUT YOUR REQUEST:
The data of your request are correct.
In spite of investigations using every source available (public and
private), no additional details than those contained in this report
are available. .
FOREIGN EXCHANGE
RATES
|
Currency |
Unit
|
Indian Rupees |
|
US Dollar |
1 |
Rs.43.34 |
|
UK Pound |
1 |
Rs.86.53 |
|
Euro |
1 |
Rs.68.54 |
RATING
EXPLANATIONS
|
RATING |
STATUS |
PROPOSED CREDIT LINE |
|
|
>86 |
Aaa |
Possesses an extremely sound financial base with the strongest capability
for timely payment of interest and principal sums |
Unlimited |
|
71-85 |
Aa |
Possesses adequate working capital. No caution needed for credit
transaction. It has above average (strong) capability for payment of interest
and principal sums |
Large |
|
56-70 |
A |
Financial & operational base are regarded healthy. General
unfavourable factors will not cause fatal effect. Satisfactory capability for
payment of interest and principal sums |
Fairly Large |
|
41-55 |
Ba |
Overall operation is considered normal. Capable to meet normal
commitments. |
Satisfactory |
|
26-40 |
B |
Unfavourable & favourable factors carry similar weight in credit
consideration. Capability to overcome financial difficulties seems comparatively
below average. |
Small |
|
11-25 |
Ca |
Adverse factors are apparent. Repayment of interest and principal sums
in default or expected to be in default upon maturity |
Limited with
full security |
|
<10 |
C |
Absolute credit risk exists. Caution needed to be exercised |
Credit not
recommended |
|
NR |
In view of the lack of information, we have no basis upon which to
recommend credit dealings |
No Rating |
|
This score serves as a reference to assess SC’s credit risk
and to set the amount of credit to be extended. It is calculated from a
composite of weighted scores obtained from each of the major sections of this
report. The assessed factors and their relative weights (as indicated through
%) are as follows:
Financial
condition (40%) Ownership
background (20%) Payment
record (10%)
Credit history
(10%) Market trend
(10%) Operational
size (10%)