![]()
MIRA
INFORM REPORT
|
Report Date : |
01.07.2008 |
IDENTIFICATION
DETAILS
|
Name : |
EUROPERFIL SA |
|
|
|
|
Registered Office : |
Avenida De
La Gran Via, 179, Cp 08908, L Hospitalet De
Llobregat Barcelona |
|
|
|
|
Country : |
Spain |
|
|
|
|
Financials (as on) : |
31.12.2006 |
|
|
|
|
Date of Incorporation : |
|
|
|
|
|
Legal Form : |
Sociedad Anonima |
|
|
|
|
Line of Business : |
First
Processing of Iron and Steel and Prod of Non-Esc Ferro-Alloys |
RATING &
COMMENTS
|
MIRA’s Rating : |
A |
|
RATING |
STATUS |
PROPOSED CREDIT LINE |
|
|
56-70 |
A |
Financial & operational base are regarded healthy. General
unfavourable factors will not cause fatal effect. Satisfactory capability for
payment of interest and principal sums |
Fairly Large |
|
Maximum Credit Limit : |
1.500.000,00 € |
|
|
|
|
Status : |
Good |
|
|
|
|
Payment Behaviour : |
Regular |
|
|
|
|
Litigation : |
Clear |
FINANCIAL
REPORT
EUROPERFIL SA
TAX NUMBER: A58346305
EXECUTIVE SUMMARY
Identification
Current Business Name: EUROPERFIL SA
Commercial Name: EUROPERFIL, S.A.
Other names: YES
Current Address: AVENIDA DE
LA GRAN VIA, 179, CP 08908, L HOSPITALET DE
LLOBREGAT BARCELONA
Branches: 1
Telephone number: 932316333 Fax: 932616338
URL: www.europerfil.es Corporate e-mail: administracio@europerfil.es
Commercial Risk
Credit Appraisal:
1.500.000,00 €
Legal Actions: NO
Financial Information
Latest Balance sheet sales (2006): 54.600.132,78 € (Registro Mercantil)
Result: 2.087.898,22 €
Total Assets:
44.256.799,82 €
Social Capital: 2.404.000,00 €
Employees: 89
Commercial Information
Constitution Date: 31/03/1987
Business activity: First
processing of iron & steel & prod of non-esc ferro-alloys
NACE Code: 2730
International Operations: Importa y
exporta
Corporate Structure
Presidente:
Credit Appraisal
Maximum Credit (from 0 a 6,000,000 €):
1.500.000,00 €
Rating Evolution
Financial Situation
Fiscal year2006
|
Treasury |
Excelente |
|
Indebtedness |
Medio |
|
Profitability |
Media |
|
Balance |
Excelente |
Performance
|
Legal Actions |
Nulas o irrelevantes |
|
Business
Trajectory |
Excelente |
INCIDENTS

Summary
LEGAL ACTIONS: No legal
incidences registered
CLAIM FILED AGAINST THE ADMINISTRATION: No administrative
claims registered
AFFECTED BY:
3 Company / Companies in Insolvency Proceedings.
FINANCIAL ELEMENTS AND SECTORIAL
COMPARATIVE
FINANCIAL ELEMENTS
Figures given in €
|
|
2004 (12) |
2005 (12) |
2006 (12) |
% ASSETS |
|
|
|
|
|
|
BALANCE SHEET ANALYSIS |
|
|
|
|
|
|
|
|
|
|
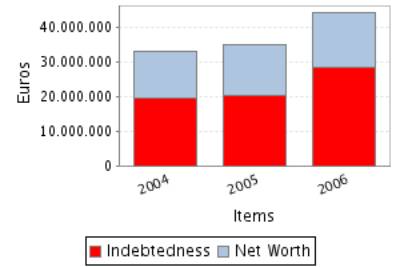
OWN FUNDS |
13.724.526,82 |
14.643.501,21 |
15.644.977,95 |
35,35 |
|
|
|
|
|
|
DEBT |
19.539.507,33 |
20.520.111,33 |
28.611.821,87 |
64,65 |
|
|
|
|
|
|
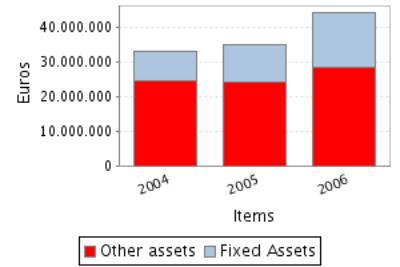
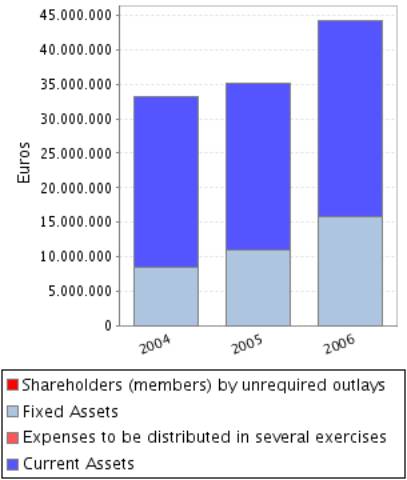
FIXED ASSETS |
8.551.314,22 |
11.064.372,23 |
15.765.429,05 |
35,62 |
|
|
|
|
|
|
TOTAL ASSETS |
33.264.034,15 |
35.163.612,54 |
44.256.799,82 |
|
|
|
|
|
|
|
|
|
|
|
|
|
|
|
|
|
|
|
2004 (12) |
2005 (12) |
2006 (12) |
% SALES |
|
|
|
|
|
|
PROFIT AND LOSS ACCOUNT ANALYSIS |
|
|
|
|
|
|
|
|
|
|
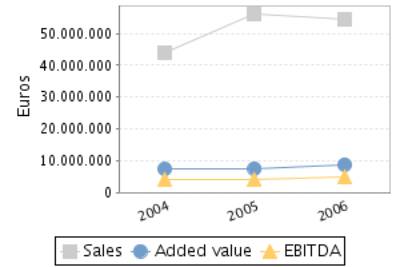
SALES |
43.998.339,40 |
56.024.570,23 |
54.600.132,78 |
|
|
|
|
|
|
|
ADDED VALUE |
7.339.145,18 |
7.502.240,39 |
8.776.661,69 |
16,07 |
|
|
|
|
|
|
EBITDA |
4.204.525,25 |
4.128.659,62 |
4.912.113,33 |
9,00 |
|
|
|
|
|
|
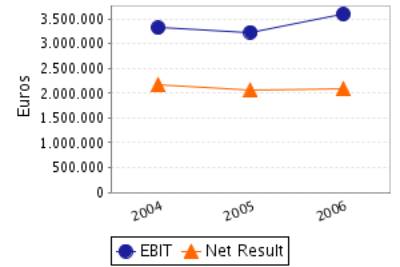
EBIT |
3.324.681,10 |
3.235.200,36 |
3.596.230,89 |
6,59 |
|
|
|
|
|
|
NET RESULT |
2.168.207,35 |
2.059.666,39 |
2.087.898,22 |
3,82 |
|
|
|
|
|
Balance Sheets Items Analysis
Balance Sheet
Comments
Total assets of the company grew 5,71% between 2004 and 2005.
This growth is a consequence of the fixed assets increase of 29,39%.
This growth has been financed, on a wider scale, with a Shareholders’
equity increase of 6,70% and in a smaller proportion with an debt increase of
5,02%.
Total assets of the company grew 25,86% between 2005 and 2006.
This growth is a consequence of the fixed assets increase of 42,49%.
This growth has been mainly financed with a debt increase of 39,43%.
Nevertheless the net worth increased 6,84%.
Profit and Loss Account Analysis
Profit and Loss
Account Comments
The company’s sales figure grew 27,33% between 2004 and 2005.
The company’s EBIT decreased in 2,69% between 2004 and 2005.
This evolution implies a reduction in the company’s operating
profitability.
The result of these variations is a decrease of the company’s Economic
Profitability of 7,95% in the analysed period, being this profitability of
9,20% in the year 2005.
The company’s Net Result decreased in 5,01% between 2004 and 2005.
This evolution, compared to the EBIT’s performance, implies that the
financial and extraordinary activities have had a negative effect in the
company’s Financial Profitability.
The result of these variations is a reduction of the company’s
profitability of 10,97% in the analysed period, being equal to 14,07% in the
year 2005.
The company’s sales figure decreased in 2,54% between 2005 and 2006.
The company’s EBIT grew 11,16% between 2005 and 2006.
This evolution implies an increase in the company’s operating
profitability.
The result of these variations is a decrease of the company’s Economic
Profitability of 11,68% in the analysed period, being this profitability of
8,13% in the year 2006.
The company’s Net Result grew 1,37% between 2005 and 2006.
This evolution, compared to the EBIT’s performance, implies that the
financial and extraordinary activities have had a negative effect in the
company’s Financial Profitability.
The result of these variations is a reduction of the company’s
profitability of 5,12% in the analysed period, being equal to 13,35% in the
year 2006.
ANNUAL FINANCIAL REPORT
ADDITIONAL DATA
Source: annual financial report 2006
Results Distribution
Figures given in €
|
DISTRIBUTION BASE |
DISTRIBUTION TO |
||
|
Profit and Loss |
2.087.898,22 |
Retained earnings |
0,00 |
|
Carry Over |
0,00 |
Voluntary Reserve |
1.043.949,10 |
|
Voluntary reserves |
0,00 |
Prior years losses |
0,00 |
|
Reserves |
0,00 |
Carry Over |
0,00 |
|
Other concepts |
0,00 |
Other funds |
0,00 |
|
Total of Amounts to be distributed |
2.087.898,22 |
Dividends |
1.043.949,12 |
|
|
|
Other Applications |
0,00 |
Auditing
Auditors’ opinion: FAVORABLE
Auditor: SANTACANA AUDITORES S.A.
COMPARATIVE SECTOR ANALYSIS
Values table
Figures expressed in %
|
|
COMPANY (2006) |
SECTOR |
DIFFERENCE |
DIFFERENCE RELATIVE |
|
|
|
|
|
|
BALANCE SHEET
ANALYSIS: % on the total assets |
|
|
|
|
|
|
|
|
|
|
OWN FUNDS |
35,35 |
47,93 |
-12,58 |
-26,25 |
|
|
|
|
|
|
DEBT |
64,65 |
52,07 |
12,58 |
24,17 |
|
|
|
|
|
|
FIXED ASSETS |
35,62 |
44,97 |
-9,35 |
-20,79 |
|
|
|
|
|
|
|
|
|
|
|
|
|
|
|
|
|
|
COMPANY (2006) |
SECTOR |
DIFFERENCE |
DIFFERENCE RELATIVE |
|
|
|
|
|
|
PROFIT AND LOSS
ACCOUNT ANALYSIS: % on the total operating income |
|
|
|
|
|
|
|
|
|
|
SALES |
98,35 |
97,88 |
0,48 |
0,49 |
|
|
|
|
|
|
ADDED VALUE |
15,81 |
17,53 |
-1,72 |
-9,79 |
|
|
|
|
|
|
EBIT |
6,48 |
5,14 |
1,34 |
25,96 |
|
|
|
|
|
|
NET RESULT |
3,76 |
2,82 |
0,94 |
33,18 |
|
|
|
|
|
Sector Composition
Compared sector (NACE): 273
Number of companies: 14
Size (Sales Figure) : > 40.000.000,00
Euros
Comments on the
sectorial comparative
Compared to its sector the assets of the companies show an inferior
proportion of fixed assets. Specifically the difference with the sector average
is -9,35% , which means a relative difference of -20,79% .
In liabilities composition the company appeals on a wider scale to self
financing, being the proportion of net worth of 12,58% inferior, which means a
relative difference of 26,25% 12,58% more than the sector, which means a
difference of 24,17% .
The proportion that the sales mean to the company’s total ordinary
income is 98,35%, 0,48% higher than in the sector, which means a relative
difference of 0,49% .
The company’s EBIT was positive and was 6,48% with regard to the total
ordinary income, 1,34% higher than in the sector, which means a relative
difference of 25,96% .
The company’s capacity to generate operating income is higher than the
one of the sector as its ratio EBIT/Sales is higher (ES Company versus ES
Sector).
The company’s net result was positive and equal to 3,76% with regard to
the total ordinary income, 0,94% higher than in the sector, which means a
relative difference of 33,18% .
The financial and extraordinary results and the tax impact have had a
less negative impact on the Net result in the company than in the sector; as a
consequence, the company shows a better Net Result/EBIT ratio (REBEmpresa vs.
REBSector).
ADDRESSES
Current Legal Seat Address:
AVENIDA DE LA GRAN VIA, 179
08908 L HOSPITALET DE LLOBREGAT BARCELONA
Previous Seat Address:
CALLE NICARAGUA, 46
08029
BARCELONA
Characteristics
of the current address
Type of premises: oficina
Property: en alquiler
Local Situation: secundaria
Branches 
|
STREET |
POSTAL CODE |
TOWN |
PROVINCE |
|
POLIGONO DE CERVERA AV VALL D ARAN SN |
25200 |
CERVERA |
Lérida |
1 branches registered
CORPORATE STRUCTURE
ADMINISTRATIVE LINKS
Main Board members,
Directors and Auditor ![]()
|
POSITION |
SURNAMES AND
NAME |
APPOINTMENT DATE |
|
|
PRESIDENTE |
SANS CASTELLS JOAN |
20/09/2007 |
|
|
CONSEJERO |
MILLERON PIERRE FRANCOIS |
02/09/2002 |
|
|
CONSEJERO |
GUY AMEDRO |
15/07/2004 |
|
|
CONSEJERO |
GUY RENE AMEDRO |
20/09/2007 |
|
|
CONSEJERO |
PHILIPPE BONNAVE |
20/09/2007 |
|
|
CONSEJERO |
STEPHANE CLAUDE FERON |
20/09/2007 |
|
|
SECRETARIO |
VAZQUEZ DE SOLA GALINDO FRANCISCO |
22/01/2004 |
|
|
AUDITOR |
APPOINTMENT DATE |
||
|
MOORE STEPHENS & SANTACANA AUDITORES Y CONSULTORES |
01/02/2008 |
||
Functional Managers
|
POSITION |
SURNAMES AND
NAME |
|
Director general |
MARTORELL ENRIC |
|
Director financiero |
MARCO ANTONIO |
|
Director de rrhh |
ROJANO SANCHEZ FERNANDO |
|
Director comercial |
GARGANTILLA ALFREDO |
FINANCIAL LINKS
|
|
BUSINESS NAME |
CIF / COUNTRY |
% |
SOURCE |
DATA INF. |
|
|
ACIEROID SA. |
ESPAÑA |
50,00 |
F.PROPIAS |
05/05/2008 |
|
|
ARCELOR CONSTRUCTION FRANCE |
FRANCIA |
50,00 |
F.PROPIAS |
05/05/2008 |
You can obtain business information of a foreign company at the
pageD&B International
CREDIT INFORMATION
Constitution Date: 31/03/1987
Business activity 
Activity: First processing
of iron & steel & prod of non-esc ferro-alloys
NACE Code: 2730
NACE Activity: Other first processing of iron and steel and
production of non-ECSC ferro-alloys
Business: COMERCIALIZACION DE PERFILES DE ACERO Y DEMAS
ARTICULOS METALICOS PARA LA CONSTRUCCION Y, EN GENERAL, TODA CLASE DE ARTICULOS
METALICOS PARA LA CONSTRUCCION.
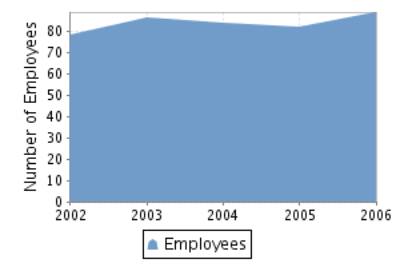
Employees 
Number of total employees: 89 (2008)
Number of fixed employees: 100,00%
Number of temporary employees: 0,00%
Employees evolution
COMMERCIAL OPERATIONS 
SUPPLIERS
|
BUSINESS NAME |
INTERNATIONAL |
|
KONTI STEEL |
SI |
|
ACIEROID SA
UNIPERSONAL |
NO |
|
BOUYGUES
CONSTRUCCION |
NO |
|
UGINE IBERICA |
NO |
|
TAC METAL
FORMING |
NO |
|
GONVARRI
INDUSTRIAL |
NO |
|
ACERALIA
TRANSFORMADOS SA |
NO |
|
ACME CATALUNYA
SA |
NO |
|
ARCELOR
CONSTRUCCION ESPAÑA SL |
NO |
|
ARCELOR
DISTRIBUCION MEDITERRANEO SL |
NO |
21 proveedores
SALES
Collection (estimated):
Exports to: Portugal
National Distribution: 100%
CLIENTS
|
BUSINESS NAME |
INTERNATIONAL |
|
ACERALIA
CONSTRUCCION OBRAS SL |
NO |
|
BCE SA |
SI |
|
ACERALIA
TRANSFORMADOS SA |
NO |
|
HAIRONVILLE
PORTUGAL |
NO |
|
ACME CATALUNYA
SA |
NO |
|
TAC METAL
FORMING |
NO |
|
ACIEROID SA
UNIPERSONAL |
NO |
|
DV CONST UTE
SABADELL |
NO |
|
OMNITRADE
ESPAGNE |
NO |
|
POLYTUIL SFH |
NO |
18 clientes
Banks 
|
ENTITY |
BRANCH |
ADDRESS |
TOWN OR CITY |
PROVINCE |
|
BANCO BILBAO VIZCAYA ARGENTARIA, S.A. |
1000 |
PL. DE CATALUÑA, 5 |
080190001 |
Barcelona |
|
BNP PARIBAS ESPAÑA, S.A. |
0405 |
AVENIDA DIAGONAL, 682 4. PLANTA |
080190001 |
Barcelona |
|
BANCO DE SABADELL, S.A. |
0014 |
AV BARCELONA 000021 |
081840001 |
Barcelona |
|
CAIXA D’ESTALVIS DE TERRASSA |
0039 |
AVDA. DE BARCELONA, 86 |
081840001 |
Barcelona |
|
BANCO SANTANDER, S.A. |
|
|
L HOSPITALET DE LLOBREGAT |
|
5 bank entities registered
Brands, Signs and Commercial
Names 
Brand name: NILHO (Valid)
Type: MIXTA Date: 07/03/2007
Brand name: ARTIC (Valid)
Type: MIXTA Date: 07/03/2007
Brand name: EUROBASE (Valid)
Type: DENOMINATIVA Date: 09/07/1996
Brand name: EUROBAC (Valid)
Type: DENOMINATIVA Date: 09/07/1996
Brand name: EUROMODUL (Valid)
Type: DENOMINATIVA Date: 09/07/1996
LEGAL STRUCTURE
Constitution Data
Register Date: 31/03/1987
Current Legal Form: SOCIEDAD ANONIMA
Current Capital:
2.404.000,00 €
Legal Aspects
Obligation to fill in Financial
Statements: YES
Chamber census: YES (2006)
Listed on a Stock Exchange: NO
B.O.R.M.E.(Official Companies
Registry Gazette) 
Registered Proceedings
|
PROCEEDINGS |
DATE |
NOTICE NUM. |
TRADE REG. |
|
Nombramientos |
01/02/2008 |
53578 |
Barcelona |
|
Nombramientos |
20/09/2007 |
479558 |
Barcelona |
|
Nombramientos |
20/09/2007 |
478435 |
Barcelona |
|
Nombramientos |
20/09/2007 |
478434 |
Barcelona |
Other Proceedings published
|
PROCEEDINGS |
DATE |
NOTICE NUM. |
TRADE REG. |
|
Depósito de cuentas (2006) Individual |
10/12/2007 |
1148099 |
Barcelona |
Press articles

07/03/2007 SEGRE (INFORMACIÓN FINANCIERA)
EUROPERFIL, EMPRESA LIDER EN EL SECTOR DE CUBIERTAS METALICAS PARA LA
CONSTRUCCION, PREVE TRIPLICAR SU FACTURACION EN LOS PROXIMOS CINCO AÑOS,
PASANDO DE LOS 60 MM. DE EUROS DE 2006 A LOS 180 MM. EN 2011. LA SDAD.
DUPLICARA SU INVERSION DE 7 MM. DE EUROS HECHA EN 2006 A LOS 14 MM. EN 2008
DESTINADOS A LA AMPLIACION HASTA 50.000 METROS CUADRADOS DE LA PLANTA DE
CERVERA. LOS BENEFICIOS DEL PASADO AÑO ASCENDIERON A 3 MM. DE EUROS. EUROPERFIL
CREARA EN MEDIO AÑO 20 NUEVOS PUESTOS DE TRABAJO, HASTA SUMAR 80 TRABAJADORES
EN CERVERA.
06/01/2007 SEGRE (INFORMACIÓN FINANCIERA)
LA EMPRESA ACIEROID, ESPECIALIZADA EN SOLUCIONES CONSTRUCTIVAS, HA
INVERTIDO 8 MM. DE EUROS EN LA AMPLIACION DE SUS FABRICAS DE EUROPERFIL DE
CERVERA (LLEIDA) Y SESEÑA (TOLEDO), LO QUE LE PERMITIRA INCREMENTAR LA
PRODUCCION EN UN 12% Y SU PLANTILLA CON 25 EMPLEADOS. EN CONCRETO, ACIEROID HA
DESTINADO 7 MM. DE EUROS A SU FABRICA DE CERVERA, PLANTA QUE GANARA 5.400
TONELADAS DE CAPACIDAD PRODUCTIVA, MIENTRAS QUE LA TOLEDANA DOBLARA SU
PRODUCCION. LA FABRICA DE LLEIDA PASARA DE LOS 7.000 METROS CUADRADOS INICIALES
A 29.000 Y SU PLANTILLA CRECERA DE 60 A 85 TRABAJADORES. POR SU PARTE, LA
PLANTA DE SESEÑA PASARA DE 3.000 A 5.000 METROS CUADRADOS.
FINANCIAL INFORMATION
The information on the last account contained in this report is
extracted from the Mercantile Register file of the legal address of the Company
and dated 08/11/2007.
BALANCE SHEET
Assets
Figures given in €
|
|
31/12/2004 (12) |
31/12/2005 (12) |
31/12/2006 (12) |
|
A) ACCIONISTAS (SOCIOS) POR DESEMBOLSOS NO
EXIGIDOS |
|
|
|
|
B) INMOVILIZADO |
8.551.314,22 |
11.064.372,23 |
15.765.429,05 |
|
I. Gastos de establecimiento |
|
|
|
|
II. Inmovilizaciones inmateriales |
|
|
407.290,00 |
|
Gastos de investigación y desarrollo |
|
|
407.290,00 |
|
Concesiones, patentes, licencias, marcas y similares |
|
|
|
|
Fondo de comercio |
|
|
|
|
Derechos de traspaso |
|
|
|
|
Aplicaciones informáticas |
|
|
|
|
Derechos s/bienes en régimen de arrendamiento financiero |
|
|
|
|
Anticipos |
|
|
|
|
Provisiones |
|
|
|
|
Amortizaciones |
|
|
|
|
III. Inmovilizaciones materiales |
8.516.573,74 |
11.029.631,75 |
15.347.439,05 |
|
Terrenos y construcciones |
3.880.793,70 |
6.802.301,08 |
6.802.301,08 |
|
Instalaciones técnicas y maquinaria |
11.214.294,41 |
11.690.852,08 |
11.897.358,04 |
|
Otras instalaciones, utillaje y mobiliario |
1.614.816,84 |
1.722.140,69 |
1.782.927,19 |
|
Anticipos e inmovilizaciones materiales en curso |
60.600,00 |
99.550,00 |
5.195.011,63 |
|
Otro inmovilizado |
529.798,24 |
591.963,49 |
661.134,02 |
|
Provisiones |
|
|
|
|
Amortizaciones |
-8.783.729,45 |
-9.877.175,59 |
-10.991.292,91 |
|
IV. Inmovilizaciones financieras |
34.740,48 |
34.740,48 |
10.700,00 |
|
Participaciones en empresas del grupo |
|
|
|
|
Créditos a empresas del grupo |
|
|
|
|
Participaciones en empresas asociadas |
|
|
|
|
Créditos a empresas asociadas |
|
|
|
|
Cartera de valores a largo plazo |
|
|
|
|
Otros créditos |
|
|
|
|
Depósitos y fianzas constituidos a largo plazo |
34.740,48 |
34.740,48 |
10.700,00 |
|
Provisiones |
|
|
|
|
Administraciones Públicas a largo plazo |
|
|
|
|
V. Acciones propias |
|
|
|
|
VI. Deudores por operaciones de tráfico a largo
plazo |
|
|
|
|
C) GASTOS A DISTRIBUIR EN VARIOS EJERCICIOS |
|
|
|
|
D) ACTIVO CIRCULANTE |
24.712.719,93 |
24.099.240,31 |
28.491.370,77 |
|
I. Accionistas por desembolsos exigidos |
|
|
|
|
II. Existencias |
9.418.267,00 |
7.553.515,00 |
10.137.759,00 |
|
Comerciales |
|
|
|
|
Materias primas y otros aprovisionamientos |
8.542.288,00 |
6.467.972,00 |
8.534.680,00 |
|
Productos en curso y semiterminados |
|
|
|
|
Productos terminados |
875.979,00 |
1.085.543,00 |
1.603.079,00 |
|
Subproductos residuos y materiales recuperados |
|
|
|
|
Anticipos |
|
|
|
|
Provisiones |
|
|
|
|
III. Deudores |
15.039.905,31 |
16.323.384,79 |
18.254.656,70 |
|
Clientes por ventas y prestaciones de servicios |
11.091.313,16 |
13.182.209,88 |
14.197.073,33 |
|
Empresas del grupo, deudores |
4.453.517,43 |
3.219.520,44 |
4.342.495,91 |
|
Empresas asociadas, deudores |
|
|
|
|
Deudores varios |
|
|
|
|
Personal |
42.599,63 |
42.531,26 |
41.036,12 |
|
Administraciones Públicas |
15.635,63 |
489.813,74 |
269.344,41 |
|
Provisiones |
-563.160,54 |
-610.690,53 |
-595.293,07 |
|
IV. Inversiones financieras temporales |
|
|
|
|
Participaciones en empresas del grupo |
|
|
|
|
Créditos a empresas del grupo |
|
|
|
|
Participaciones en empresas asociadas |
|
|
|
|
Créditos a empresas asociadas |
|
|
|
|
Cartera de valores a corto plazo |
|
|
|
|
Otros créditos |
|
|
|
|
Depósitos y fianzas constituidos a corto plazo |
|
|
|
|
Provisiones |
|
|
|
|
V. Acciones propias a corto plazo |
|
|
|
|
VI. Tesorería |
239.114,37 |
222.340,52 |
98.955,07 |
|
VII. Ajustes por periodificación |
15.433,25 |
|
|
|
TOTAL ACTIVO (A + B + C + D) |
33.264.034,15 |
35.163.612,54 |
44.256.799,82 |
Assets composition
Liabilities
Figures given in €
|
|
31/12/2004 (12) |
31/12/2005 (12) |
31/12/2006 (12) |
|
A) FONDOS PROPIOS |
13.387.686,29 |
14.363.249,00 |
15.421.314,02 |
|
I. Capital suscrito |
2.404.000,00 |
2.404.000,00 |
2.404.000,00 |
|
II. Prima de emisión |
|
|
|
|
III. Reserva de revalorización |
|
|
|
|
IV. Reservas |
8.815.478,94 |
9.899.582,61 |
10.929.415,80 |
|
Reserva legal |
480.809,68 |
480.809,68 |
480.809,68 |
|
Reservas para acciones propias |
|
|
|
|
Reservas para acciones de la sociedad dominante |
|
|
|
|
Reservas estatutarias |
|
|
|
|
Otras reservas |
8.334.620,84 |
9.418.724,51 |
10.448.557,70 |
|
Diferencias por ajuste del capital a euros |
48,42 |
48,42 |
48,42 |
|
V. Resultados de ejercicios anteriores |
|
|
|
|
Remanente |
|
|
|
|
Resultados negativos de ejercicios anteriores |
|
|
|
|
Aportaciones de
socios para compensación de pérdidas |
|
|
|
|
VI. Pérdidas y
Ganancias (beneficio o pérdida) |
2.168.207,35 |
2.059.666,39 |
2.087.898,22 |
|
VII. Dividendo a
cuenta entregado en el ejercicio |
|
|
|
|
VIII. Acciones
propias para reducción de capital |
|
|
|
|
B) INGRESOS A
DISTRIBUIR EN VARIOS EJERCICIOS |
336.840,53 |
280.252,21 |
223.663,93 |
|
Subvenciones de
capital |
336.840,53 |
280.252,21 |
223.663,93 |
|
Diferencias
positivas de cambio |
|
|
|
|
Otros ingresos a
distribuir en varios ejercicios |
|
|
|
|
Ingresos
fiscales a distribuir en varios ejercicios |
|
|
|
|
C) PROVISIONES
PARA RIESGOS Y GASTOS |
288.290,88 |
|
|
|
Provisiones para
pensiones y obligaciones similares |
|
|
|
|
Provisiones para impuestos |
|
|
|
|
Otras provisiones |
288.290,88 |
|
|
|
Fondo de reversión |
|
|
|
|
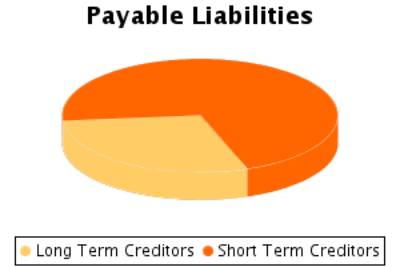
D) ACREEDORES A LARGO PLAZO |
|
|
8.300.929,12 |
|
I. Emisiones de obligaciones y otros valores
negociables |
|
|
|
|
Obligaciones no convertibles |
|
|
|
|
Obligaciones convertibles |
|
|
|
|
Otras deudas
representadas en valores negociables |
|
|
|
|
II. Deudas con
entidades de crédito |
|
|
8.300.929,12 |
|
Deudas a largo
plazo con entidades de crédito |
|
|
8.300.929,12 |
|
Acreedores por
arrendamiento financiero a largo plazo |
|
|
|
|
III. Deudas con
empresas del grupo y asociadas |
|
|
|
|
Deudas con
empresas del grupo |
|
|
|
|
Deudas con
empresas asociadas |
|
|
|
|
IV. Otros
acreedores |
|
|
|
|
Deudas
representadas por efectos a pagar |
|
|
|
|
Otras deudas |
|
|
|
|
Fianzas y
depósitos recibidos a largo plazo |
|
|
|
|
Administraciones
Públicas a largo plazo |
|
|
|
|
V. Desembolsos
pendientes sobre acciones no exigidos |
|
|
|
|
De empresas del
grupo |
|
|
|
|
De empresas
asociadas |
|
|
|
|
De otras
empresas |
|
|
|
|
VI. Acreedores por operaciones de tráfico a largo
plazo |
|
|
|
|
E) ACREEDORES A CORTO PLAZO |
19.251.216,45 |
20.520.111,33 |
20.310.892,75 |
|
I. Emisiones de obligaciones y otros valores
negociables |
|
|
|
|
Obligaciones no convertibles |
|
|
|
|
Obligaciones convertibles |
|
|
|
|
Otras deudas representadas en valores negociables |
|
|
|
|
Intereses de obligaciones y otros valores |
|
|
|
|
II. Deudas con entidades de crédito |
2.574.676,19 |
2.257.276,66 |
5.634.906,40 |
|
Préstamos y otras deudas |
2.564.550,75 |
2.235.244,17 |
5.564.841,06 |
|
Deudas por intereses |
10.125,44 |
22.032,49 |
70.065,34 |
|
Acreedores por arrendamiento financiero a corto plazo |
|
|
|
|
III. Deudas con empresas del grupo y asociadas a
corto plazo |
4.481.483,71 |
3.944.395,68 |
349.035,59 |
|
Deudas con empresas del grupo |
4.481.483,71 |
3.944.395,68 |
349.035,59 |
|
Deudas con empresas asociadas |
|
|
|
|
IV. Acreedores comerciales |
10.497.867,96 |
9.641.564,50 |
10.521.194,78 |
|
Anticipos recibidos por pedidos |
130.348,98 |
69.705,36 |
390.528,42 |
|
Deudas por compras o prestaciones de servicios |
10.367.518,98 |
9.571.859,14 |
10.130.666,36 |
|
Deudas representadas por efectos a pagar |
|
|
|
|
V. Otras deudas no comerciales |
1.420.932,87 |
4.457.935,82 |
3.517.021,13 |
|
Administraciones Públicas |
859.254,05 |
705.106,91 |
979.540,69 |
|
Deudas representadas por efectos a pagar |
|
|
|
|
Otras deudas |
306.443,78 |
3.507.521,15 |
2.383.832,67 |
|
Remuneraciones pendientes de pago |
255.235,04 |
245.307,76 |
153.647,77 |
|
Fianzas y depósitos recibidos a corto plazo |
|
|
|
|
VI. Provisiones para operaciones de tráfico |
|
|
|
|
VII. Ajustes por periodificación |
276.255,72 |
218.938,67 |
288.734,85 |
|
F) PROVISIONES PARA RIESGOS Y GASTOS A CORTO
PLAZO |
|
|
|
|
TOTAL PASIVO (A + B + C + D + E + F) |
33.264.034,15 |
35.163.612,54 |
44.256.799,82 |
Liabilities
Composition
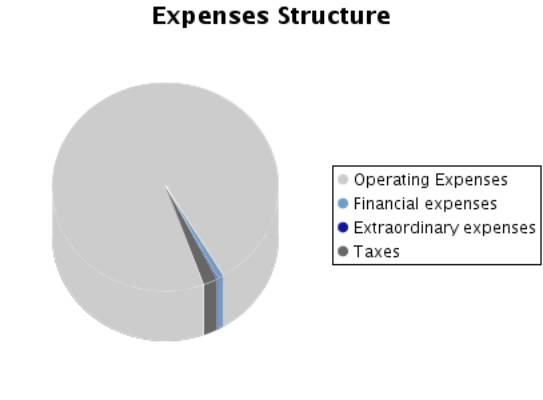
PROFIT AND LOSS ACCOUNT
Itams of the Profit
and Loss Account
Figures given in €
|
|
31/12/2004 (12) |
31/12/2005 (12) |
31/12/2006 (12) |
|
A) GASTOS (A.1 a A.16) |
42.191.676,56 |
54.480.522,97 |
54.031.021,17 |
|
A.1. Reducción de existencias de productos
terminados y en curso de fabricación |
7.720,00 |
|
|
|
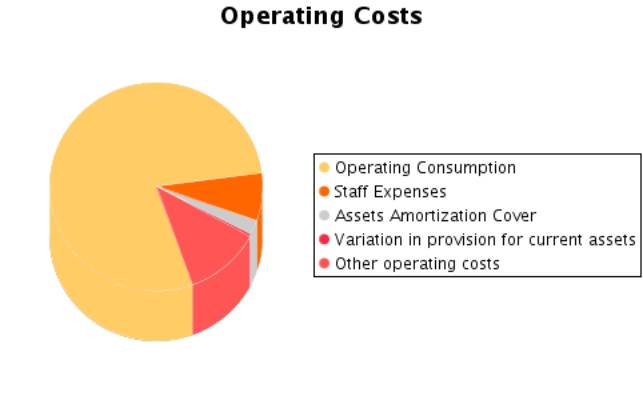
A.2. Aprovisionamientos |
31.868.987,55 |
43.355.934,46 |
41.253.869,32 |
|
Consumo de mercaderías |
|
|
|
|
Consumo de materias primas y otras materias consumibles |
30.920.977,46 |
42.292.396,74 |
40.061.037,17 |
|
Otros gastos externos |
948.010,09 |
1.063.537,72 |
1.192.832,15 |
|
A.3. Gastos de personal |
3.134.619,93 |
3.373.580,77 |
3.864.548,36 |
|
Sueldos, salarios y asimilados |
2.368.187,29 |
2.481.630,94 |
2.817.745,27 |
|
Cargas sociales |
766.432,64 |
891.949,83 |
1.046.803,09 |
|
A.4. Dotaciones para amortizaciones de
inmovilizado |
1.074.952,02 |
1.093.446,14 |
1.153.795,47 |
|
A.5. Variación de las provisiones de tráfico |
-195.107,87 |
-199.986,88 |
162.086,97 |
|
Variación de provisiones de existencias |
|
|
|
|
Variación de provisiones y pérdidas de créditos incobrables |
84.005,71 |
88.304,00 |
162.086,97 |
|
Variación de otras provisiones de tráfico |
-279.113,58 |
-288.290,88 |
|
|
A.6. Otros gastos de explotación |
5.051.788,56 |
5.602.938,02 |
6.000.457,42 |
|
Servicios exteriores |
5.036.784,54 |
5.543.662,50 |
5.955.518,15 |
|
Tributos |
15.004,02 |
59.275,52 |
44.939,27 |
|
Otros gastos de gestión corriente |
|
|
|
|
Dotación al fondo de reversión |
|
|
|
|
A.I. BENEFICIOS DE EXPLOTACION
(B.1+B.2+B.3+B.4-A.1-A.2-A.3-A.4-A.5-A.6) |
3.324.681,10 |
3.235.200,36 |
3.596.230,89 |
|
A.7. Gastos financieros y gastos asimilados |
220.878,91 |
250.470,60 |
441.970,46 |
|
Por deudas con empresas del grupo |
|
|
|
|
Por deudas con empresas asociadas |
|
|
|
|
Por otras deudas Por deudas con terceros y gastos asimilados |
220.878,91 |
250.470,60 |
441.970,46 |
|
Pérdidas de inversiones financieras |
|
|
|
|
A.8. Variación de las provisiones de inversiones
financieras |
|
|
|
|
A.9. Diferencias negativas de cambio |
|
|
|
|
A.II. RESULTADOS FINANCIEROS POSITIVOS
(B.5+B.6+B.7+B.8-A.7-A.8-A.9) |
|
|
|
|
A.III. BENEFICIOS DE LAS ACTIVIDADES ORDINARIAS
(A.I+A.II-B.I-B.II) |
3.133.456,49 |
3.007.217,93 |
3.180.603,11 |
|
A.10. Variación de las provisiones de
inmovilizado inmaterial, material y cartera de control |
|
|
|
|
A.11. Pérdidas procedentes del inmovilizado
inmaterial, material y cartera de control |
|
|
64.349,35 |
|
A.12. Pérdidas por operaciones con acciones y
obligaciones propias |
|
|
|
|
A.13. Gastos extraordinarios |
|
61.049,25 |
|
|
A.14. Gastos y pérdidas de otros ejercicios |
|
|
|
|
A.IV. RESULTADOS EXTRAORDINARIOS POSITIVOS
(B.9+B.10+B.11+B.12+B.13-A.10-A.11-A.12-A.13-A.14) |
62.588,32 |
|
|
|
A.V. BENEFICIOS ANTES DE IMPUESTOS
(A.II+A.IV-B.III-B.IV.) |
3.196.044,81 |
3.002.757,00 |
3.177.842,04 |
|
A.15. Impuesto sobre Sociedades |
1.027.837,46 |
943.090,61 |
1.089.943,82 |
|
A.16. Otros impuestos |
|
|
|
|
A.VI. RESULTADO DEL EJERCICIO (BENEFICIOS)
(A.V-A.15-A.16) |
2.168.207,35 |
2.059.666,39 |
2.087.898,22 |
|
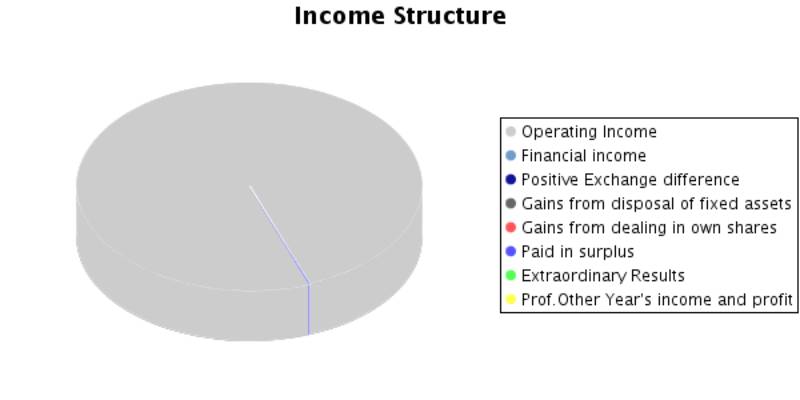
B) INGRESOS (B.1 a B.13) |
44.359.883,91 |
56.540.189,36 |
56.118.919,39 |
|
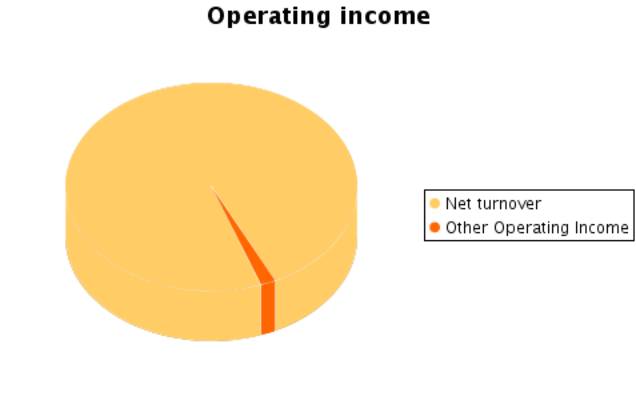
B.1. Importe neto de la cifra de negocios |
43.998.339,40 |
56.024.570,23 |
54.600.132,78 |
|
Ventas |
43.998.339,40 |
56.024.570,23 |
54.600.132,78 |
|
Prestaciones de servicios |
|
|
|
|
Devoluciones y “rappels” sobre ventas |
|
|
|
|
B.2. Aumento de existencias de productos
terminados y en curso de fabricación |
|
209.564,00 |
517.536,00 |
|
B.3. Trabajos efectuados por la empresa para el
inmovilizado |
|
|
240.761,49 |
|
B.4. Otros ingresos de explotación |
269.301,89 |
226.978,64 |
672.558,16 |
|
Ingresos accesorios y otros de gestión corriente |
269.301,89 |
226.978,64 |
672.558,16 |
|
Subvenciones |
|
|
|
|
Exceso de provisiones de riesgos y gastos |
|
|
|
|
B.I. PÉRDIDAS DE EXPLOTACIÓN
(A.1+A.2+A.3+A.4+A.5+A.6-B.1-B.2-B.3-B.4) |
|
|
|
|
B.5. Ingresos de participaciones en capital |
|
|
|
|
En empresas del grupo |
|
|
|
|
En empresas asociadas |
|
|
|
|
En empresas fuera del grupo |
|
|
|
|
B.6. Ingresos de otros valores negociables y de
créditos del activo inmovilizado |
|
|
|
|
De empresas del grupo |
|
|
|
|
De empresas asociadas |
|
|
|
|
De empresas fuera del grupo |
|
|
|
|
B.7. Otros intereses e ingresos asimilados |
29.654,30 |
22.488,17 |
26.342,68 |
|
De empresas del grupo |
|
|
|
|
De empresas asociadas |
|
|
|
|
Otros intereses |
29.654,30 |
22.488,17 |
26.342,68 |
|
Beneficios en inversiones financieras |
|
|
|
|
B.8. Diferencias positivas de cambio |
|
|
|
|
B.II. RESULTADOS FINANCIEROS NEGATIVOS
(A.7+A.8+A.9-B.5-B.6-B.7-B.8) |
191.224,61 |
227.982,43 |
415.627,78 |
|
B.III. PÉRDIDAS DE LAS ACTIVIDADES ORDINARIAS
(B.I+B.II-A.I-A.II) |
|
|
|
|
B.9. Beneficios en enajenación de inmovilizado
inmaterial, material y cartera de control |
6.000,00 |
|
|
|
B.10. Beneficios por operaciones con acciones y
obligaciones propias |
|
|
|
|
B.11. Subvenciones de capital transferidas al
resultado del ejercicio |
56.588,32 |
56.588,32 |
61.588,28 |
|
B.12. Ingresos extraordinarios |
|
|
|
|
B.13. Ingresos y beneficios de otros ejercicios |
|
|
|
|
B.IV. RESULTADOS EXTRAORDINARIOS NEGATIVOS
(A.10+A.11+A.12+A.13+A.14-B.9-B.10-B.11-B.12-B.13) |
|
4.460,93 |
2.761,07 |
|
B.V. PÉRDIDAS ANTES DE IMPUESTOS
(B.III+B.IV-A.III-A.IV) |
|
|
|
|
B.VI. RESULTADO DEL EJERCICIO (PERDIDAS)
(B.V+A.15+A.16) |
|
|
|
Composition of the
Profit and Loss Account
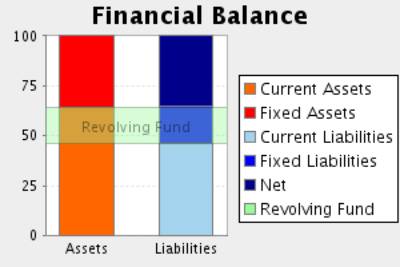
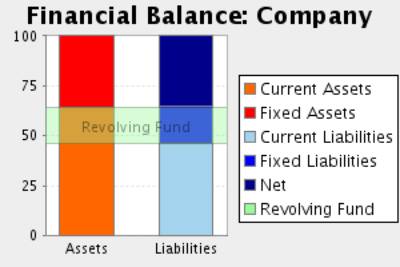
FINANCIAL BALANCE
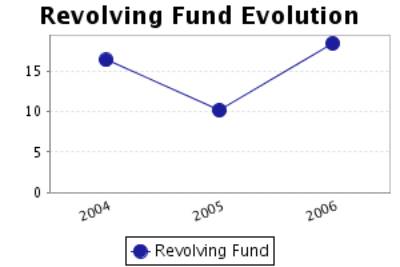
Here the Main Capital Amounts of the company and the Revolving Fund
Evolution are analysed.
Financial Balance
Table
Figures given in €
|
|
31/12/2004 (12) |
% |
31/12/2005 (12) |
% |
31/12/2006 (12) |
% |
|
A) ACCIONISTAS (SOCIOS) POR DESEMBOLSOS NO EXIGIDOS |
|
|
|
|
|
|
|
B) INMOVILIZADO |
8.551.314,22 |
25,71 |
11.064.372,23 |
31,47 |
15.765.429,05 |
35,62 |
|
C) GASTOS A DISTRIBUIR EN VARIOS EJERCICIOS |
|
|
|
|
|
|
|
D) ACTIVO CIRCULANTE |
24.712.719,93 |
74,29 |
24.099.240,31 |
68,53 |
28.491.370,77 |
64,38 |
|
TOTAL ACTIVO (A
+ B + C + D) |
33.264.034,15 |
|
35.163.612,54 |
|
44.256.799,82 |
|
|
|
||||||
|
A) FONDOS
PROPIOS |
13.387.686,29 |
40,25 |
14.363.249,00 |
40,85 |
15.421.314,02 |
34,85 |
|
B) INGRESOS A
DISTRIBUIR EN VARIOS EJERCICIOS |
336.840,53 |
1,01 |
280.252,21 |
0,80 |
223.663,93 |
0,51 |
|
C) PROVISIONES
PARA RIESGOS Y GASTOS |
288.290,88 |
0,87 |
|
|
|
|
|
D) ACREEDORES A
LARGO PLAZO |
|
|
|
|
8.300.929,12 |
18,76 |
|
E) ACREEDORES A
CORTO PLAZO |
19.251.216,45 |
57,87 |
20.520.111,33 |
58,36 |
20.310.892,75 |
45,89 |
|
F) PROVISIONES
PARA RIESGOS Y GASTOS A CORTO PLAZO |
|
|
|
|
|
|
|
TOTAL PASIVO (A + B + C + D + E + F) |
33.264.034,15 |
|
35.163.612,54 |
|
44.256.799,82 |
|
Financial Balance
Composition
Comments on Financial
Balance
In the 2004, the assets of the company were formed in 25,71% of Fixed
Assets and in 74,29% of Current Assets.This assets were financed in 41,26% with
own capitals, and in 0,87% with long term debt and in 57,87% with current
liabilities.
The result of this financial structure is a positive turnover fund of
5.461.503,48 Euros, which is equivalent to 16,42% proportion of the
company’s total assets.
In the 2005, the assets of the company were formed in 31,47% of Fixed
Assets and in 68,53% of Current Assets.This assets were financed in 41,64% with
own capitals and in 58,36% with current liabilities.
The result of this financial structure is a positive turnover fund of
3.579.128,98 Euros, which is equivalent to 10,18% proportion of the
company’s total assets.
This measure has diminished with respect to the previous exercise in
34,47% having also diminished its proportion with respect to the total assets
of the company.
In the 2006, the assets of the company were formed in 35,62% of Fixed
Assets and in 64,38% of Current Assets.This assets were financed in 35,35% with
own capitals, and in 18,76% with long term debt and in 45,89% with current
liabilities.
The result of this financial structure is a positive turnover fund of
8.180.478,02 Euros, which is equivalent to 18,48% proportion of the
company’s total assets.
This measure has increased with respect to the previous exercise in
128,56% having also increased its proportion with respect to the total assets
of the company.
RATIOS
Main Ratios
|
|
31/12/2004 (12) |
31/12/2005 (12) |
31/12/2006 (12) |
|
STRUCTURAL RATIOS |
|
|
|
|
Fondo maniobra |
5.461.503,48 |
3.579.128,98 |
8.180.478,02 |
|
Necesidad fondo maniobra |
7.797.065,30 |
5.614.065,12 |
13.716.429,35 |
|
Endeudamiento (%) |
58,74 |
58,36 |
64,65 |
|
Fondos ajenos sobre fondos propios |
1,42 |
1,40 |
1,83 |
|
GENERAL ACTIVITY RATIO |
|
|
|
|
Crecimiento de la cifra de negocio (%) |
4,77 |
27,33 |
-2,54 |
|
Crecimiento valor añadido (%) |
-0,88 |
2,22 |
16,99 |
|
Cash flow |
3.048.051,50 |
2.953.125,65 |
3.403.780,66 |
|
Productividad de la mano de obra |
2,34 |
2,22 |
2,27 |
|
Rotación de activos |
1,32 |
1,59 |
1,23 |
|
Punto muerto |
32.389.941,56 |
42.365.051,07 |
42.003.431,23 |
|
Margen de seguridad del punto muerto (%) |
26,83 |
24,69 |
24,34 |
|
ACTIVITY RATIOS |
|
|
|
|
Periodo medio de pago |
119 |
80 |
93 |
|
Periodo medio de cobro |
123 |
105 |
120 |
|
Periodo de rotación de inventario |
77 |
49 |
67 |
|
SOLVENCY RATIOS |
|
|
|
|
Capacidad devolución |
0,16 |
0,14 |
0,12 |
|
Garantía de activo |
1,70 |
1,71 |
1,55 |
|
Proporción de deudas a corto plazo (%) |
98,52 |
100,00 |
70,99 |
|
Cobertura de intereses |
13,38 |
10,64 |
6,33 |
|
LIQUIDITY RATIOS |
|
|
|
|
Ratio corriente |
1,28 |
1,17 |
1,40 |
|
Liquidez inmediata |
0,01 |
0,01 |
0,00 |
|
Tesorería |
-2.335.561,82 |
-2.034.936,14 |
-5.535.951,33 |
|
Ventas sobre activo circulante |
641 |
837 |
690 |
Results Analysis
Ratios
|
|
31/12/2004 (12) |
31/12/2005 (12) |
31/12/2006 (12) |
|
Rentabilidad económica (%) |
10,00 |
9,20 |
8,13 |
|
Rentabilidad de explotación (%) |
7,56 |
5,78 |
6,59 |
|
Apalancamiento financiero |
2,28 |
2,23 |
2,50 |
|
Rentabilidad financiera (%) |
15,80 |
14,06 |
13,34 |
|
Rentabilidad general (%) |
4,93 |
3,68 |
3,82 |
Comments on the
Results Analysis Ratios
The economic profitability in the year2005 achieved a 9,20% positive
level, due to a 5,78% economic margin and to an assets turnover of1,59%.
The economic profitability in the year has reduced from 10,00% up to
9,20% of2005, even if it remains positive. Assets turnover increase whose index
has passed from 1,32 to 1,59, could not compensate operating profitability
reduction from7,56% to the current level of 5,78%.
Financial profitability on 2005 achieved a 14,06%.
The company’s financial structure has instigated its economic
profitability with an indebtedness level of 2,23.
The general profitability on 2005 achieved a 3,68%.
The economic profitability in the year2006 achieved a 8,13% positive
level, due to a 6,59% economic margin and to an assets turnover of1,23%.
The economic profitability in the year has reduced from 9,20% up to
8,13% of2006, even if it remains positive. The decrease in assets turnover from
1,59% to the current level of 1,23has provoked this drop, which has not been
compensated by the parallel increase of the economic margin from 6,59% to
5,78%.
Financial profitability on 2006 achieved a 13,34%.
The company’s financial structure has instigated its economic
profitability with an indebtedness level of 2,50.
The general profitability on 2006 achieved a 3,82%.
SECTORIAL ANÁLYSIS
Large Capital Amounts
and Financial Balance
Figures given in %
|
|
COMPANY (2006) |
SECTOR |
DIFFERENCE |
DIFFERENCE RELATIVE |
|
|
|
|
|
|
ASSETS |
|
|
|
|
|
|
|
|
|
|
A) ACCIONISTAS (SOCIOS) POR DESEMBOLSOS NO EXIGIDOS |
|
0,00 |
|
|
|
|
|
|
|
|
B) INMOVILIZADO |
35,62 |
44,97 |
-9,35 |
-20,79 |
|
|
|
|
|
|
C) GASTOS A DISTRIBUIR EN VARIOS EJERCICIOS |
|
1,15 |
|
|
|
|
|
|
|
|
D) ACTIVO CIRCULANTE |
64,38 |
53,88 |
10,50 |
19,48 |
|
|
|
|
|
|
TOTAL ACTIVO (A + B + C + D) |
100 |
100 |
|
|
|
|
|
|
|
|
|
|
|
|
|
|
|
|
|
|
|
|
COMPANY (2006) |
SECTOR |
DIFFERENCE |
DIFFERENCE RELATIVE |
|
|
|
|
|
|
LIABILITIES |
|
|
|
|
|
|
|
|
|
|
A) FONDOS PROPIOS |
34,85 |
47,60 |
-12,75 |
-26,78 |
|
|
|
|
|
|
B) INGRESOS A
DISTRIBUIR EN VARIOS EJERCICIOS |
0,51 |
0,34 |
0,17 |
51,79 |
|
|
|
|
|
|
C) PROVISIONES
PARA RIESGOS Y GASTOS |
|
4,64 |
|
|
|
|
|
|
|
|
D) ACREEDORES A
LARGO PLAZO |
18,76 |
12,61 |
6,15 |
48,77 |
|
|
|
|
|
|
E) ACREEDORES A
CORTO PLAZO |
45,89 |
34,81 |
11,08 |
31,82 |
|
|
|
|
|
|
F) PROVISIONES
PARA RIESGOS Y GASTOS A CORTO PLAZO |
|
0,00 |
|
|
|
|
|
|
|
|
TOTAL PASIVO (A + B + C + D + E + F) |
100 |
100 |
|
|
|
|
|
|
|
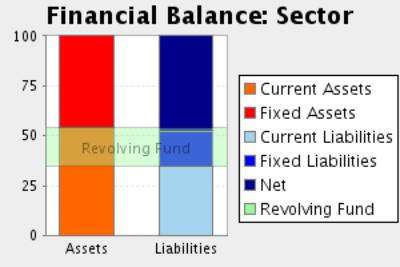
Financial Balance
Composition
Comments to the
Sectorial Analysis
In the 2006, the assets of the company were formed in 35,62% of fixed
assets and in 64,38Current Assets % In the sector, the proportion of fixed
assets was of 46,12%, 22,76% superior, and the proportion of current assets was
of 53,88%, 19,48% inferior.
The assets were financed in the company in 35,35% with own capitals , in
18,76% with fixed liabilities and in 45,89% with current liabilities In the
sector, the self financing represented 47,93%, 26,25% superior. On the other
hand the long term debts represented in the sector an average of 17,26%
financing, with a relative difference of 8,72% in favour of the companyAnd,
short term liabilities represented in the sector an average of 34,81%
financing, with a relative difference of 31,82% in favour of the company
The result of this company’s financial structure is a turnover fund that
represents 18,48% of the total assets; in the sector, this same proportion is
19,07%, therefore, we can say that the company’s turnover fund is 3,09% smaller
than the sector one.
Analytical Account of
Results
Figures given in %
|
|
COMPANY (2006) |
SECTOR |
DIFFERENCE |
DIFFERENCE RELATIVE |
|
Importe neto de la cifra de negocios |
98,35 |
97,88 |
0,47 |
0,48 |
|
Otros ingresos de explotación |
1,65 |
2,12 |
-0,47 |
-22,24 |
|
Valor de la Producción |
100,00 |
100,00 |
0,00 |
0,00 |
|
Consumos explotación |
73,38 |
70,14 |
3,24 |
4,62 |
|
Otros gastos explotación |
10,81 |
12,34 |
-1,53 |
-12,37 |
|
Valor Añadido |
15,81 |
17,53 |
-1,72 |
-9,79 |
|
Gastos de Personal |
6,96 |
9,05 |
-2,09 |
-23,07 |
|
Resultado Económico Bruto |
8,85 |
8,48 |
0,37 |
4,36 |
|
Dotaciones para amortizaciones de inmovilizado |
2,08 |
3,35 |
-1,27 |
-37,85 |
|
Variación de las provisiones de tráfico y pérdidas de crédito
incobrables |
0,29 |
-0,01 |
0,30 |
-2.736,36 |
|
Resultado Económico Neto |
6,48 |
5,14 |
1,34 |
26,00 |
|
Ingresos financieros |
0,05 |
1,34 |
-1,29 |
-96,28 |
|
Gastos financieros |
0,80 |
1,00 |
-0,19 |
-19,60 |
|
Variación de las provisiones de inv. financieras |
|
0,03 |
|
|
|
Resultado Actividades Ordinarias |
5,73 |
5,47 |
0,26 |
4,83 |
|
Ingresos extraordinarios |
0,11 |
0,38 |
-0,27 |
-71,20 |
|
Gastos extraordinarios |
0,12 |
1,22 |
-1,10 |
-90,13 |
|
Variación de las provisiones de inmovilizado inmaterial, material y
cartera de control |
|
0,06 |
|
|
|
Resultado Antes Impuestos |
5,72 |
4,57 |
1,15 |
25,22 |
|
Impuesto sobre sociedades |
1,96 |
1,74 |
0,22 |
12,39 |
|
Resultado Neto |
3,76 |
2,82 |
0,94 |
33,14 |
|
Dotaciones para amortizaciones de inmovilizado |
2,08 |
3,35 |
-1,27 |
-37,85 |
|
Variación de provisiones |
0,29 |
0,08 |
0,21 |
262,50 |
|
Autofinanciación Neta |
6,13 |
6,25 |
-0,12 |
-1,94 |
Main Ratios
|
|
COMPANY (2006) |
PTILE25 |
PTILE50 |
PTILE75 |
|
STRUCTURAL RATIOS |
|
|
|
|
|
Fondo maniobra |
8.180.478,02 |
6.108,83 |
12.492,43 |
24.104,98 |
|
Necesidad fondo maniobra |
13.716.429,35 |
-17.618,96 |
1.535,44 |
11.982,12 |
|
Endeudamiento (%) |
64,65 |
33,71 |
59,20 |
68,65 |
|
Fondos ajenos sobre fondos propios |
1,83 |
0,51 |
1,45 |
2,19 |
|
GENERAL ACTIVITY RATIO |
|
|
|
|
|
Crecimiento de la cifra de negocio (%) |
-2,54 |
-14,54 |
0,97 |
8,53 |
|
Crecimiento valor añadido (%) |
16,99 |
-49,08 |
-30,44 |
-0,34 |
|
Cash flow |
3.403.780,66 |
2.049,18 |
5.725,49 |
10.268,28 |
|
Productividad de la mano de obra |
2,27 |
1,43 |
2,09 |
3,44 |
|
Rotación de activos |
1,23 |
0,91 |
1,68 |
2,03 |
|
Punto muerto |
42.003.431,23 |
40.921.583,19 |
80.970.663,09 |
165.781.342,66 |
|
Margen de seguridad del punto muerto (%) |
24,34 |
3,02 |
20,45 |
36,34 |
|
ACTIVITY RATIOS |
|
|
|
|
|
Periodo medio de pago |
93 |
37 |
70 |
96 |
|
Periodo medio de cobro |
120 |
81 |
93 |
107 |
|
Periodo de rotación de inventario |
67 |
34 |
50 |
70 |
|
SOLVENCY RATIOS |
|
|
|
|
|
Capacidad devolución |
0,12 |
0,05 |
0,13 |
0,30 |
|
Garantía de activo |
1,55 |
1,45 |
1,66 |
2,97 |
|
Proporción de deudas a corto plazo (%) |
70,99 |
65,50 |
87,86 |
98,56 |
|
Cobertura de intereses |
6,33 |
2,49 |
7,51 |
53,88 |
|
LIQUIDITY RATIOS |
|
|
|
|
|
Ratio corriente |
1,40 |
1,17 |
1,75 |
2,43 |
|
Liquidez inmediata |
0,00 |
0,01 |
0,10 |
0,69 |
|
Tesorería |
-5.535.951,33 |
-7.698,93 |
95,64 |
9.497,90 |
|
Ventas sobre activo circulante |
690 |
571 |
843 |
993 |
Results Analysis
Ratios
|
|
COMPANY (2006) |
PTILE25 |
PTILE50 |
PTILE75 |
|
Rentabilidad económica (%) |
8,13 |
1,37 |
6,43 |
14,18 |
|
Rentabilidad de explotación (%) |
6,59 |
0,83 |
4,92 |
9,78 |
|
Apalancamiento financiero |
2,50 |
1,44 |
1,76 |
2,89 |
|
Rentabilidad financiera (%) |
13,34 |
0,46 |
10,93 |
20,49 |
|
Rentabilidad general (%) |
3,82 |
0,20 |
3,15 |
7,52 |
NOTES
ABOUT YOUR REQUEST:
The data of your request are correct.
In spite of investigations using every source available (public and
private), no additional details than those contained in this report
are available. .
FOREIGN EXCHANGE
RATES
|
Currency |
Unit
|
Indian Rupees |
|
US Dollar |
1 |
Rs.43.30 |
|
UK Pound |
1 |
Rs.86.13 |
|
Euro |
1 |
Rs.68.72 |
RATING
EXPLANATIONS
|
RATING |
STATUS |
PROPOSED CREDIT LINE |
|
|
>86 |
Aaa |
Possesses an extremely sound financial base with the strongest
capability for timely payment of interest and principal sums |
Unlimited |
|
71-85 |
Aa |
Possesses adequate working capital. No caution needed for credit
transaction. It has above average (strong) capability for payment of interest
and principal sums |
Large |
|
56-70 |
A |
Financial & operational base are regarded healthy. General unfavourable
factors will not cause fatal effect. Satisfactory capability for payment of
interest and principal sums |
Fairly Large |
|
41-55 |
Ba |
Overall operation is considered normal. Capable to meet normal
commitments. |
Satisfactory |
|
26-40 |
B |
Unfavourable & favourable factors carry similar weight in credit
consideration. Capability to overcome financial difficulties seems
comparatively below average. |
Small |
|
11-25 |
Ca |
Adverse factors are apparent. Repayment of interest and principal sums
in default or expected to be in default upon maturity |
Limited with
full security |
|
<10 |
C |
Absolute credit risk exists. Caution needed to be exercised |
Credit not
recommended |
|
NR |
In view of the lack of information, we have no basis upon which to
recommend credit dealings |
No Rating |
|
This score serves as a reference to assess SC’s credit risk
and to set the amount of credit to be extended. It is calculated from a composite
of weighted scores obtained from each of the major sections of this report. The
assessed factors and their relative weights (as indicated through %) are as
follows:
Financial
condition (40%) Ownership
background (20%) Payment
record (10%)
Credit history
(10%) Market trend
(10%) Operational
size (10%)